New Home Sales Unexpectedly Jump as Average Prices See Record Drop
August new home sales beat every forecast on a shift to lower priced homes. The average new home price fell $47,700 in a single month, the largest dollar drop on record.
You've reached your free article limit
You've read 0 of 1 free Pro articles.
- U.S. New Home Sales, August: 684,000 (estimate 616,000; previous 607,000; previous revised 643,000)
- New home sales, month over month: 6.4% (estimate 1.3%; previous minus 10.5%; previous revised minus 4.3%)
- Median sales price: $393,700, or minus 5.8% from August 2025 (previous $392,200, or minus 0.9% from July 2025)
Note: New-home purchases normally account for about 10% of total home sales and are calculated when contracts are signed, so they do not account for cancellations (so can overstate sales when cancellations are high). Most of what is reported in the media is seasonally adjusted, so I report on that basis as well. Finally, note that this report is subject to significant revisions — the 90% confidence interval for the month-over-month figure in this report is a huge ±19.5%.
Executive Summary:
- August new home sales unexpectedly rose 41,000 (6.4%) to a 684,000 seasonally adjusted annual rate, the highest since December 2025 and well above the 616,000 consensus, even as July was revised up sharply to 643,000. Sales remain down 2.0% year-over-year and 2.9% year-to-date. The Midwest jumped a record 84.9%, though mostly a rebound from July’s collapse, while the largest market, the South, rose 6.9% to its highest since November 2025.
- The average selling price collapsed $47,700 (9.1%) to $478,700, the largest one-month dollar decline on record and the least since August 2024, while the median edged up 0.4% to $393,700 but is down 5.8% year-over-year, the steepest annual drop since July 2025. The divergence reflects a shift at both ends of the market, with sub-$300,000 sales rising to 22% of the total and the $1 million-plus bracket falling to 4%.
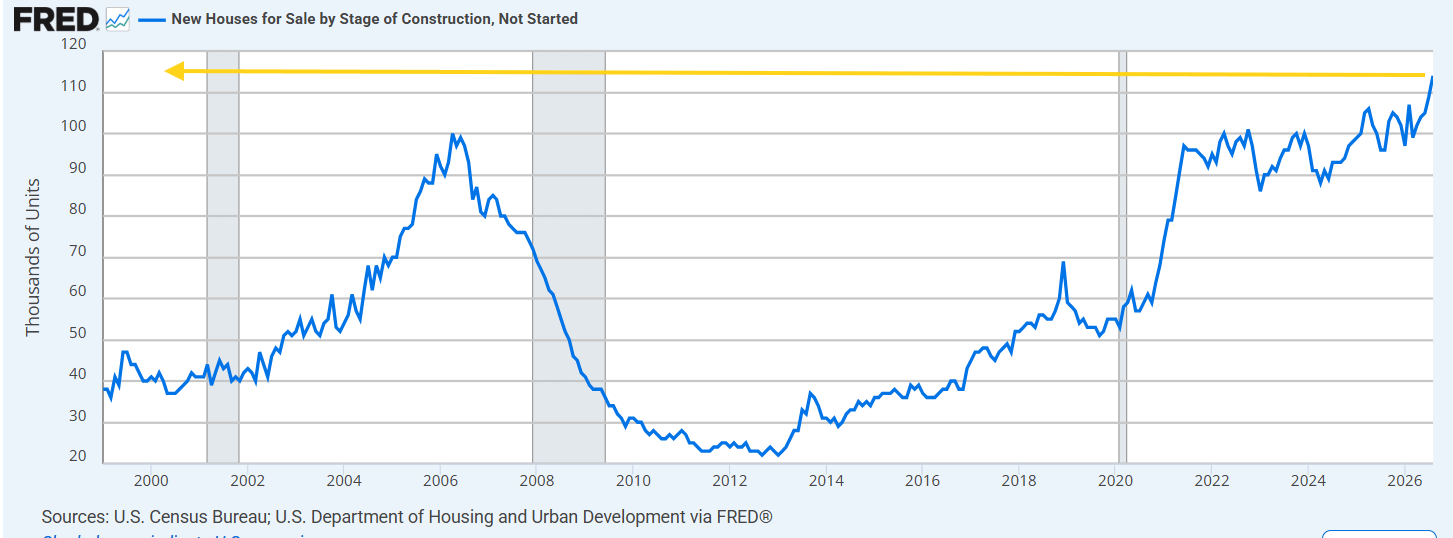
- Supply was unchanged at 483,000, but the faster sales pace pulled months of supply down to 8.5 from 9.0, the least since December 2025 and still well above the normal four-to-six-month range. Completed inventory fell to 113,000, the least since February 2025, while homes not started rose to a record 114,000 as builders hold back starts until standing inventory clears.
- Now let’s take a look with a lot more details and analysis.
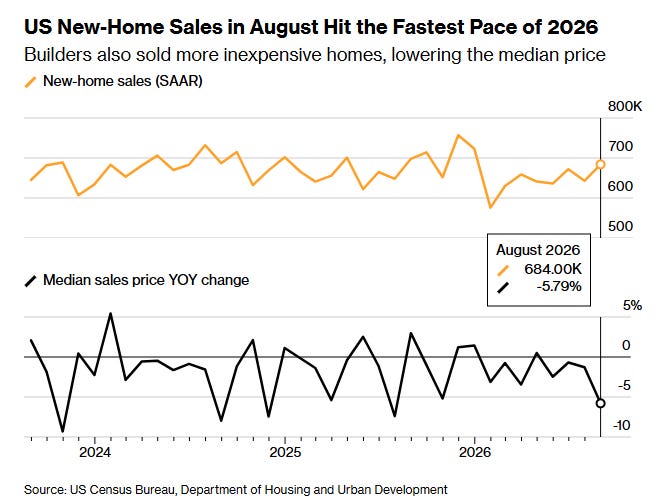
The seasonally adjusted annual rate for new home sales unexpectedly rose 41,000 (6.4%) in August from July (m/m), the largest monthly percentage gain since February, to a 684,000 seasonally adjusted annual sales rate (SAAR), the highest since December 2025 and well above the 616,000 consensus, as builders leaned on price cuts and incentives to move inventory.
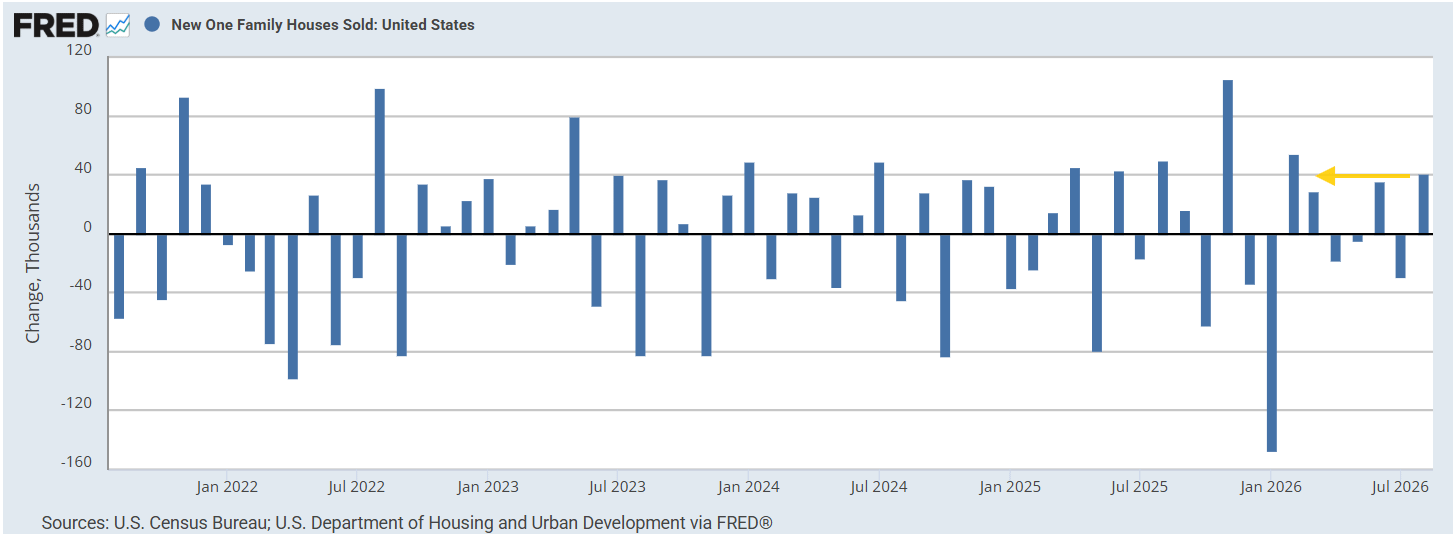
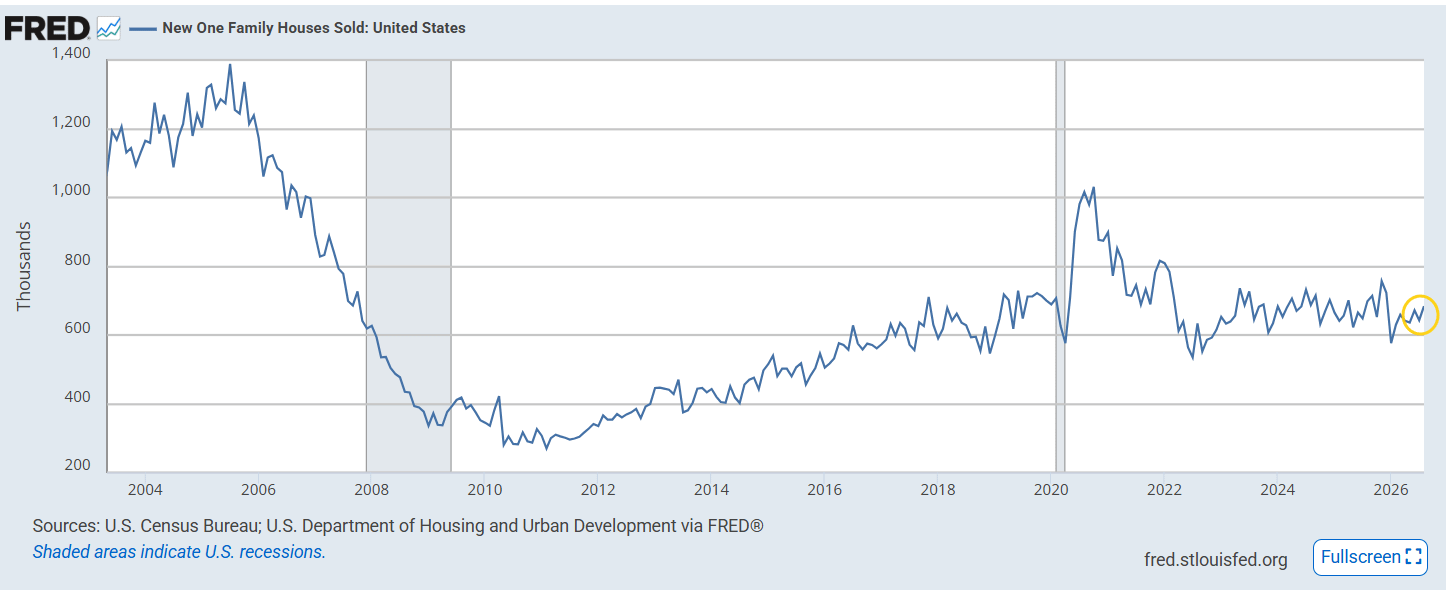
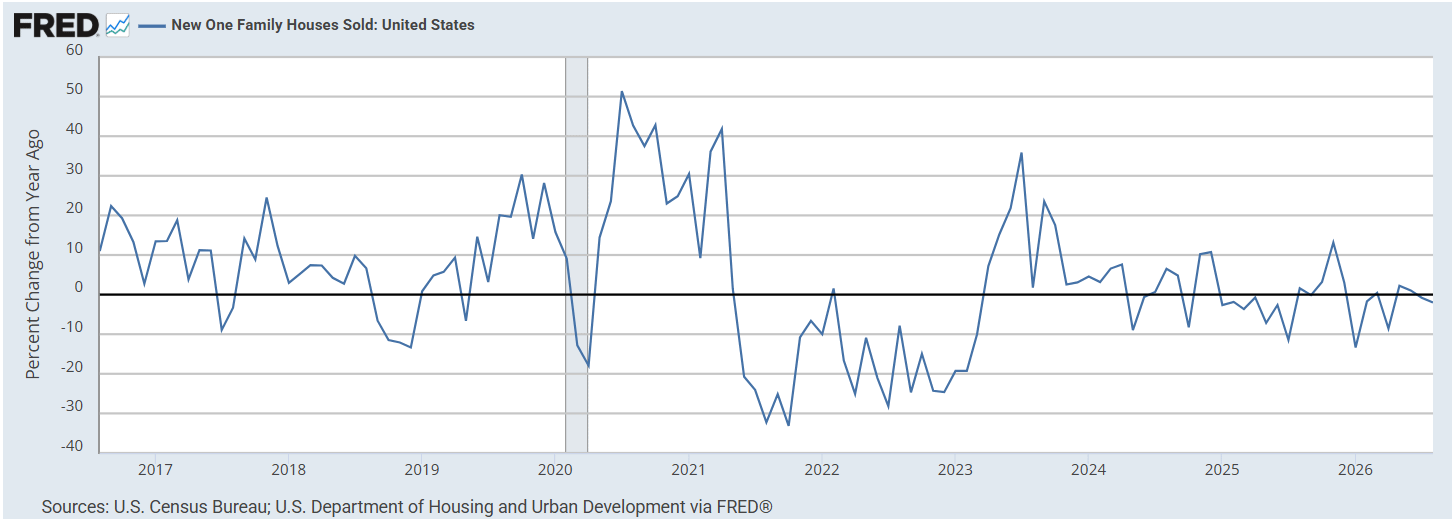
The above consensus sales pace was even as July was revised up sharply to 643,000 from 607,000, cutting that month’s decline to 4.3% from 10.5%. Sales are still down 2.0% year-over-year, and down 2.9% year-to-date.
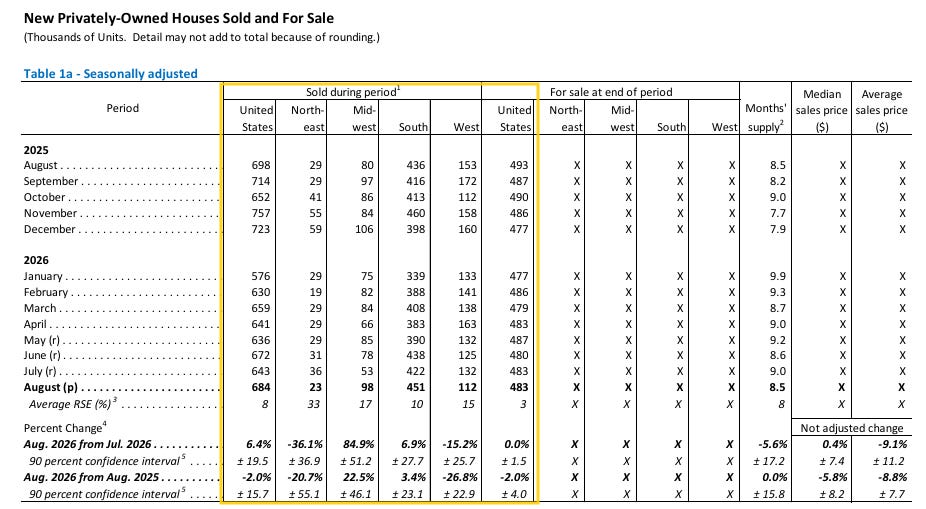
By region, the Midwest jumped 84.9% month-over-month to 98,000 — the largest monthly gain on record in data back to January 1973 — though entirely a rebound from July’s collapse to 53,000, and it is up 22.5% year-over-year to the highest since December 2025.
The South, the largest market representing over 60% of all new home sales, rose 6.9% to 451,000, the highest since November 2025, and is up 3.4% year-over-year. The Northeast fell 36.1% to 23,000, the lowest since February 2026, and is down 20.7% year-over-year. The West fell 15.2% to 112,000, tying October 2025 for the lowest since July 2022, and is down 26.8% year-over-year.
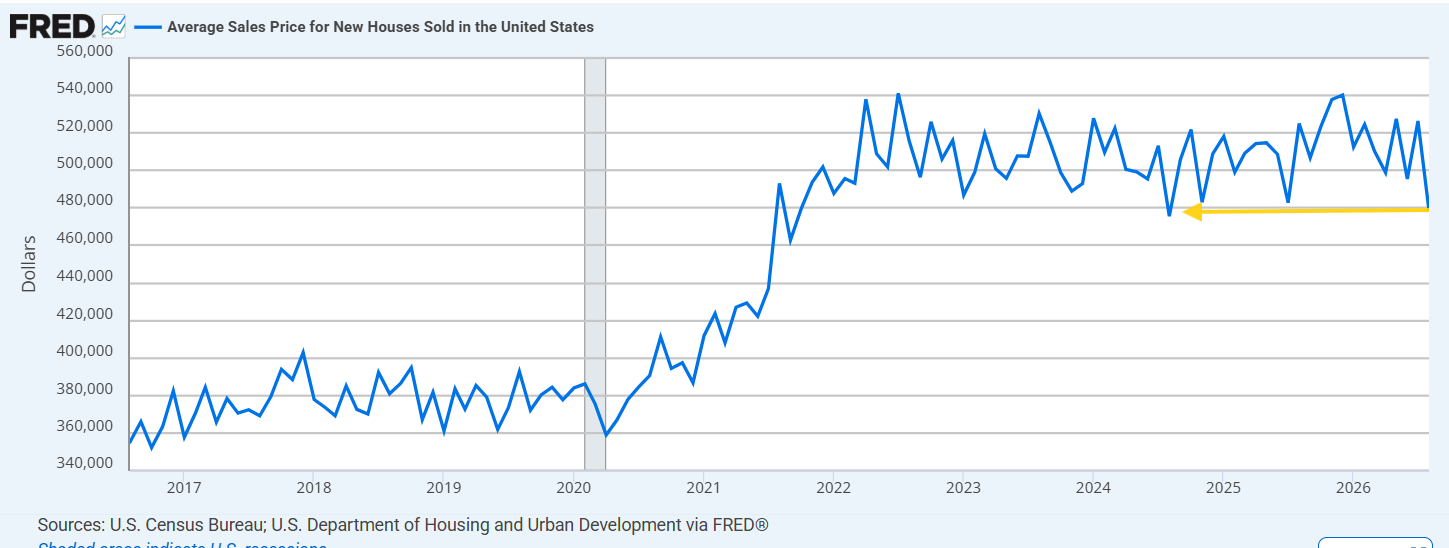
The average sales price collapsed $47,700 (9.1%) from July to $478,700, the largest one-month dollar decline on record.
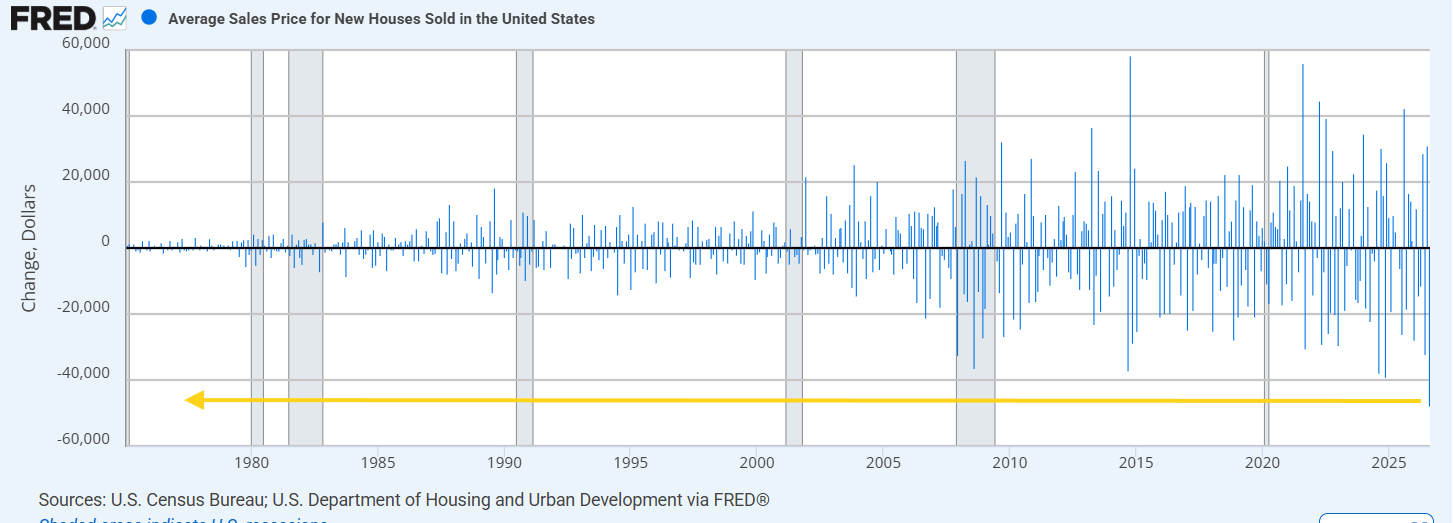
In percentage terms it was the largest since September 2014.
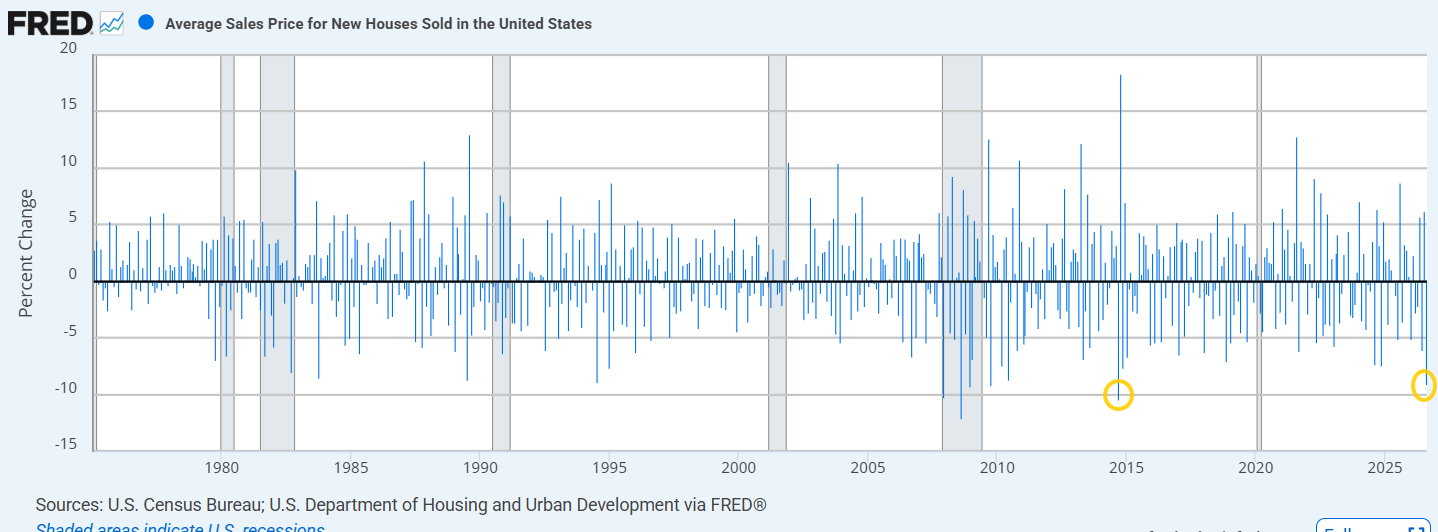
That took the average selling price to the least since August 2024, down 8.8% year-over-year.
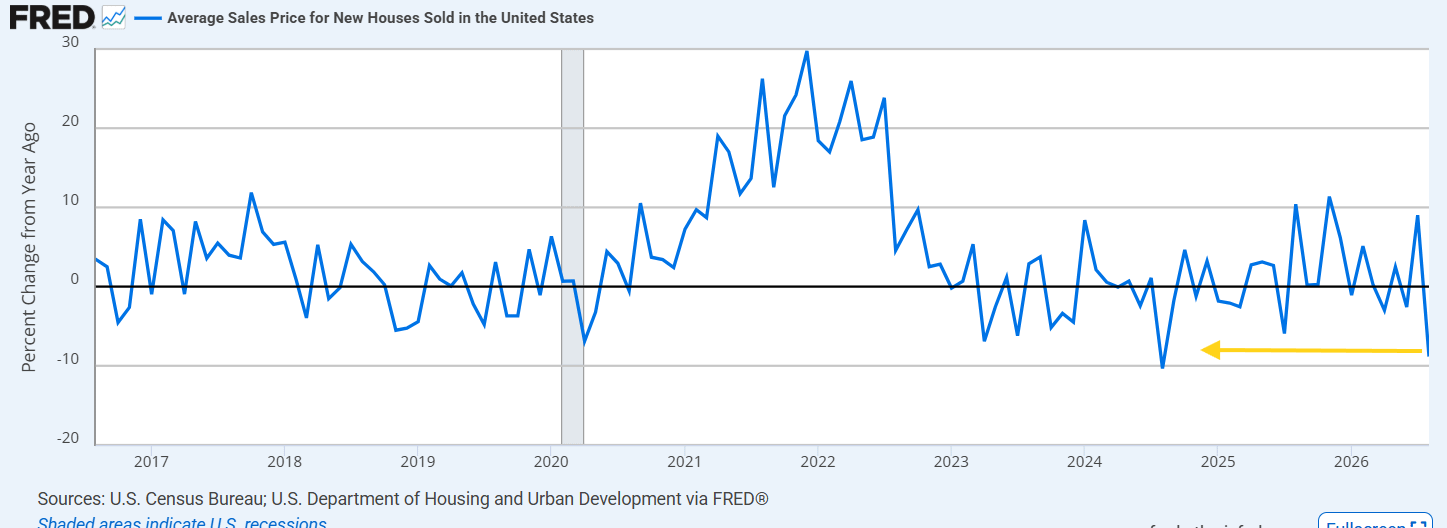
That though was in sharp contrast to the median price which edged up 0.4% from July (which at $392,200 was the least since July 2021) to $393,700, though it is down 5.8% year-over-year, the largest annual decline since July 2025, when it fell 7.4%.
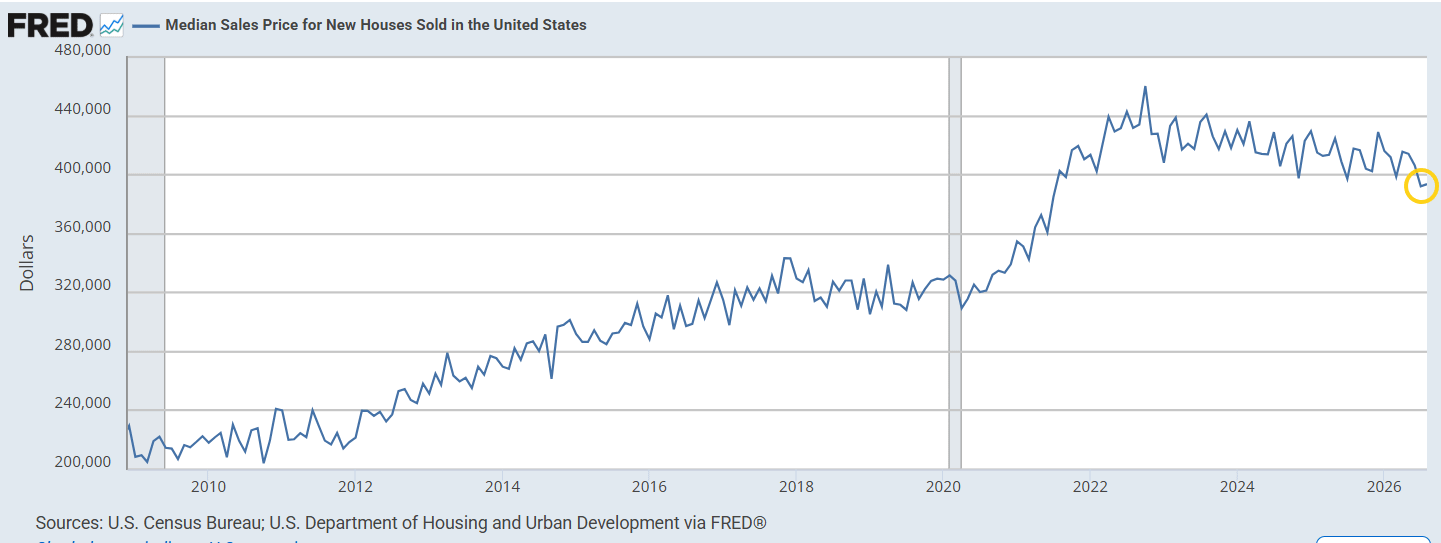
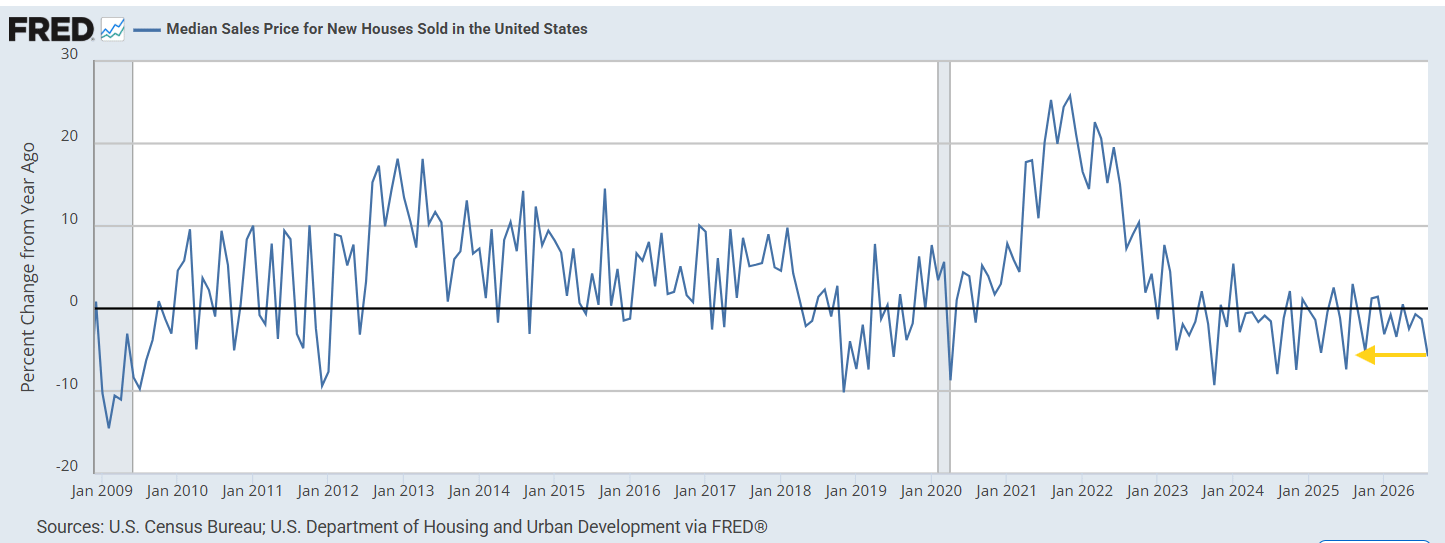
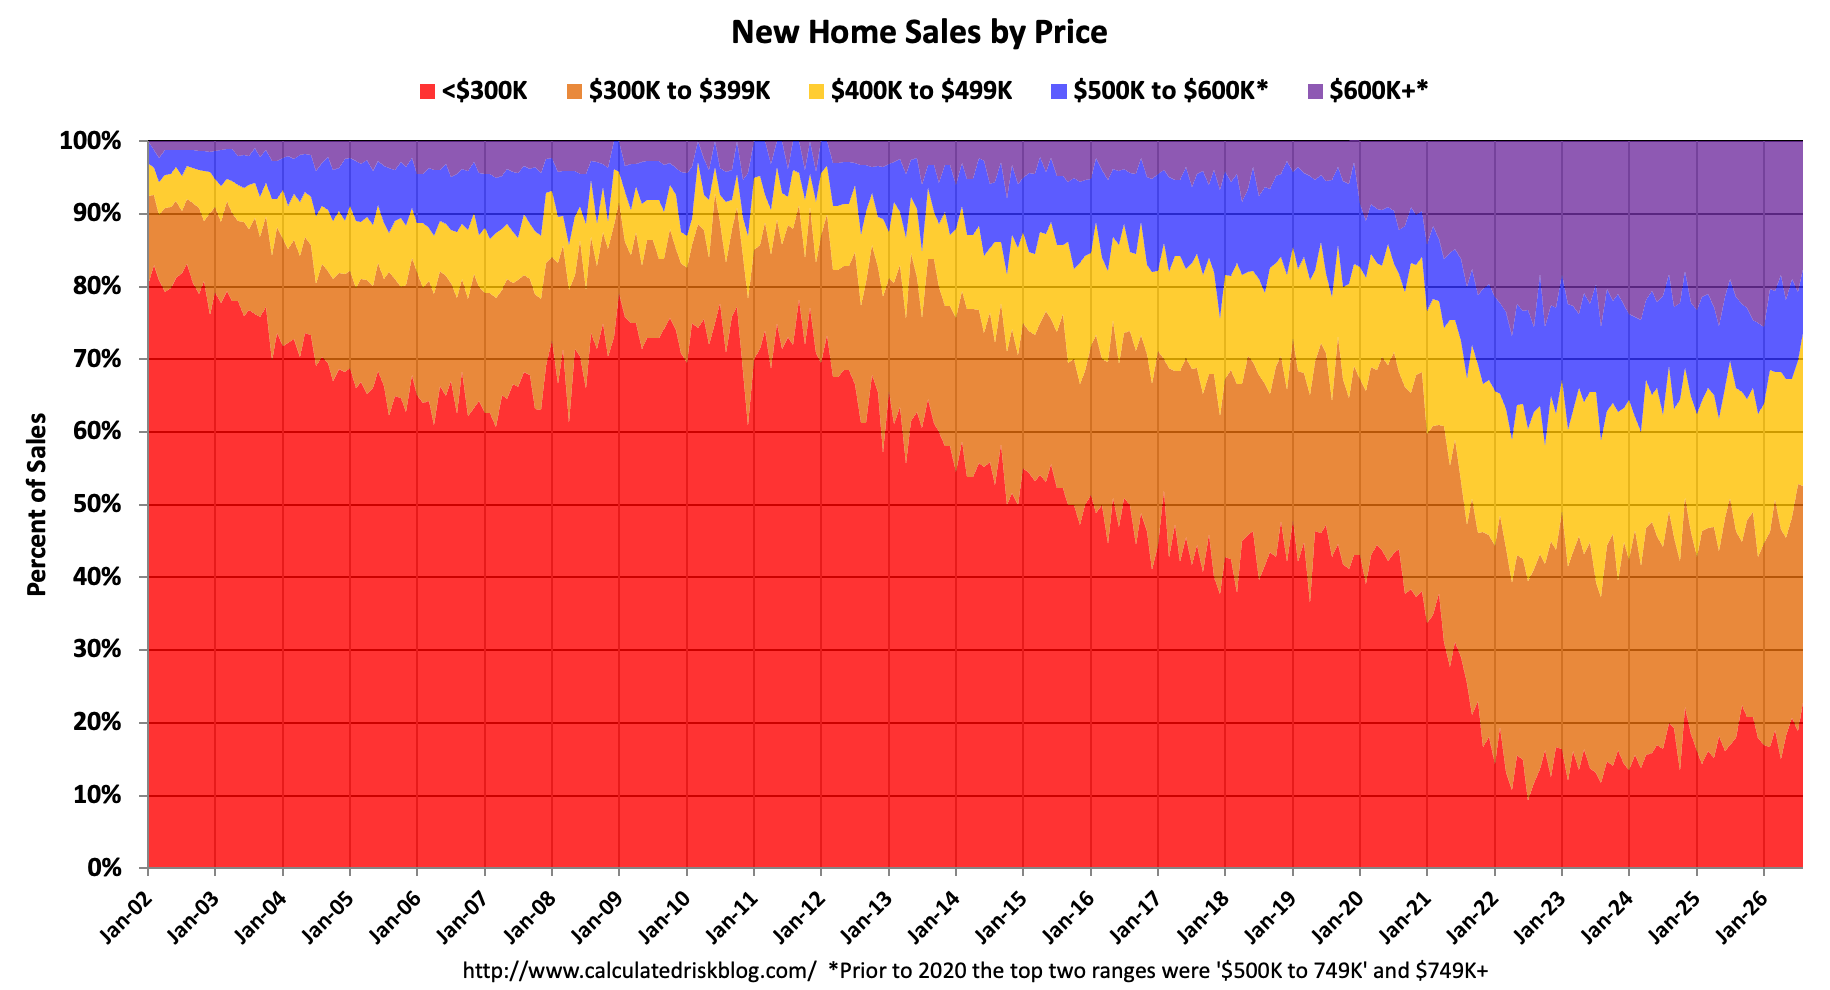
The gap between the two reflects shifts in the extremes of the market in August. Sales under $300,000 rose to 22% of the total from 19%, while the $1 million-and-over bracket fell to 4% from 6%.
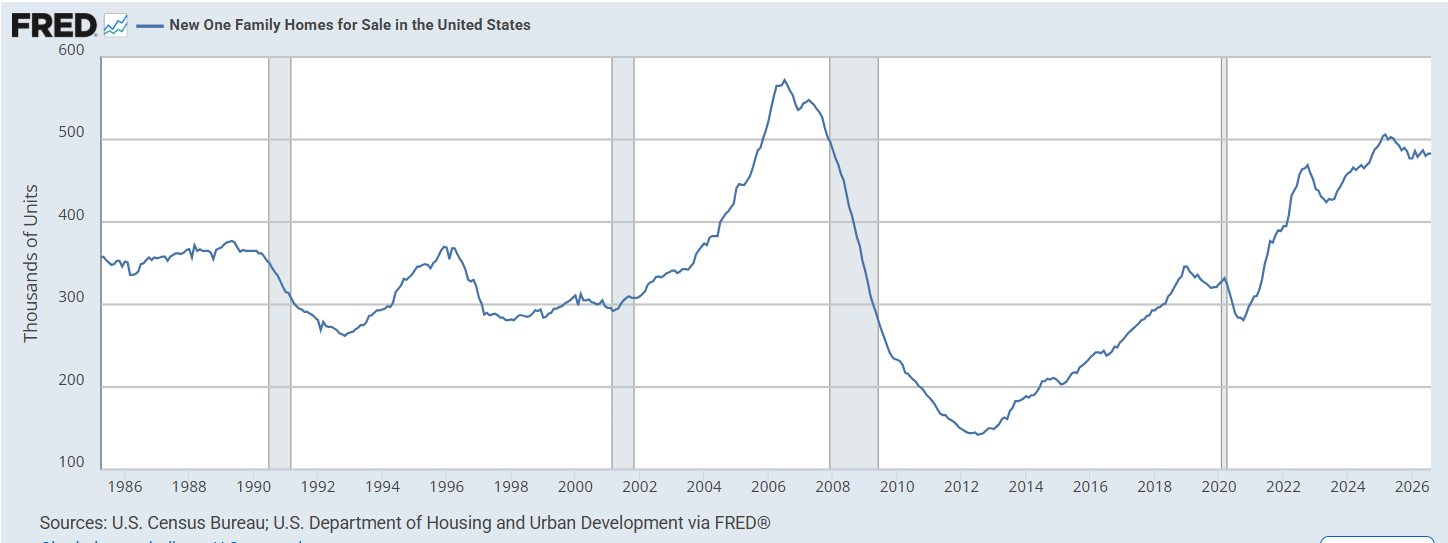
New home supply was unchanged at 483,000, down 2.0% year-over-year.
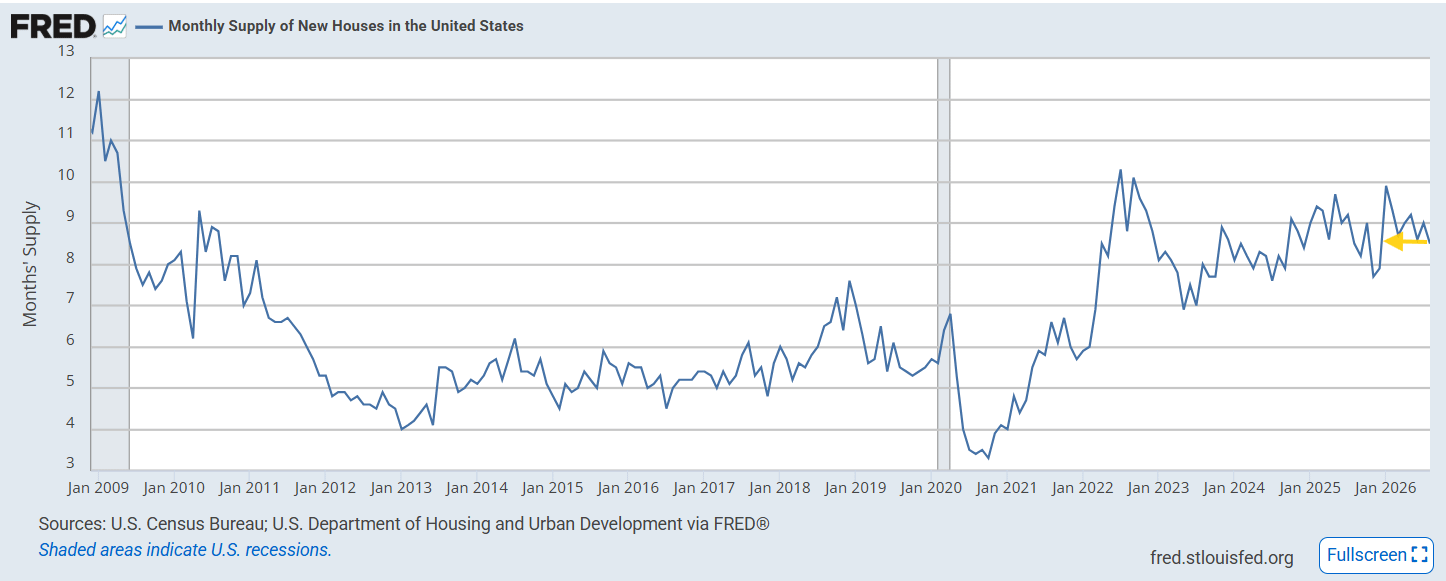
With the jump in the sales pace, though, the months of supply at the current sales rate fell to 8.5 from 9.0, the least since December 2025, though still well above the “normal” range of four to six months.
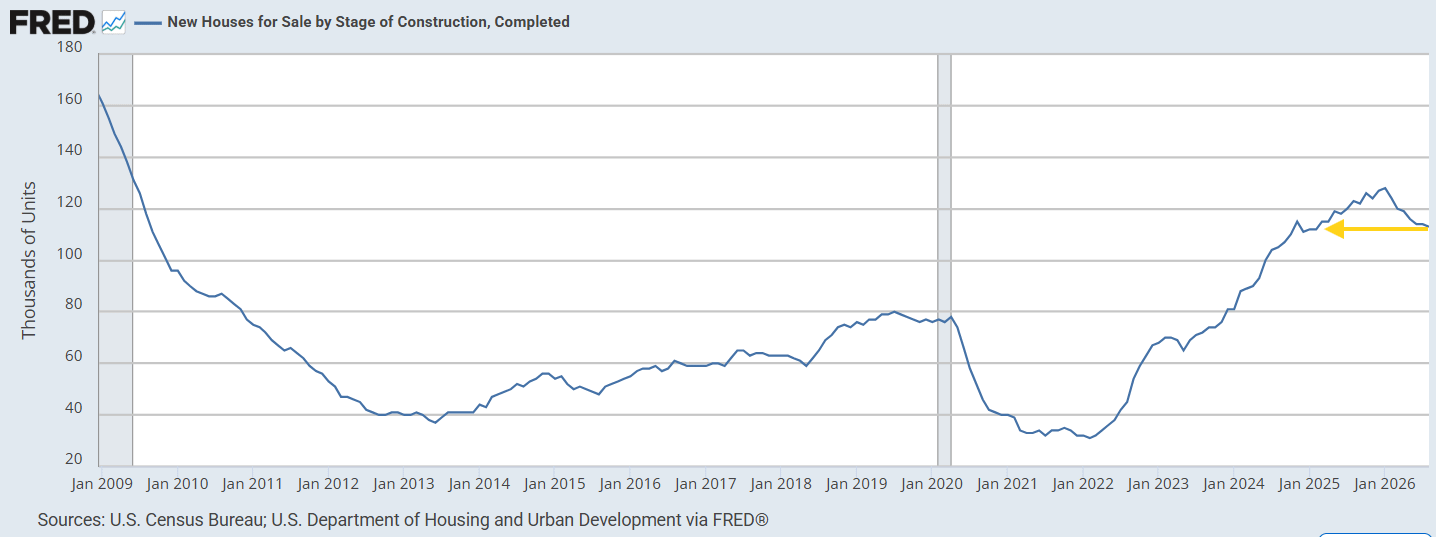
In terms of the mix of that supply, the inventory of completed homes for sale fell to 113,000, the least since February 2025, and down from January’s 128,000, which was the highest since June 2007. It remains more than triple the record low of 31,000 in February 2022.
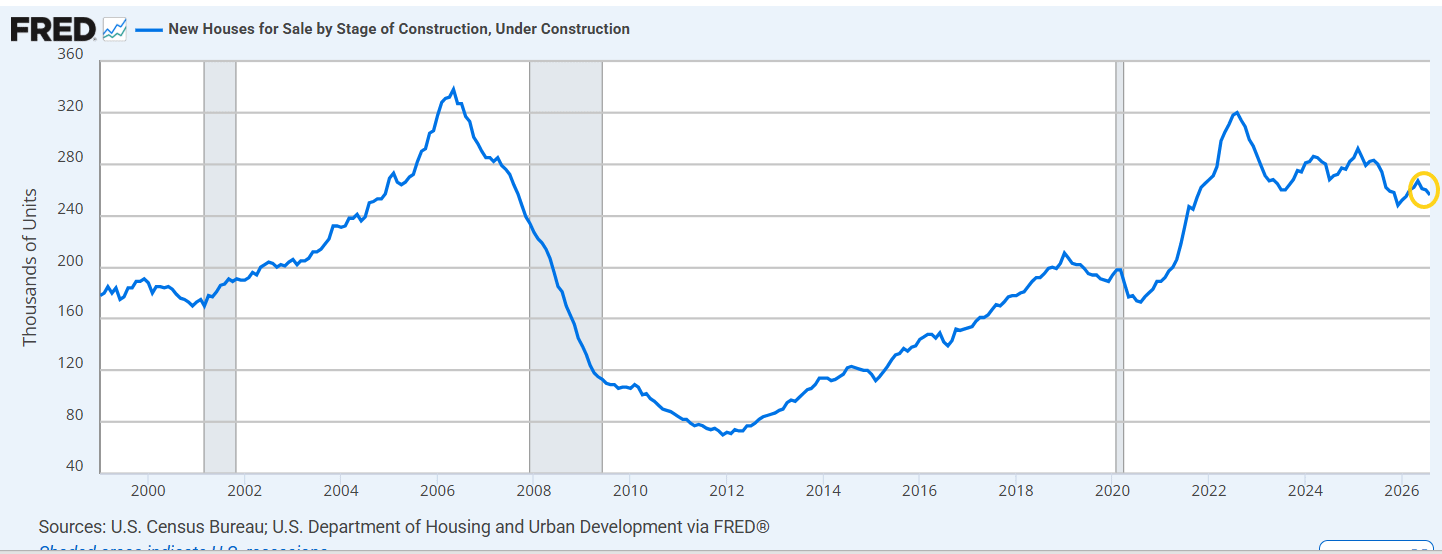
The inventory of homes under construction edged down to 256,000, well below the cycle peak of 320,000 in August 2022, but still above the 198,000 of February 2020.
The inventory of homes not started, though, rose to 114,000, a new record high, and more than double the 55,000 of January 2020.
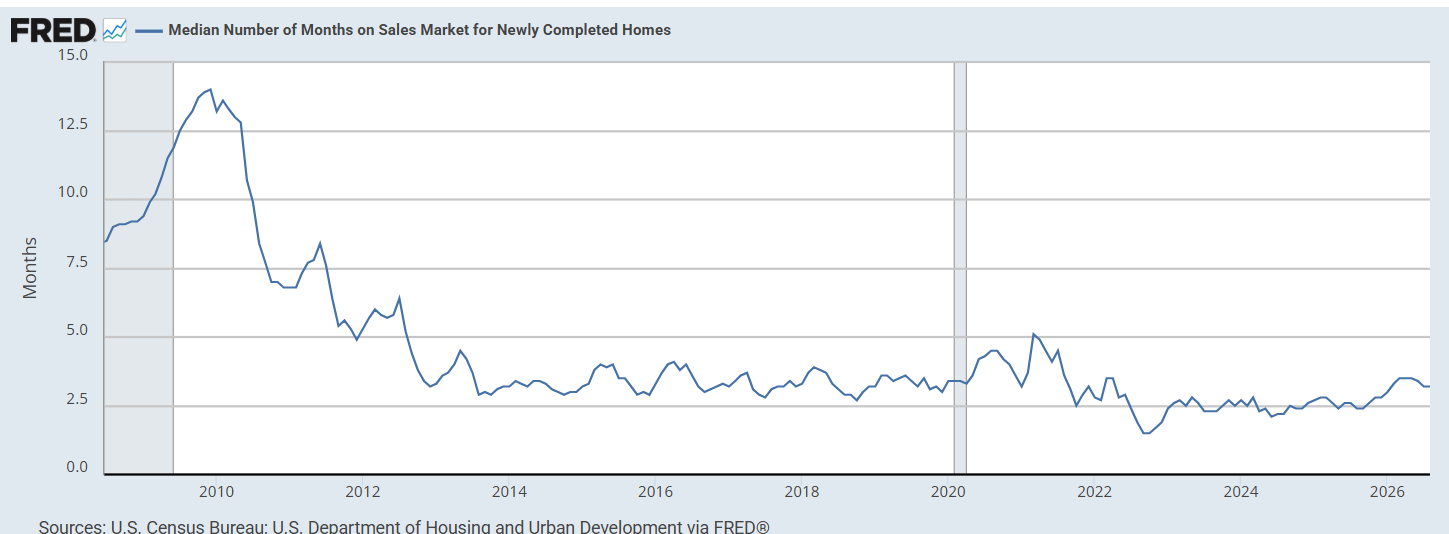
The median months to sell a completed home held at 3.2, unchanged from July and down from the 3.5 that prevailed from March through May, which was the highest since 2021.