Darden Restaurants Defends One of the Worst Balance Sheets I’ve Ever Seen
The restaurant group’s president and CEO offered a forward-looking message after earnings.
You've reached your free article limit
You've read 0 of 1 free Pro articles.

On Thursday morning, Darden Restaurants (DRI) released the firm’s fiscal first quarter financial results.
For the three-month period ended August 30, Darden posted an adjusted EPS of $2.05 on revenue of $3.2 billion. While that adjusted bottom-line print just met expectations, the sale number, which was up 6.7% year over year, fell short of the consensus view. Blended same store sales grew 3.1% year over year based on impressive strength at Longhorn Steakhouse. Unfortunately, Olive Garden and some of the firm’s other brands did not grow comparable sales as well.
Darden President and CEO Rick Cardenas commented in the press release:
“The first quarter was a solid start to our fiscal year with each of our segments delivering positive same-restaurant sales. The performance across our portfolio reinforces the importance of having distinctive brands, each with a clear strategy, supported by Darden’s scale and other competitive advantages. Looking ahead, our focus remains the same: operate our restaurants at a high level, strengthen guest loyalty, invest in our people and brands, and deploy capital in ways that support long-term shareholder value.”
Operations
As sales grew 6.7% to $3.2 billion, total GAAP costs and expenses increased 6.5% to $2.881 billion. That left a GAAP operating income of $319.3 million (-5.9%). After accounting for interest, other income and expenses as well as taxes, GAAP net income printed at $233.4 million (-9.5%). This worked out to a fully diluted $2.04 per share, down from the year ago comp of $2.19. Adjusted for store closings, that EPS print moves up a penny to $2.05, also down from $2.19.
Segment Performance
Olive Garden: Generated sales of $1.33 billion (+2.2%), producing a segment profit of $270.8 million (+1.2%)
Longhorn Steakhouse: Generated sales of $860.9 million (+10.9%), producing a segment profit of $154.6 million (+14.6%)
Fine Dining: Generated sales of $304.2 million (+6.2%), producing a segment profit of $39.6 million (+2.3%)
Other: Generated sales of $705.4 million (+3.6%), producing a segment profit of $111.5M (+2%)
Guidance
For the full fiscal year, Darden reaffirmed its outlook for a fully diluted EPS of $11.10 to $11.35. That was a bit on the light side as this pulls the midpoint of the range of expectations below the $11.30 that Wall Street was looking for.
Fundamentals
For the period reported, Draden generated operating cash flow of $279 million. Out of this number came $175.3 million in traditional capex spending and $4.8 million in purchases of capitalized internal use software. That left free cash flow of $98.9 million (-39.3%). “Out of that number,” Darden repurchased $220.8 million worth of common stock and paid out $184.2 million in cash dividends to shareholders.
Turning to the balance sheet, Draden ended the quarter with a cash position of $220.5 million and inventories of $321 million. That puts current assets at $953.1 million. Current liabilities currently stand at $3.199 billion. That Is not a misprint. There are unearned revenues of $571.5 million, which I do not count against a firm’s current situation, but Darden also has debt of $979.7 million maturing within 12 months. Not good.
This puts the firm’s current ratio, even adjusted for unearned revenues, at a paltry 0.36. Kids, that’s just awful. Short-term debt at more than four times the cash position? Balance sheets rarely get sloppier than that. This balance sheet is a good reason to avoid this stock.
Total assets amount to $13.227 billion. of which 12.5% is labeled as goodwill. At least that’s acceptable. The rest is assets the firm needs like buildings and trademarks. Total liabilities less equity comes to $11.158 billion. That includes another $1.636 billion in longer-term debt. This is gross.
Opinion
There really is not a lot to like here. Sales for the quarter disappointed. Guidance disappointed. Cash flows are moving in the wrong direction. The balance sheet? What can I say? This is one of the worst looking balance sheets that I have ever had the misfortune of having to analyze. Ugly.
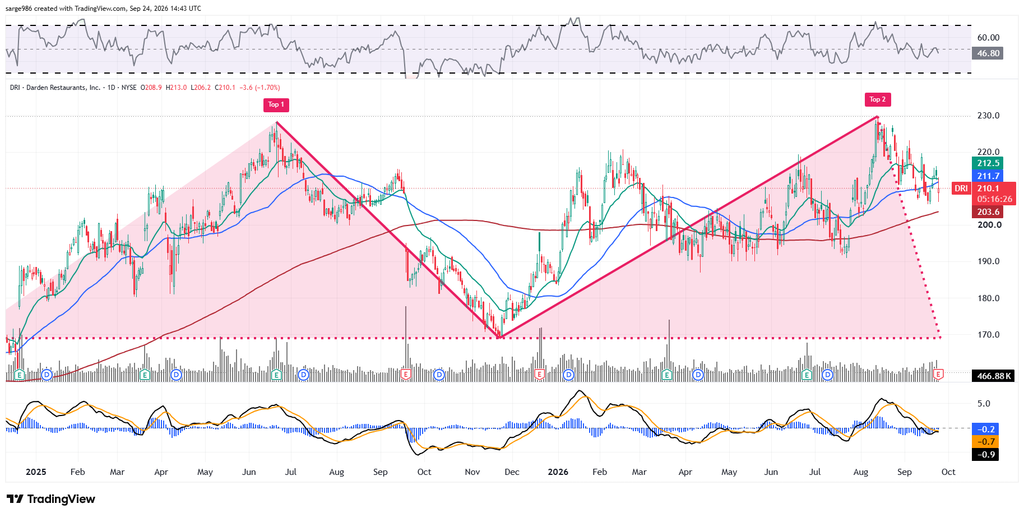
Readers will see that DRI has formed a large double-top pattern of bearish reversal that spans literally all of 2025 and 2026. This pivot for this pattern is all the way down at $170. On Thursday morning, we see DRI losing both its 21-day EMA and 50-day SMA. That will have swing trades exiting the stock and professionals reducing exposure. My thought is this. DRI is an excellent candidate for a short position. If the stock does lose that 200-day line at $204, this stock could fall precipitously.
At the time of publication, Guilfoyle had no positions in any securities mentioned.
