Four Charts You Should Pay Attention To
While I’m away on vacation for the next two weeks, here are four charts you should be watching.
You've reached your free article limit
You've read 0 of 1 free Pro articles.
The Market
Note: I am taking a long vacation. The next edition of Top Stocks will be Sunday, October 11th. I will be shocked if we do not have an oversold rally before I return! But to get a decent one, I still think sentiment needs to change.
The chatter of the day today was bonds. And when they weren’t talking about bonds, they were talking about interest rates!
The DSI for bonds fell to 10. It might get to single digits tomorrow, but I would also point out that the end of the quarter is next week. Often, things change when we enter a new quarter.
Away from that, I have now seen several of the folks who championed broadening out in early August tell us that with rates and oil where they are, it is technology that is the best way to play this market. They did not love tech in early August. I don’t yet think there is too much love for tech, but we’re on our way.
A few days ago, I pointed out that the SOX was not really leading the rally even though it felt as if it was. I still feel that way. The SOX has begun to sort out winners, and not all of the stocks are winners now. And Nasdaq made a higher high, but the SOX hasn’t. Much of this rally is Meta.
The number of stocks making new lows expanded again today. Breadth was terrible. The Transports were terrible and are now down 15%, but no one even talks about them. The Utes are even worse, with one green day in the last two-plus weeks. I don’t even know where I’d go to catch that falling knife except to watch the bonds (obviously).
The Bank Index bounced off support. The banks are probably due a bounce, and in my view, Citigroup (C) remains the one that has hung in there the best. It’s been my pick in the group.
I saw very little change in the options ratios. I do, however, see some change in anecdotal sentiment. For example, a guy who loved the market last week is now cautious. Another one who thought things were fine and dandy on Monday now thinks we could be down until the midterm election. I would love to see these changes of heart show up in some data because that would mean the guy who I saw on television today, who said we were climbing a Wall of Worry, would be correct. He cited no data, but that’s probably because the only thing he can cite would be AAII since it stands alone.
I was asked which charts I think are worth paying the closest attention to, so before I depart for two weeks, I will highlight four of them. Maybe if they all give way, we’ll finally get some real bearishness.
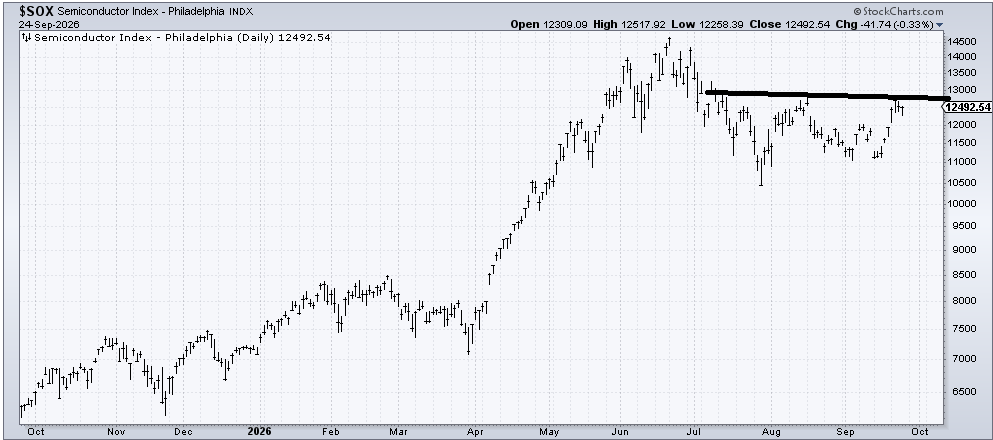
We’ll start with the obvious SOX. If it can’t get up and over that line (call it 13,000) in the next week, I will get concerned.
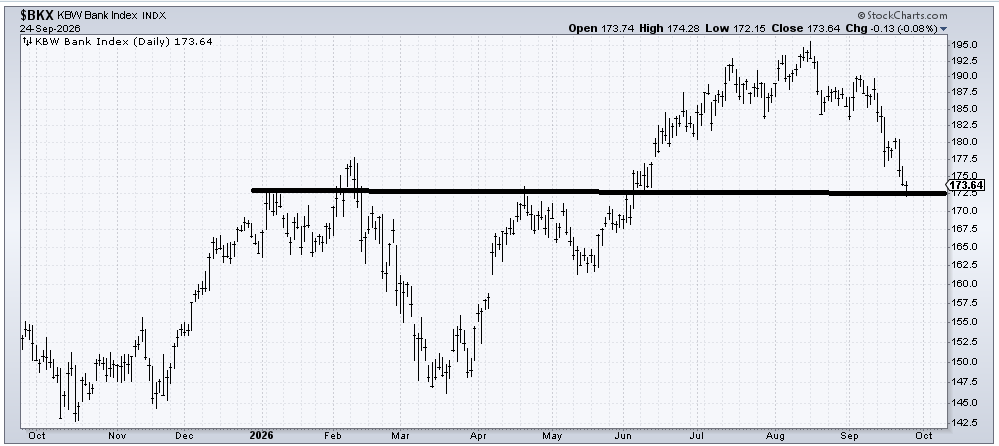
Next is the Bank Index. It has come down to a general area of support and a general measured target. If it can’t hold this area (low 170s) I would consider that a negative.
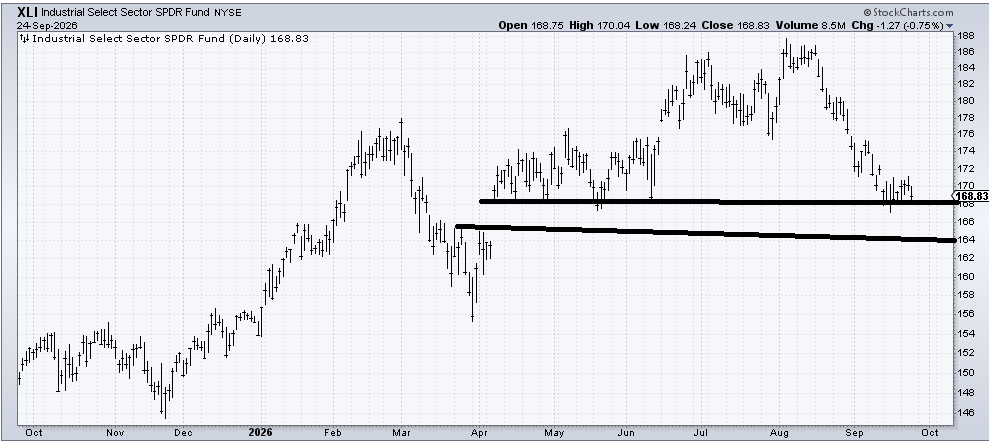
Next is XLI, an ETF to be long the industrials. We looked at this on Sunday, and it has hung in there but has not made any progress. I would allow a quick whack to that 164 area that then recaptures 168 in a hurry, but a drip below that cannot recapture is bearish.
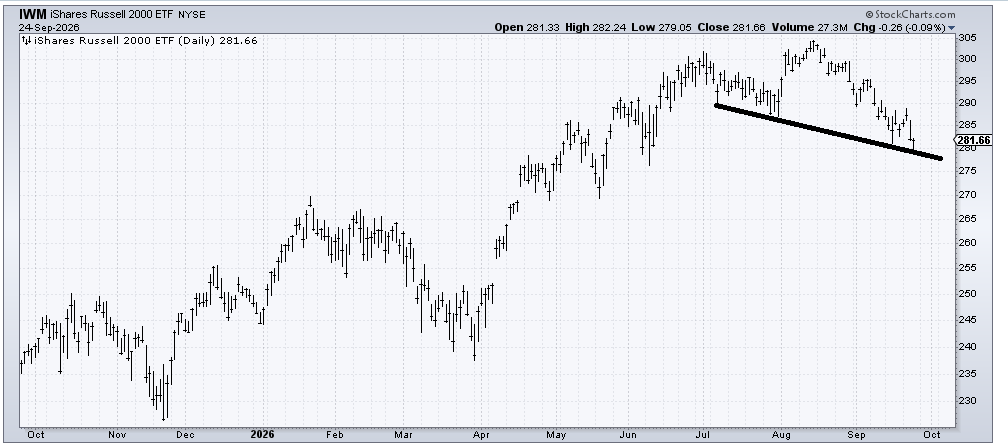
Finally, there is IWM. It has been bouncing off this downslanting line for three months now. If it cannot bounce off this line, even a small bounce, that would be bearish.
New Ideas
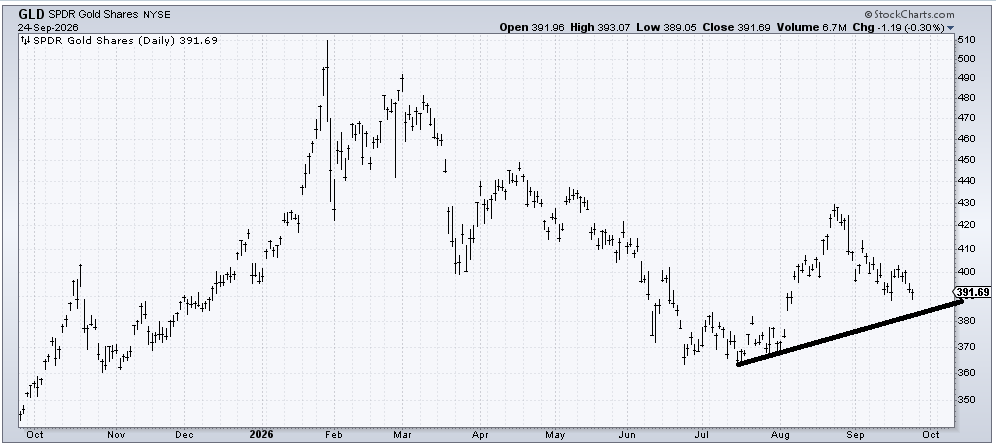
Since I am heading out, I will not post a new chart here but I would note GLD came down to that 390 area today and the DSI is 23. It’s getting close.
Today’s Indicator
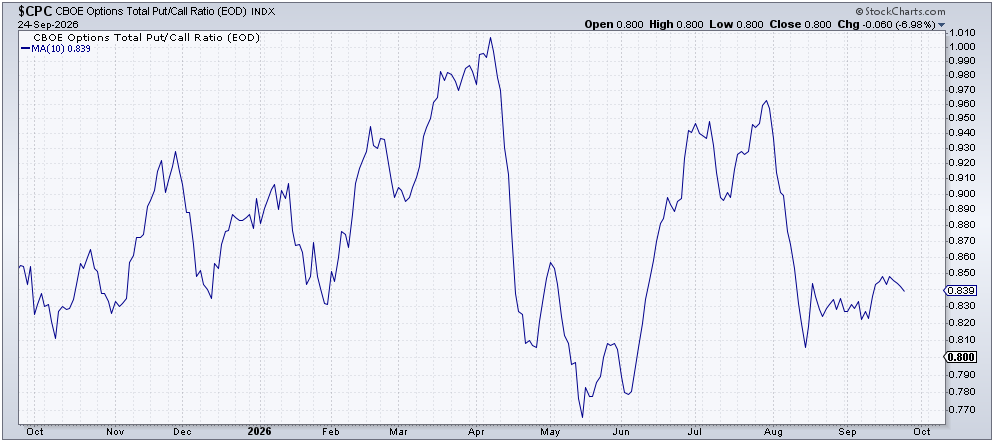
The ten-day moving average of the put/call ratio remains too low for my taste.
Q&A/Reader’s Feedback
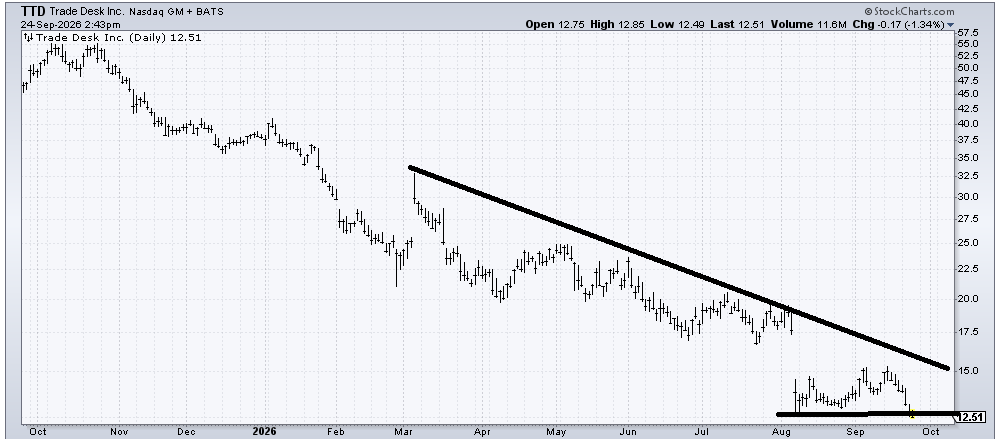
It is very difficult to like the chart of Trade Desk (TTD). Like so many other charts we’ve looked at, it is oversold and really ought to bounce, but at this point, it’s hard to imagine it can do much better than 15, since that is where the downtrend line and the two previous highs come in. Here’s another stock to put on the list for tax loss selling.
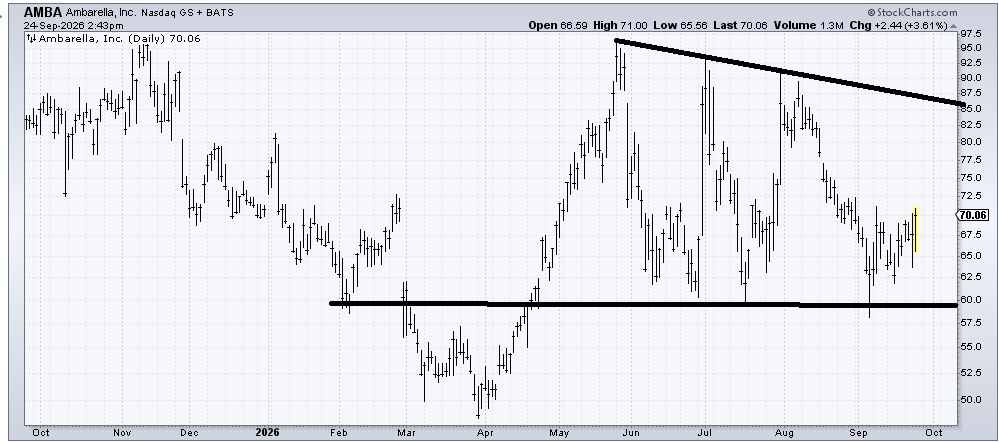
I do like the way Ambarella (AMBA) is trying to hold and trying to round under. Unless the stock opens on a gap down under 60, I would imagine that pullbacks hold for now since it has had ample opportunity to break 60 and hasn’t done so.
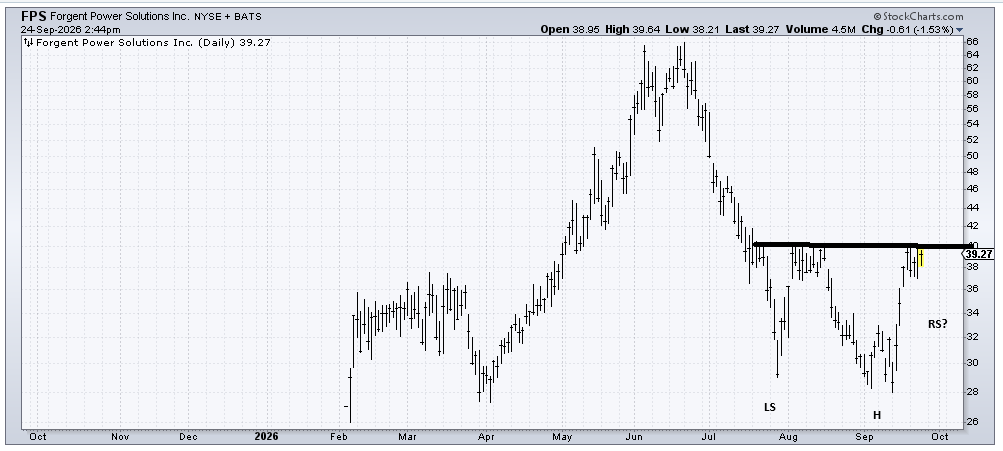
Forgent Power (FPS) is a nice chart. However, I cannot decide if it breaks out over 40 now or if it needs a pullback to form a right shoulder of a head and shoulders bottom. I think I would prefer a pullback, but either way, get this over 40 and it ought to get better.
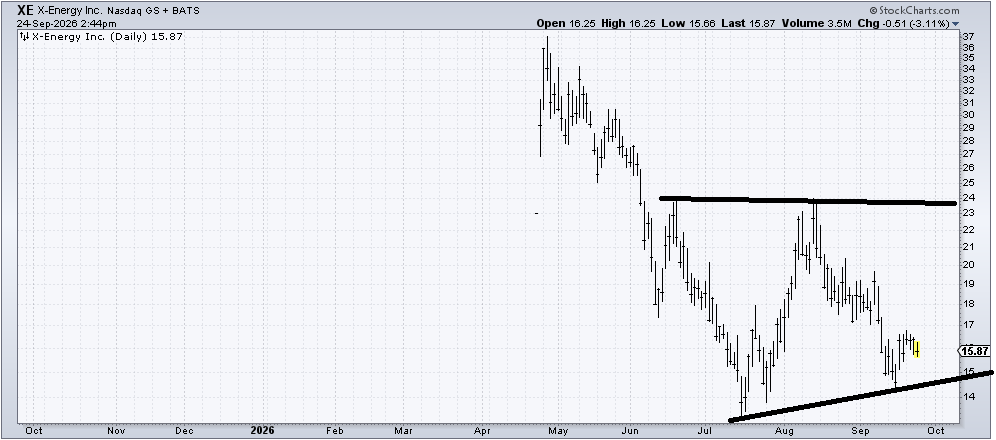
I don’t love last week’s low near 14 on the chart of X-Energy (XE) because it sort of broke a short-term uptrend line, but it did recapture it, so I’ll give it some credit. Retesting that uptrend line (14.50-15) would be a spot for a good risk/reward because if it breaks 14, you’re wrong.
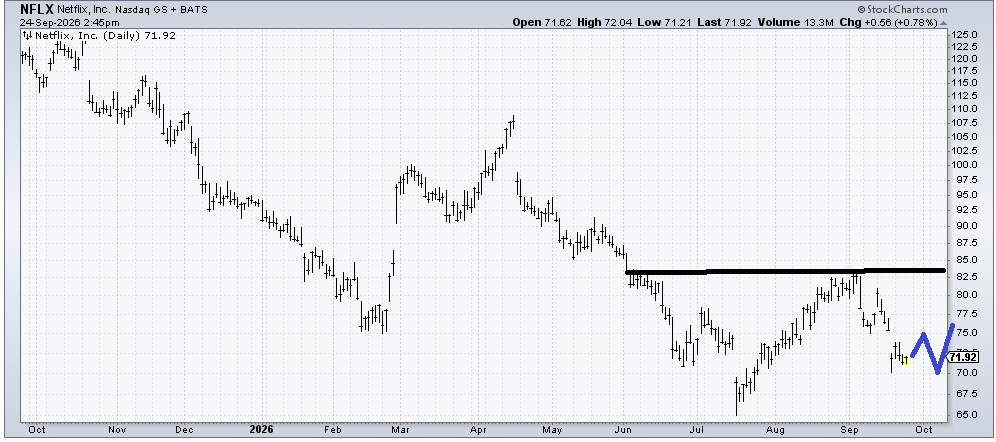
I am starting to warm up to Netflix (NFLX) again. It’s a little early, as the stock needs to show some ability to stabilize and hold down here in the low 70s first, but I’ll ask that you keep nagging me on it so we can see if it develops. I’m thinking it might play out as I have drawn in blue.