Weekly Roundup: Digesting the Selloff, Preparing for What Comes Next
We used the market malaise to start two new positions and add to several others
You've reached your free article limit
You've read 0 of 1 free Pro articles.
The quick recap for this week is that following its largest one-week pullback in over year, S&P 500 entered correction territory and an oversold condition. The Nasdaq Composite joined it in that condition with gains for 2026 wiped clean off the board. The Volatility Index finished the week well above 30 and the Fear & Greed Index dropped like a rock to a reading of 10 (Extreme Fear) from 37 (Fear) a week ago. In such a week, the Pro Portfolio did not escape unscathed.
Our plan coming into the week was to assess the market day by day and, as the week’s key events passed, put small bits of capital to work in well-positioned companies. We did some of that, and we also started two new positions as well.
As we discussed with you in our “After Another Frustrating Reversal, Let’s Recall a Different Buffett Quote” alert Thursday, we’re investors, not traders, and we’re using the current market malaise to lay the groundwork for the coming quarters.
Following Friday’s market developments that pushed the RSI levels for the S&P 500 and the Nasdaq Composite into oversold conditions and the Volatility Index above 30, heading into the holiday-shortened week, we’ll be paying close attention to the indicators and levels Helene Meisler will be discussing Sunday night. Her thinking has been that we could see an oversold rally emerge next week, and we’ll be looking to see if Friday’s developments have her thinking that is even more likely.
One read on Friday’s heavier trading volumes, especially for Nvidia (NVDA), Alphabet (GOOGL), Arista Networks (ANET), and Applied Materials (AMAT), is that short-term traders are lining up for the potential oversold rally in the coming days.
Meanwhile, next week’s inflation data has the potential to reshape what the market expects from the Fed’s December 9 meeting. If those numbers and commentary come in softer than expected and the market reaches the oversold condition Meisler has been discussing, that would be a nice Thanksgiving recipe for a market rebound.
Looking past the holiday, a run of early December events should bring greater insight into AI and data-center demand, supply and financing entering 2027. As we discussed on Friday, those include several investor conferences that will showcase presentations from multiple Portfolio companies, including Marvell (MRVL), Nvidia (NVDA), Seagate (STX), Micron (MU), Arista Networks (ANET) and others. Coming two-thirds or more of the way through the current quarter, those presentations should contain some sobering comments about demand and supply constraints heading into 2027, and they’ll let us crosscheck comments across management teams rather than relying on any single company.
As we assess those comments and collect Black Friday to Cyber Monday shopping data, we’ll be mindful that the Fed’s policy decision comes the following week, with the question of another government shutdown right behind it. What we mean in that is following a potential market rebound from oversold conditions and Extreme Fear levels, the market still faces several hurdles ahead. Those will be in two forms, events like the two we just mentioned as well as the 120th U.S. Congress starting on January 3. And with both the S&P 500 and Nasdaq Composite below key simple moving average levels, technical resistance levels will be something to watch.
This suggests the discussion we had about tacking with the Portfolio as if it were a sailboat going against the wind remains relevant. It also means that as we move through those hurdles, we’ll continue to adapt the Portfolio to the evolving landscape and what the confluence of incoming data points to.
We may be down, but that doesn’t mean we’re out, especially as we have a lot of fight left in us.
Enjoy your weekend, Saturday’s signals alert, and we’ll see you back here, bright and early Monday.
Catching Up on the Portfolio This Week
As we touched on above, it was a painful week for the market and that reverberated through the Portfolio, especially its AI and data-center infrastructure plays. However, measured against the drop in the S&P 500 week over week, there were some bright spots and relative outperformers. TJX (TJX) and Costco (COST) gained ground while shares of Axon (AXON), American Express (AXP), Paccar (PCAR), Welltower (WELL), and Waste Management (WM) declined far less than the S&P 500.
While the temptation was high to get lost in the tick and tack of stock prices last week amid the market’s move lower, it was a busy week for the Portfolio. We started two new positions as part of our stated move to expand the Portfolio’s playing field. We also used the market malaise to position the Portfolio for the coming quarters and the markets’ eventual return to focusing on fundamentals.
Tuesday, we initiated a position in Toast (TOST), with a cost basis of $34.55, a Two rating and a $43 target. Following Nvidia’s (NVDA) earnings report, on Wednesday we added more shares near $156 and made similar pickups in the shares of Marvell (MRVL), Eaton (ETN), and SpaceX (SPCX). Thursday we bought shares of Axon and the ROBO Global Robotics & Automation ETF (ROBO) as well as initiated a position in International Flavors & Fragrances (IFF) with a One rating and a $100 target.
Also, this week, Axon revised the funding mix for its $1.2 billion Skydio investment to 90% cash from 60%, which should mean less dilution. TJX posted 5.5% revenue growth and 4% comparable store sales for its October quarter, and with the position above 4.6% of the Portfolio, we may book some gains if the uptrend continues. We also reiterated our One rating on CIBR shares after data from Marsh and GlobalData pointed to rising attack frequency and cyber insurance premiums.
We closed out the week with the Portfolio’s cash levels above 8%, but with Costco shares still in an overbought condition and the November 24 record date for its $30 per share special dividend, we may opt to boost the Portfolio’s cash level on November 25. We’ll continue to track other positions that like Costco are more than a 4% position size as a sharp oversold rally could trigger some prudent portfolio management.
Now let’s see what others on Wall Street had to say about the Portfolio’s holdings during the week:
Monday: Citi raised its SpaceX price target to $280 from $240. Stifel initiated Costco with a Buy rating, while Northcoast downgraded the shares to Neutral from Buy. Mizuho raised its Welltower price target to $270 from $260, and Phillip Securities lifted its Palantir (PLTR) target to $248 from $215. TD Cowen lowered its Broadcom (AVGO) target to $425 from $475, Freedom Broker trimmed its Applied Materials (AMAT) target to $490 from $530, and Morgan Stanley cut its TJX target to $166 from $178.
Tuesday: UBS assumed coverage of both Amazon (AMZN) and Meta Platforms (META) with Buy ratings. Mizuho raised its Costco price target but removed the shares as a Top Pick. After Nvidia’s report Tuesday night, Summit Insights downgraded the shares to Hold from Buy.
Wednesday: Following Nvidia’s results, Citi said demand “remains very strong,” BofA called the earnings call “very reassuring,” RBC Capital labeled it a “solid” quarter and Barclays said the company answered the two most important investor questions. Even so, most price target changes were to the downside: Raymond James to $350 from $515, Freedom Broker to $230 from $305, Piper Sandler to $230 from $300, Wells Fargo to $250 from $300, Jefferies to $250 from $300, UBS to $220 from $240, Morgan Stanley to $260 from $267 and Evercore ISI to $184 from $186. Wedbush raised its target to $293 from $275 and JPMorgan to $230 from $215. Elsewhere, Goldman Sachs cut its Broadcom price target to $460 from $540, and Erste Group downgraded Eaton to Hold from Buy.
Thursday: Following TJX’s results, JPMorgan raised its price target to $168 from $166, while Barclays trimmed its target to $186 from $188.
Friday: Argus said the decline in Eaton shares is a buying opportunity, and RBC Capital turned incrementally positive on Microsoft (MSFT) following its Ignite conference. Oppenheimer raised its Amazon price target to $310 from $285, while Stifel cut its Marvell target to $280 from $370.
Key Global Economic Readings
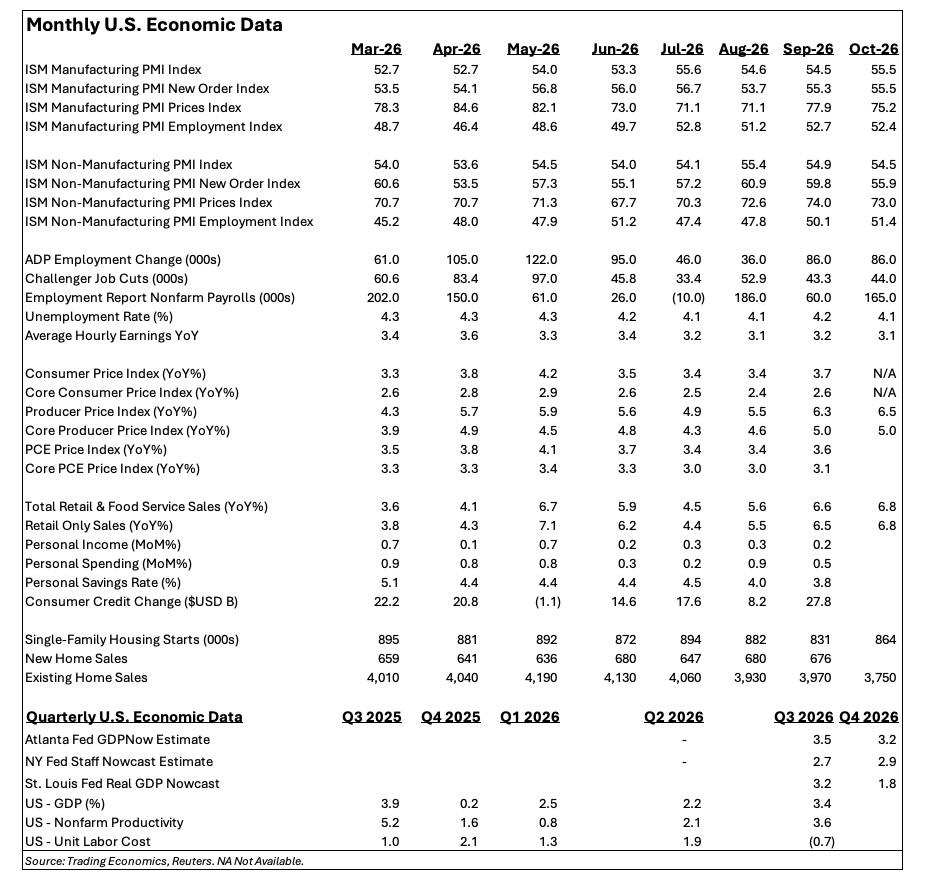
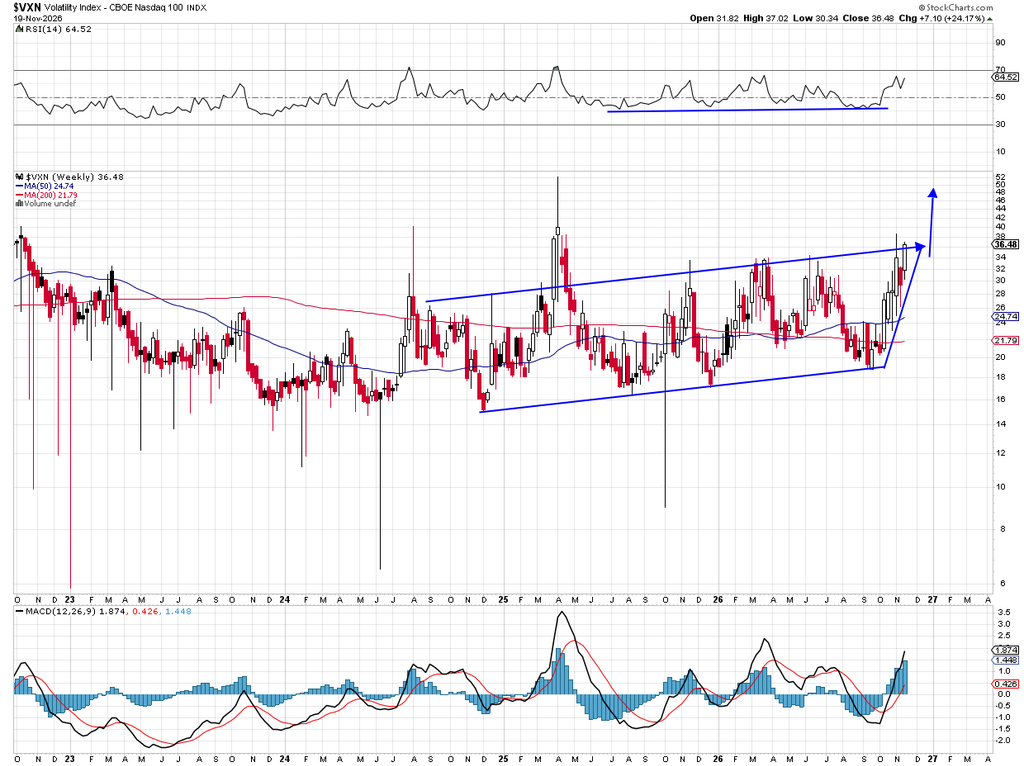
Chart of the Week: Nasdaq 100 Volatility
Fear is finally starting to show in markets. We had been talking about how disjointed things were for quite some time, like poor breadth, heavy sell volume and sectors that were in bear markets, not to mention high inflation, the Iran War and the increase in oil prices. That would be enough to change the trajectory of the markets, but it had not done so until this week, when an avalanche of sellers just cut their positions and moved to the sidelines.
Market volatility is what we track, and the Nasdaq 100 volatility is the VXN. This index is often higher than the more talked-about VIX, finding a “home” in the low 20s most of the time. However, a recent spurt higher into the 30s indicates much bigger moves are likely to come. Yes, that means up and down, but as investors we typically do not like large down moves, which feel far worse than the up moves. You must go back to early 2025 to find the VXN at these current levels.
The chart of the VXN shows a breakout pattern after a rather wide consolidation. The trend in volatility is clearly higher, investors/traders reaching for some short-term protection (buying puts, buying volatility) just in case the market goes off the rails. The Nasdaq 100 is now in correction territory and might get to the technical definition of a bear market soon (down 20%).
One thing to note on this chart is the rising 50-day moving average, which is going to cross the 200 days (black line) in a matter of days. This tells us about the support for the VXN is at 25 and rising, which will keep a bid (buyers) underneath the VXN. That simply means more dispersion, wider ranges and greater fear of a calamity soon. It is rare to see this much upward pressure in the VXN, but here we are.
Final note. Many prefer to be the contrarian, looking at extreme cases like this one and saying, ‘I’ll get in because there is blood in the streets.” I disagree, this is not the time to catch falling knives. Rather, just observe for now and look for the markets to stop going down, base for a bit and then move higher. Being early is often far more expensive than being late.
Other charts we shared with you this week were:
Monday, November 16: S&P 500 – Charting the S&P 500: Hanging by a Thread to Bullish Signals
Monday, November 16: Do We Believe in Alphabet After Post-Earnings Fall?
Tuesday, November 17: We’re in This ETF for the Long Haul
Wednesday, November 18: A Look at Nvidia After Earnings
Thursday, November 19: Looking for a Bounce on a New Portfolio Name
The Week Ahead
Next week is a shortened one with the Thanksgiving holiday that has U.S. markets closed Thursday and an abbreviated session Friday as the Black Friday to Cyber Monday shopping weekend begins. But it would be a mistake to think that just because we have fewer trading days there won’t be much in the way of fresh data that could influence the market.
On Monday, S&P Global’s flash November PMI report will show the degree to which input and output prices have changed compared to August, September and October, given the November fall in oil and gas prices. It will also bring some hints about November job creation and the strength of the economy heading into the final month of 2026.
Those aggregate learnings, which will reflect the move lower in oil and gas prices over the last few weeks, have the potential to reshape what the market expects the Fed to do in just under three weeks. As this alert is being written, the expectation captured by the CME FedWatch Tool is high for a 25-basis point rate hike on December 9 (97.9% probability), and another on January 27 (65.2% probability). Probabilities are shifting for the March and April policy meetings, and our view is data in the coming months will bring a better indication of what the Fed is likely to do.
If the aggregate inflation data and commentary next week is softer than expected, that would relieve some of the pressure slapped on the market this week following the comment from Fed Governor Christopher Waller about a potential 50-basis point rate hike. Remember, though, this was the same Fed speaker that said the central bank didn’t need to raise rates when he was in the running for the Fed Chair job.
If inflation data and commentary is softer than expected and the market enters the oversold condition Meisler has been discussing that would be a nice Thanksgiving recipe for a market rebound.
Here’s a closer look at the economic data coming at us next week:
U.S.
Monday, November 23
Chicago Fed National Activity Index (October) – 8:30 AM ET
S&P Global Flash U.S. Manufacturing & Services PMI (November) – 9:45 AM ET
Dallas Fed Manufacturing Survey (November) – 10:30 AM ET
Tuesday, November 24
ADP Employment Change Report (Weekly) – 8:15 AM ET
FHFA House Price Index (September) – 9:00 AM ET
S&P Cotality Case-Shiller Home Price Index (September) – 9:00 AM ET
Conference Board Consumer Confidence (November) – 10:00 AM ET
Richmond Fed Manufacturing Index (November) – 10:00 AM ET
Wednesday, November 25
MBA Mortgage Applications (Weekly) – 7:00 AM ET
GDP – Second Estimate (Q3 2026) – 8:30 AM ET
Corporate Profits – Preliminary (Q3 2026) – 8:30 AM ET
Personal Income & Spending, PCE Price Index (October) – 8:30 AM ET
Durable Goods Orders (October) – 8:30 AM ET
Initial & Continuing Jobless Claims (Weekly) – 8:30 AM ET
New Home Sales (October) – 10:00 AM ET
EIA Crude Oil Inventories (Weekly) – 10:30 AM ET
EIA Natural Gas Inventories (Weekly) – 12:00 PM ET
Federal Reserve Beige Book – 2:00 PM ET
Thursday, November 26
Thanksgiving Day – U.S. stock and bond markets closed
Friday, November 27
Advance Economic Indicators: Goods Trade Balance, Wholesale & Retail Inventories (October) – 8:30 AM ET
Early close: stocks 1:00 PM ET, bonds 2:00 PM ET
International
Monday, November 23
Japan: Market holiday (Labor Thanksgiving Day)
Eurozone: HCOB Flash Manufacturing & Services PMI (November)
Germany: HCOB Flash Manufacturing & Services PMI (November)
UK: S&P Global Flash Manufacturing & Services PMI (November)
Tuesday, November 24
Germany: Ifo Business Climate (November)
Germany: GDP – Detailed (Q3 2026
Wednesday, November 25
Germany: GfK Consumer Climate (December)
Thursday, November 26
UK: Bank of England Financial Stability Report
Friday, November 27
China: Industrial Profits (October)
Japan: Tokyo CPI (November)
Eurozone: Economic Sentiment Indicator (November)
None of the Portfolio’s holdings report earnings next week, but while we wait for Marvell (MRVL) to do so after the Thanksgiving holiday, there will be plenty of results to cull through. Dell (DELL) and HP (HPQ) will speak to AI server and PC demand and Analog Devices (ADI) to industrial and auto chip demand, while Symbotic (SYM), Ambarella (AMBA) and Autodesk (ADSK) should offer fresh data points for our robotics and automation thesis.
Best Buy (BBY), Dick’s (DKS), Dollar Tree (DLTR) and Abercrombie & Fitch (ANF) will be measured against the 6.4% retail-only sales growth for August through October.
Here’s a closer look at the earnings reports coming at us next week:
Monday, November 23
Close: Agilent Technologies (A), Symbotic (SYM), Zoom Communications (ZM)
Tuesday, November 24
Open: Abercrombie & Fitch (ANF), Analog Devices (ADI), Best Buy (BBY), Dick’s Sporting Goods (DKS), Dollar Tree (DLTR), Medtronic (MDT)
Close: Ambarella (AMBA), Dell Technologies (DELL), HP Inc. (HPQ), Workday (WDAY)
Wednesday, November 25
Open: Deere & Company (DE)
Close: Autodesk (ADSK)
Portfolio Investor Resource Guide
Economic Data: Here’s a List of Links to the Key Economic Data We Closely Watch
Investing Terminology: 16 Key Terms Club Members Should Know
10-Ks: Want to Know About a Stock? Read the Company’s Reports
10-Qs: Unlock the Numbers and Key Information Behind Your Stock With the 10-Q
Income Statement: Our Cheat Sheet to Understanding This Financial Document
Balance Sheet, Cash Flow Statements, and Dividends: How to Know If a Company Is Off-Kilter? Read Its Balance Sheet
Valuation Metrics: Everyone Wants a Value. Here’s How Investors Can Find
Thematic Investing 101 Webinar
Like the Benefits of ETFs? Let’s Talk About Models
The Portfolio Ratings System
1 – Buy Now (BN): Stocks that look compelling to buy right now.
2 – Stockpile (SP): Positions we would add to on pullbacks or a successful test of technical support levels.
3 – Holding Pattern (HP): Stocks we are holding as we wait for a fresh catalyst to make our next move.
4 – Sell (S): Positions we intend to exit.