By Peter Tchir
Trading Thoughts
For the first time in awhile I have no tech hedges on and am contemplating adding either SOXX, or QQQ. I have not pulled the trigger yet, but this message fits what I wrote Monday.
Market updates and conversation from TheStreet Pro team. Follow the latest and join the conversation below.
Newest first · All times Eastern · 6 updates
For the first time in awhile I have no tech hedges on and am contemplating adding either SOXX, or QQQ. I have not pulled the trigger yet, but this message fits what I wrote Monday.
MarketWatch flagged a notable shift Thursday: more stocks are starting to fall together (correlations increasing), meaning investors are cutting equity risk across the board, not just selling AI to buy something else. Here’s what the gauge is showing, and how the S&P 500 has performed after similar jumps.
The Cboe 3-Month Implied Correlation Index (COR3M) measures how much the S&P 500’s largest 50 stocks are expected to move together over the next three months. It jumped 24.5% Thursday to 25.34, its highest close since April 1, when the U.S.-Iran war was driving markets. It has now risen six straight days and is up 115% over that stretch.
That’s the biggest six-day rise since the August 2024 yen carry trade unwind (+148%), and bigger than the 103% during the “Liberation Day” panic in April 2025. In Cboe’s data back to 2006, only “Volmageddon” in February 2018 (+172%) and the yen carry unwind were also notably larger. The Covid crash in February 2020 (+116%) was only slightly bigger.
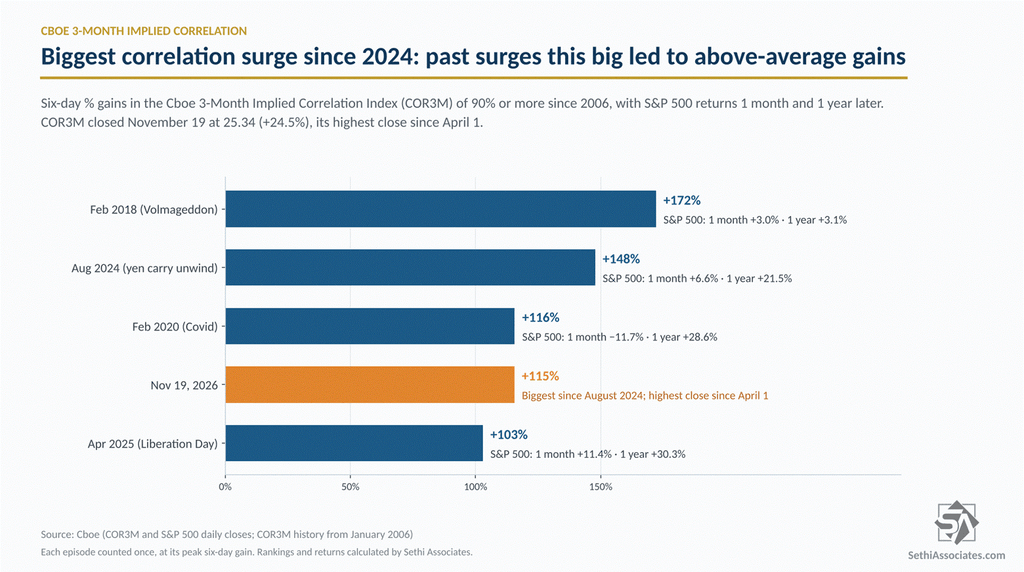
For context, 25 is still low historically. It sits in the bottom fifth of all readings since 2006, and the 2006–2019 average was about 47. But correlation has run much lower since 2023, and against that period Thursday’s reading is in the top fifth.
Thursday’s jump is a change in character. Cboe’s Mandy Xu noted November 9 that the 1-month version of the index (COR1M) rose only to 22% after a 4% one-day S&P 500 drop, when selloffs that size have historically seen implied correlation average closer to 70%, with options still pricing a rotation trade (AI vs. everything else) and little fear of contagion. COR1M closed Thursday though at 30.22, its highest since March 30.
The table below shows how the S&P 500 did 1 week, 1 month, 3 months, 6 months and 1 year after each of the four prior surges of 90% or more. On average, the S&P 500 beat its typical gain over every period, and it was higher a week, six months and a year later all four times. The weak spot was the middle: it was higher a month later three times, and three months later only twice.
Widening to the eight surges of 70% or more since 2006, the S&P 500 beat its typical gain at 1 week, 1 month and 1 year, with a median one-year gain of 17.1% against 13.0% for all days. At 3 and 6 months, the median gains were about normal.
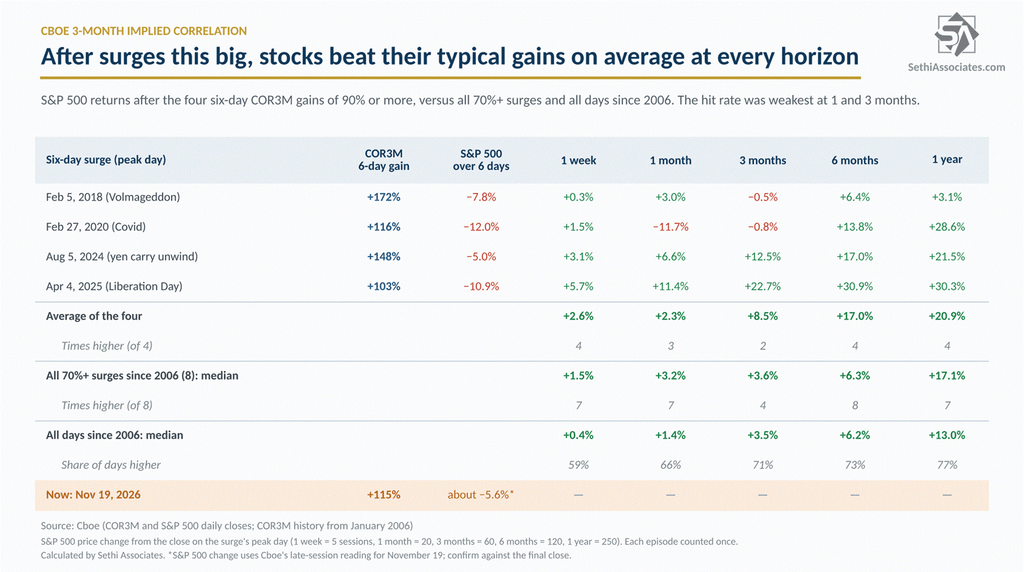
With the caveat of a low sample size, surges like this tend to come in the “sell everything” phase of a pullback, which has usually been nearer the end than the start. That’s been good for stocks over most periods, but the next few months can be choppy.
Sources: Cboe, Cboe Macro Volatility Digest, November 9, 2026, MarketWatch.
Hey all,
Just a reminder that the annoying box on the home page is going to turn into an informative live stream from TipRanks at 10am.
They’ll be talking with strategists from Bloomberg, Direxion, and Nomura about the AI trade following ANT’s IPO.
It’s on the home page and I’m told it should just turn on when you visit the page.
Two of the weekly sentiment surveys went in opposite directions this week (with the caveat that this is through Wednesday night).
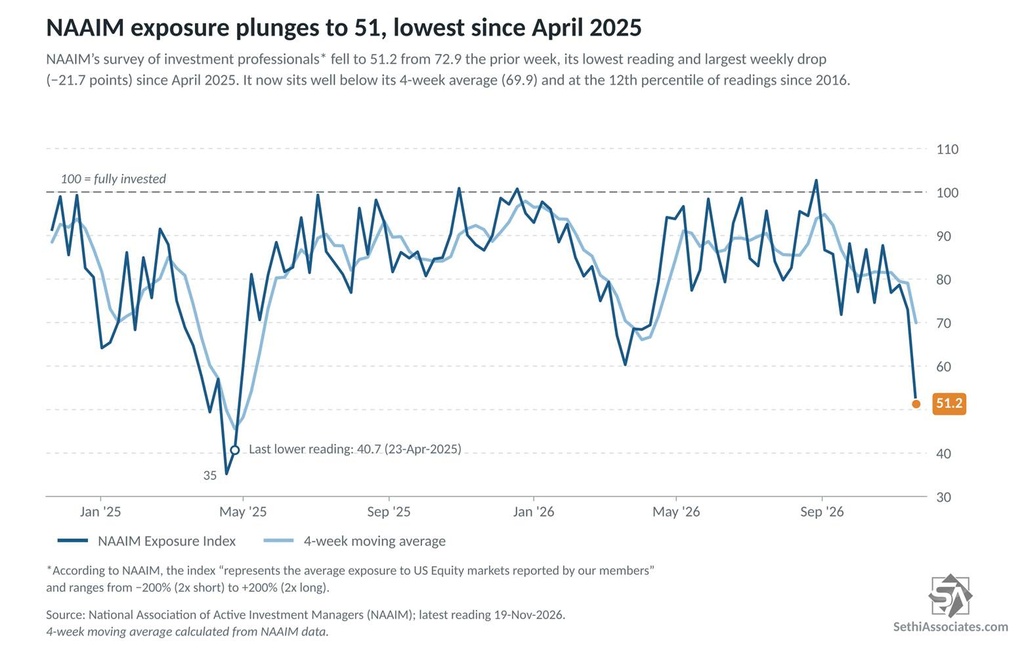
The National Association of Active Investment Managers’ (NAAIM) exposure index measures its members’ average exposure to U.S. stocks, on a scale from −200% (2x short) to +200% (2x long). It fell to 51.2 from 72.9 the prior week. That’s its lowest reading and biggest one-week drop (21.7 points) since April 2025. It’s now well below its four-week average of 69.9 and at the 12th percentile of readings since 2016.
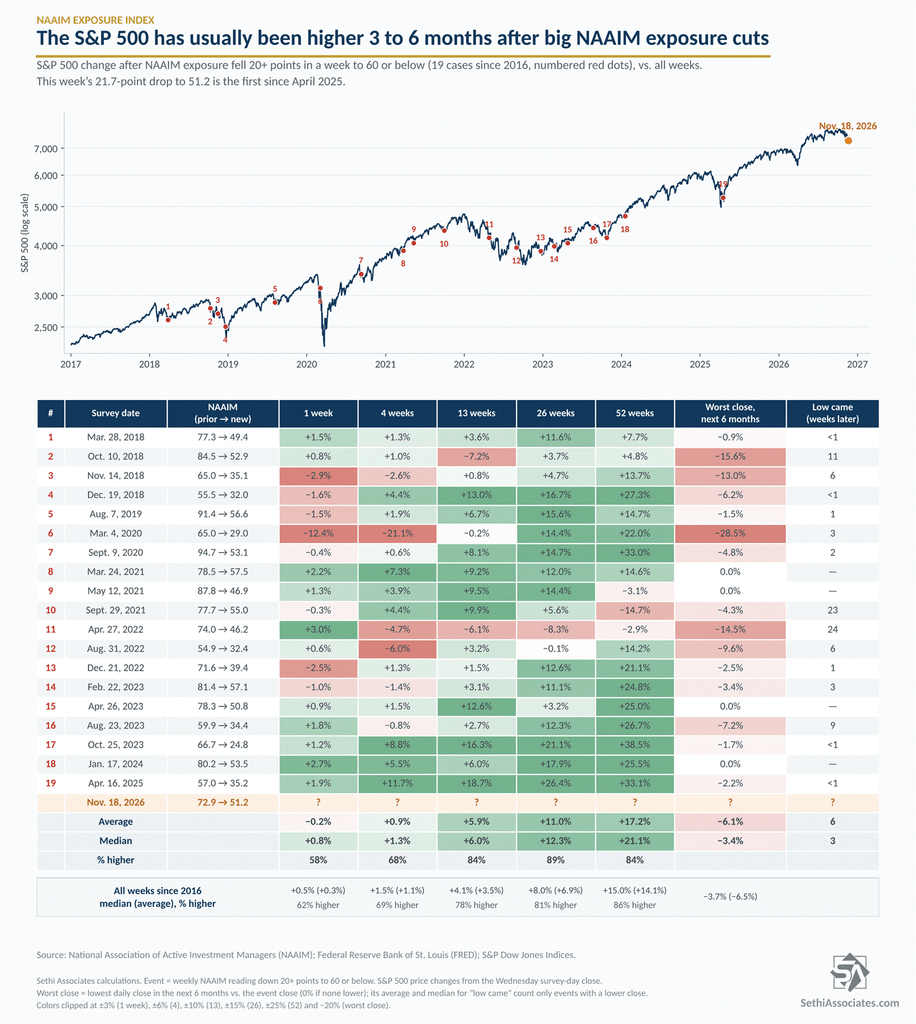
By our calculations, drops like this have been a mediocre short-term buy signal, but returns 13+ weeks out have been favorable. There have been 19 one-week drops of 20+ points to 60 or below since 2016. The S&P 500’s first month afterward was mixed. One-week median returns were slightly better than for all weeks since 2016, but the hit rate was slightly worse, and four-week returns were slightly worse than average
But the S&P 500 was higher 13 weeks later 84% of the time and 26 weeks later 89% of the time, with median gains of 6.0% and 12.3%, compared with 4.1% and 8.0% for all weeks. The exceptions were painful, though: March 2020, October 2018 and April 2022 all saw further drops of 14% or more within six months.
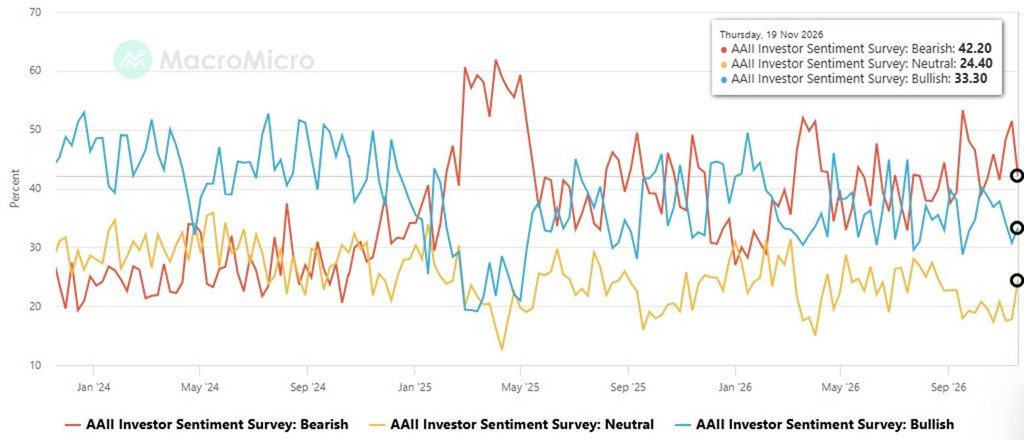
Retail investors went the other way. Bearishness in the American Association of Individual Investors’ (AAII) weekly sentiment survey eased to 42.2% this week from 51.4% last week, when it topped 50% for the first time in eight weeks. Bullishness edged up to 33.3% from 30.8%, and neutral sentiment jumped to 24.4% from 17.8%.
That narrowed the bull-bear spread to −8.9 from −20.6 and lifted the bull/bear ratio to 0.79 from 0.60. The ratio remains below its 1.18 long-run average, with bears still well above their 31.5% historical average and bulls below their 37.5%.
Source: MacroMicro
What stands out is the timing. Retail investors got less bearish over a stretch in which the S&P 500 fell 3.5% (Thursday to Wednesday, the survey period) and closed below its November 5 low.
Last week’s spread below −20 was the kind of reading that, according to Deutsche Bank, has typically been followed by gains: the S&P 500 was higher a month later 68% of the time, with a median gain of 2.8%, since 2010. Some of that contrarian cushion has now been used up.
Taken together, professionals have now cut a lot of exposure, and historically that has set up better for the next three to six months than for the next few weeks. Retail investors, meanwhile, are less fearful than they were a week ago.
I’m putting together a few items from last night’s article Anthropic Pops, but the S&P 500 Drops. The S&P 500 fell 2% Thursday for its sixth straight loss, its first six-day losing streak since April 2024, and the Dow Jones Industrial Average fell more than 1% for a fourth straight day for the first time since December 2018. History says both streaks have usually been followed by a bounce, though not always from the low.
Since 2000, the S&P 500 had 18 six-day losing streaks before Thursday’s. The index was higher the next day in 13 of them, with a median gain of 1.4%. It was also higher a month later in 13, by a median 3.6%, and six months later it was up in 14 of the 18, by a median 10.3%. By comparison, the median gain for all days since 1950 is 1.1% over a month (higher 62% of the time) and 5.2% over six months (71%).
The edge is smaller over the longer history. Across all 116 six-day streaks since 1950, the S&P 500 was higher a month later 61% of the time, about the same as on any day. It did a bit better over three and six months, with median gains of 3.6% and 6.4% vs. 2.7% and 5.2% for all days.
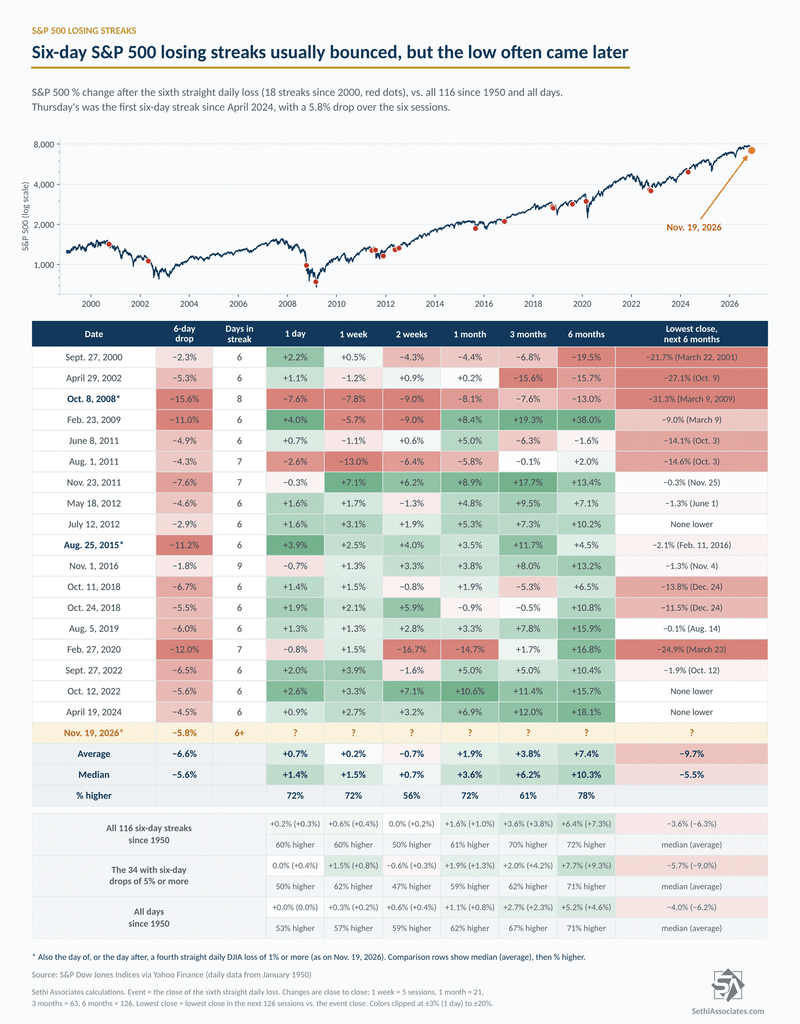
A bounce also hasn’t necessarily meant the low was in. Of those 18 instances that sixth day’s close was the lowest close of the following month only four times (July 2012, August 2015, October 2022 and April 2024). The median lowest close over the next six months was 5.5% below it, and half of the 18 saw another drop of 5% or more within three months, vs. 36% of all days since 2000. The last three streaks, though, all came at or within about two weeks of a major low (September and October 2022 and April 2024).
The DJIA’s streak is rarer. Before Thursday, it had fallen 1% or more four days in a row just five times since 1992, and four of those came within days of a major low (July 2002, March 2009, August 2015 and December 2018). The exception was October 2008, when it fell another 3.3% over the next month and 17% over the next six. Outside of that, the DJIA was higher a month later in all four, by 3.4% to 16.3%, and a week later in three of them.
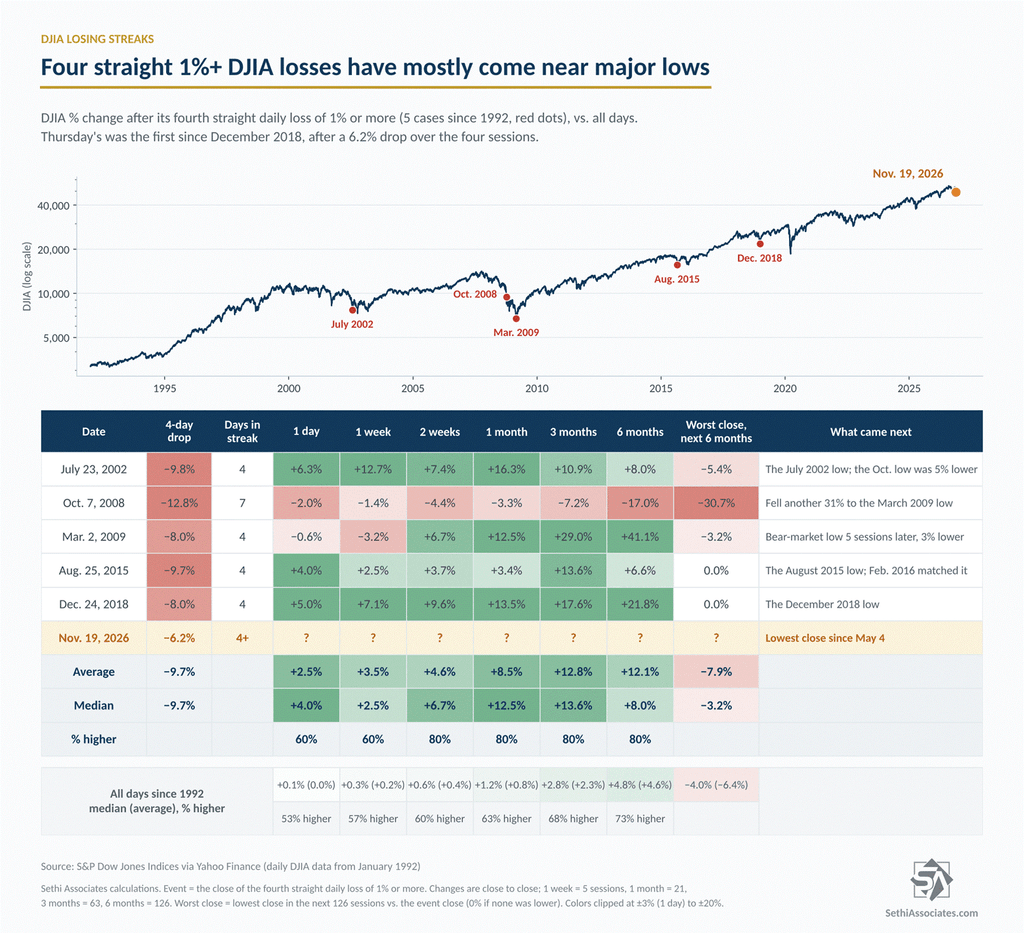
Since 1992, both streaks have hit within a day of each other only twice, and the two went opposite ways. August 25, 2015 was that summer’s low. The S&P 500 was up 3.5% a month later and 11.7% three months later, and it didn’t close below that level until January 2016. October 8, 2008 came in the middle of the financial crisis, and the index fell another 31% to its March 2009 low.
Thursday’s reversal adds one more data point. The S&P 500 swung from a gain of 1% or more to a loss of 2% or more in an outside day (a higher high and a lower low than the prior session), something it had done only twice before since 1962, on April 19, 1999, and June 28, 2022. The index was higher a month later both times, by 3.4% and 6.6%. That’s just two cases, though, and in 2022 the index was 4.6% lower three months later, on its way to that year’s October low.
So history favors a bounce, but not necessarily the low.
At the time of publication, in terms of securities mentioned, Sethi was short VOO.
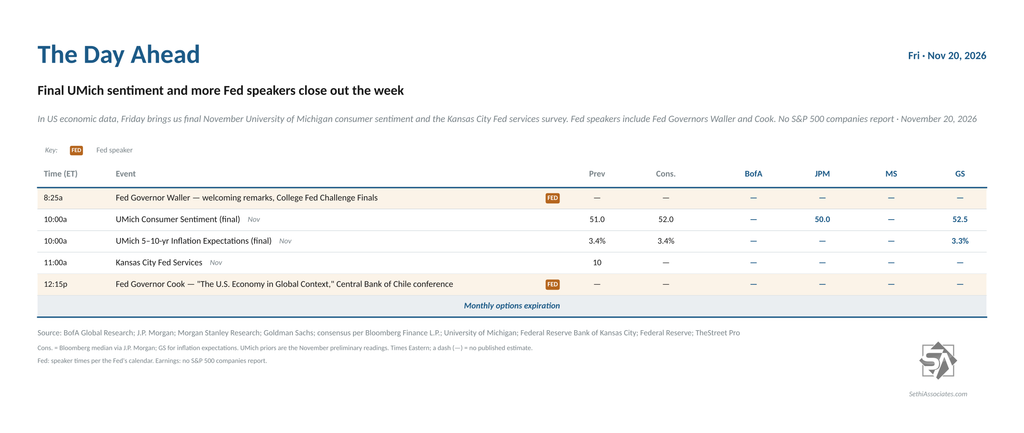
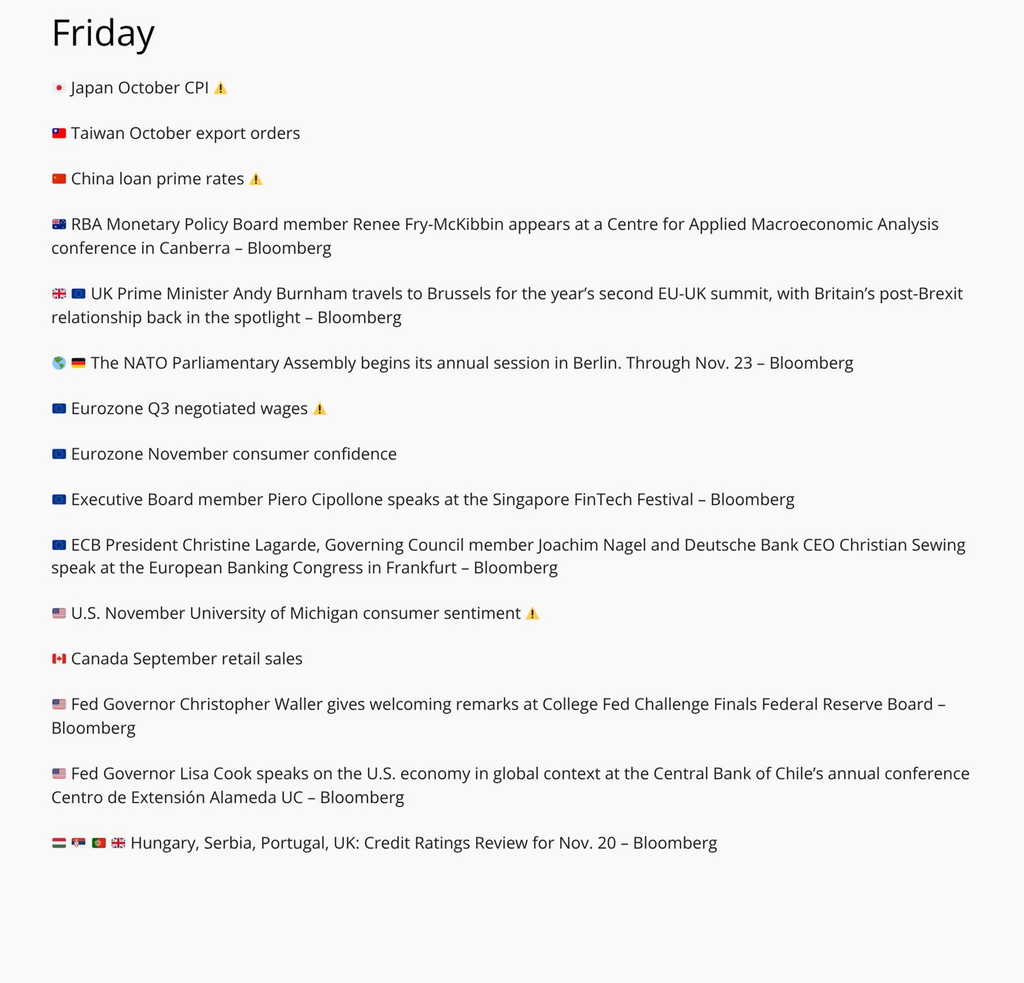
In US economic data, Friday is another light day with just final November University of Michigan consumer sentiment.
Fed speakers include Fed Governors Waller (welcoming remarks at the College Fed Challenge finals) and Cook (on the US economy in a global context, at the Central Bank of Chile’s annual conference).
No S&P 500 components are scheduled to report. Outside the S&P 500 we’ll hear from BJ’s Wholesale Club (BJ) before the open.
Friday is also monthly options expiration.
Ex-US highlights include Japan’s October CPI (6:30pm ET Thursday), China’s loan prime rates, eurozone Q3 negotiated wages and November consumer confidence, the UK’s October retail sales and November GfK consumer confidence, Germany’s October PPI and Canada’s September retail sales. ECB President Lagarde and the Bundesbank’s Nagel speak at the European Banking Congress, and UK Prime Minister Andy Burnham travels to Brussels for the year’s second EU-UK summit.
From Christophe Barraud’s international Week Ahead rundown:
Conversation 0 Comments
One ongoing discussion across all days. Everyone can read; sign in to take part.
Your voice matters. Discussions are moderated for civility. Read our guidelines .
Log in to join the conversation