Chart of the Day: We’re in This ETF for the Long Haul
NLR hasn’t shown bullish qualities recently but appears to be bottoming.
You've reached your free article limit
You've read 0 of 1 free Pro articles.
Nuclear continues to be considered the cleanest and least expensive of all the energy alternatives, though for some reason it has not taken flight. Regulations amid a growing worry of nuclear waste and production are dragging progress on this potential frontier of clean energy. Unfortunately, we live in a country that is slow with controversial policies, but we think eventually it plays out in more power plants around the U.S.
No doubt the chart of the VanEck Uranium and Nuclear Energy ETF (NLR) is bearish. A series of lower highs, lower lows is the textbook definition of a downtrend. We only recently purchased the ETF near the current price. Candles, as seen at the top of the chart, are purple, so that is certainly bearish.
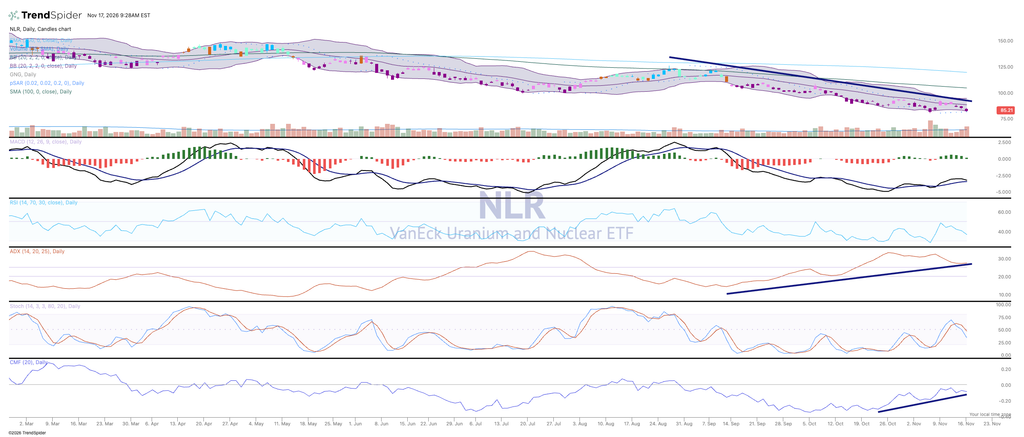
The Moving Average Convergence Divergence (MACD), seen in the second pane, is starting to roll over for a weak sell signal, money flow remains negative while the trend is strong (and bearish).
We look at this as more of a long-term investment. The ETF is more than 50% off its highs, so even halfway back toward the $125 level would be considered a success.
We like NLR in the Pro Portfolio and rate it a Two, or “stockpile on pullbacks.”
More Pro Portfolio:
- We’re Adding to Our Robotics Holding
- Tracking Over 45 Portfolio Signals That Speak to Our Investment Strategies
- Weekly Roundup: Jensen Huang’s Exit Rattles AI as We Trade Boeing for SpaceX
At the time of publication, Pro Portfolio was long NLR.