New Disney Price Target as Bob Iger’s Replacement Tightens Up
The House of the Mouse has reported its latest results.
You've reached your free article limit
You've read 0 of 1 free Pro articles.

On Tuesday morning, Sarge-folio holding Walt Disney (DIS) released the firm’s fiscal fourth quarter financial results. For the period ended October 3, Disney posted an adjusted EPS of $1.77 (GAAP EPS: $1.51) on revenue of $25.97 billion.
While these results exceeded expectations across the board, that top-line print was good enough for year-over-year growth of 15.5%. This was the most impressive quarter for this company in terms of annual sales growth since FQ3 2022, when the firm was still recovering from the pandemic.
Interestingly, the firm announced the targeting of $3 billion in cost savings by fiscal 2029. These efforts at achieving a higher level of fiscal discipline have included multiple of layoffs announced over the past few months. The most recent round seeking to reduce costs by up to 20% made headlines this month. Future cost cutting measures will include reductions in administrative and other operating expenses, however CFO Hugh Johnston, on CNBC on Tuesday morning, said, “We do expect more layoffs.”
In a letter co-authored by Johnston and CEO Josh D’Amaro, management stated:
“We closed fiscal 2026 with a strong fourth quarter. Consumers around the world, faced with endless options, chose Disney. We welcomed 4% more global guests at Experiences and increased engagement on our streaming platforms and across the ESPN networks, trends that support strong revenue growth. Disney’s mission is to be the world’s leading entertainment company and to compound growth for shareholders over time. Our strong fiscal 2026 results, delivered amid a challenging macroeconomic environment, show we are succeeding on that mission.”
Operations
As revenue generation grew 15.5% to $25.947 billion, cost and expenses increased 10.1% to $21.874 billion. This left a GAAP operating income of $4.073 billion (+56.5%). After accounting for interest, other income and expenses and taxes, GAAP net income attributable to shareholders landed at $2.612 billion (+98.9%). This works out to $1.51 per fully diluted share, up from the year-ago comparison of $0.73. After adjusting for restructuring charges and acquisition amortization, that EPS print becomes $1.77, up from $1.11.
Segment Performance
Entertainment generated revenue of $11.893 billion (+17%), producing an operating income of $1.327 billion (+92%)
Experiences generated revenue of $10.105 billion (+15%), producing an operating income of $1.878 billion (+20%)
Sports generated revenue of $4.614 billion (+16%), producing an operating income of $911 million (+53%)
Guidance
For the current full fiscal year, Disney continues to expect double digit (in percentage terms) annual growth in adjusted EPS, excluding the 53rd week. It is expected that the 53rd week will add roughly $0.17 to full year adjusted EPS. Operating income is seen growing 8% excluding that final week. Most of the growth for the fiscal year is expected in the first half due to the lapping of cruise ship launches, the timing of theatrical releases and the opening of the World of Frozen (whatever the heck that is).
The firm also expects to generate roughly $11 billion in free cash flow and is targeting about $9 billion in share repurchases for the corporate treasury. Operating income for FQ1 is projected at approximately $5.4 billion. This is solid guidance.
Fundamentals
For the quarter reported, Disney generated operating cash flow of $6.755 billion. Out of that number came capex spending of $1.918 billion, leaving free cash flow of $4.837 billion (+89.1%). For the full fiscal year, Disney generated operating cash flow of $19.27 billion and free cash flow of $10.572 billion (+4.9%). Out of this number, the firm repurchased $9 billion worth of common stock and paid out $2.634 billion in cash dividends to shareholders.
Turning to the balance sheet, Disney ended the quarter with a cash position of $6.679 billion and inventories of $2.19 billion. That left current assets at $25.859 billion. Current liabilities add up to $34.907 billion, including short-term debt of $7.331 billion, but also deferred revenue (not a true financial obligation) of $7.229 billion. Disney’s headline current and quick ratios stand at 0.74 and 0.68, respectively. Once adjusted for those deferred revenues, these ratios rise to 0.93 and 0.86, in that order. Better, but still not up to snuff. Disney’s balance sheet is not a strength.
Total assets amount to $206.138 billion, of which almost 41% is labeled as either goodwill or other intangibles. I normally rail against something like that but given the theoretical value of Disney’s obvious intangible properties, I think they get a pass. Total liabilities less equity comes to $87.433 billion. There is long-term debt on the books of $37.142 billion. This balance sheet is not what you would like to see for a large company like this. That said, this firm has operated with a sloppy-ish looking balance sheet for years as has PepsiCo (PEP), which is where they found CFO Hugh Johnston.
Opinion
There’s a lot to like here. There are some things that I do not like. That said, there’s a lot more to like than there used to be. D’Amaro appears to be running a much tighter ship than Bob Iger ever did. In my opinion, Iger was extremely overrated as a chief executive. The purchase of the Fox assets hurt this firm and its balance sheet very badly. Iger only looked good in comparison to Bob Chapek. D’Amaro has a chance to be special. We shall see.
Growth is impressive. Cash flows are impressive. Fiscal discipline is new to Disney, but what I see is impressive. The guidance is decent to good. The balance sheet is the crack in the armor and fixing that will take time. It may not even be possible with this CFO, given his resume.
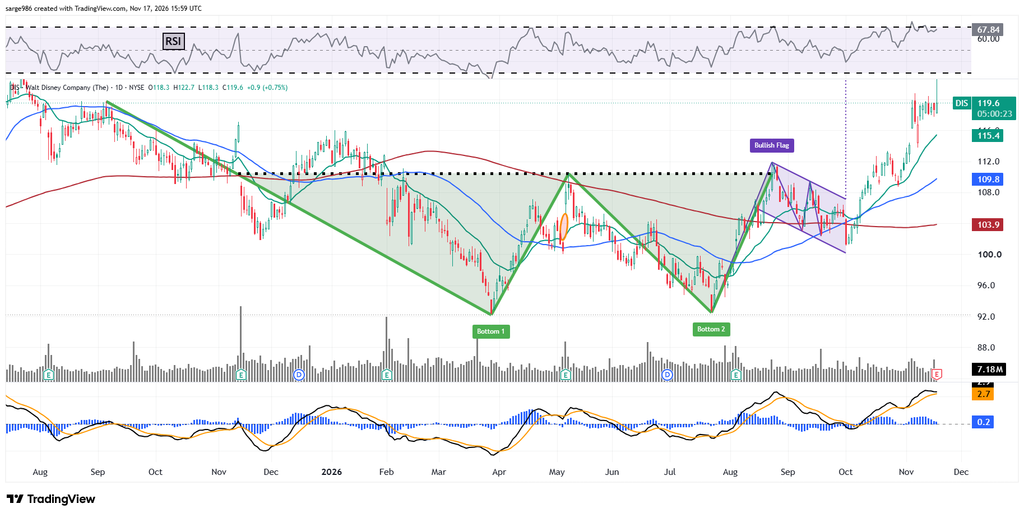
Readers will see the huge double-bottom pattern of bullish reversal that covers the first eight months of 2026. This is where we get our $110 pivot. The shares developed a bullish flag coming out of that pattern, which reinforced direction and is where I got involved.
Moving on to my indicators, relative strength had been rising but has avoided entering into a technically overbought condition. The daily MACD, below the chart, has been sending bullish signals as well. The histogram of the nine-day EMA is in positive territory as are the 12-day EMA and 26-day EMA. The 12-day line continuing to hold a lead over the 26-day line is key to the bulls.
Target Price: $138
Pivot: $110
Add: Down to the 50-day SMA.
Panic: Loss of the 200-day SMA.
At the time of publication, Guilfoyle was long DIS equity.