October Retail Sales Beat Across the Board Despite Falling Auto Sales
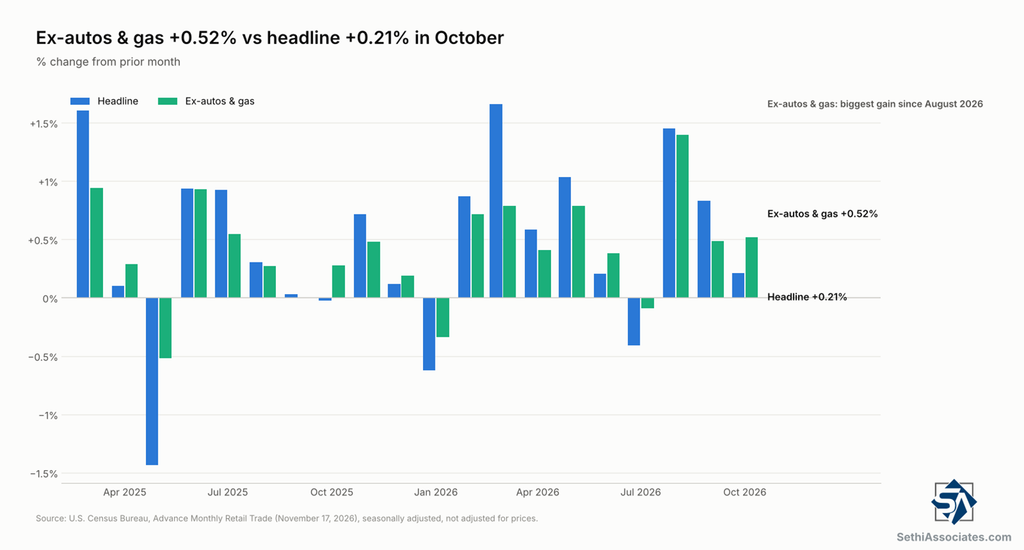
October retail sales rose 0.21% versus a 0.1% estimate despite a 1.60% drop at auto dealers.
You've reached your free article limit
You've read 0 of 1 free Pro articles.

US Retail Sales Advance (M/M): Oct: 0.2% (est 0.1%; prev 0.8%; prev R 0.8%)
– Retail Sales Ex-Auto (M/M): 0.6% (prev 0.9%; prev R 1.1%)
– Retail Sales Ex-Auto and Gas: 0.5% (est 0.3%; prev 0.2%; prev R 0.5%)
– Retail Sales Control Group (M/M): 0.6% (est 0.3%; prev 0.1%; prev R 0.5%)
Note: All changes month-over-month unless otherwise noted. Usual caveats — First, these are not adjusted for prices so that also should be taken into account. Second, this report is more of a goods report with only one main services category (bars and restaurants) so it is not a complete picture of consumer spending, representing only around 35% of the total. Data on inflation-adjusted personal spending and overall services spending will be out later this month, offering a more full picture of consumer outlays in the month. Finally this report is seasonally adjusted which can always cause distortions, particularly for retail sales which are very lumpy throughout the year.
Executive Summary
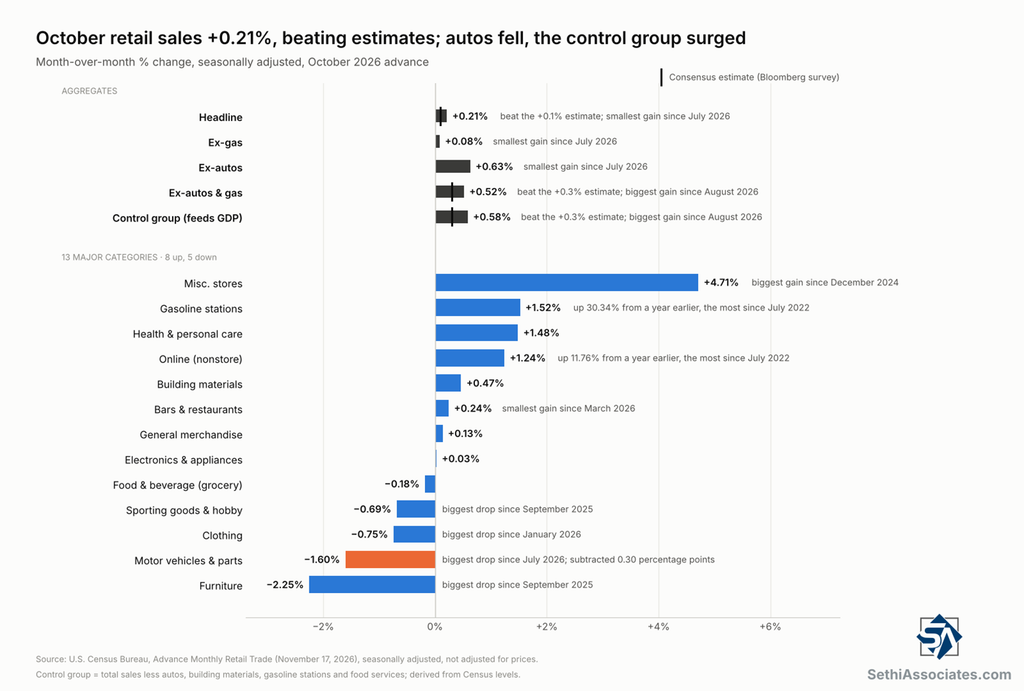
- October retail sales rose 0.21% from September, double the 0.1% estimate, even as auto dealers fell 1.60%, subtracting 0.30 percentage points from the total.
- Sales excluding autos and gasoline rose 0.52% versus 0.3% expected, and the control group, which feeds into GDP, rose 0.58%, the most since August, versus the 0.3% estimate.
- September was revised higher across the board, with the control group now up 0.53% (from 0.14%), leaving October running 5.94% annualized above the third-quarter average.
- From a year earlier, headline sales rose 6.82% and the control group 5.62%, both the most since October 2022, and adjusted for the prices of what retailers sell, the control group rose 0.33% to a record high.
A Beat, Even With Autos’ Sharp Drop
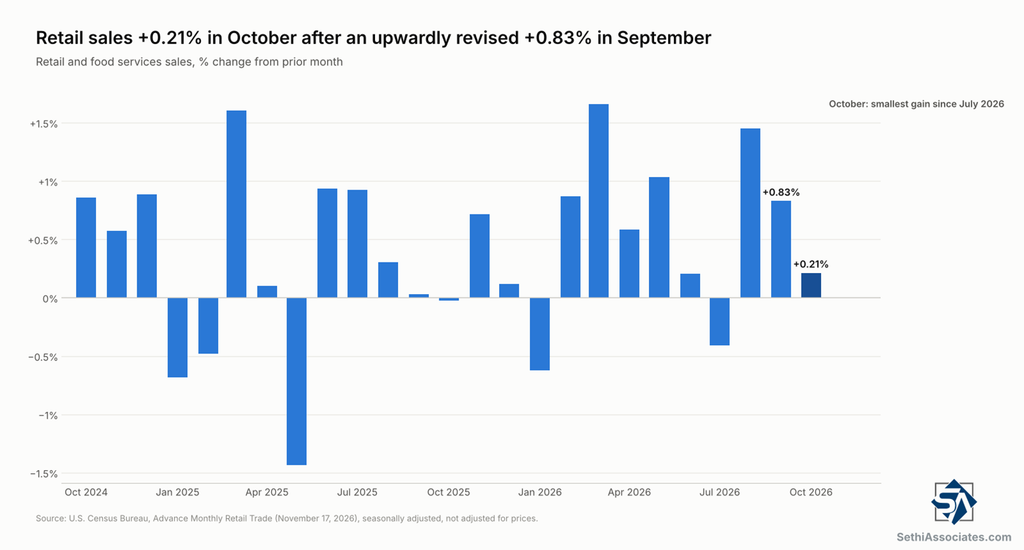
October retail sales rose 0.21% from September to $748.2 billion, a record in dollar terms and double the 0.1% median estimate in a Bloomberg survey of economists. The Census Bureau’s own read is more cautious, with sales “up 0.2 percent (±0.4 percent)*” carrying an asterisk because the confidence interval includes zero, meaning the gain isn’t statistically significant. September’s gasoline-driven gain was revised up to +0.83% (from +0.77%) (Gasoline Fuels Most of the Retail Sales Beat in September).
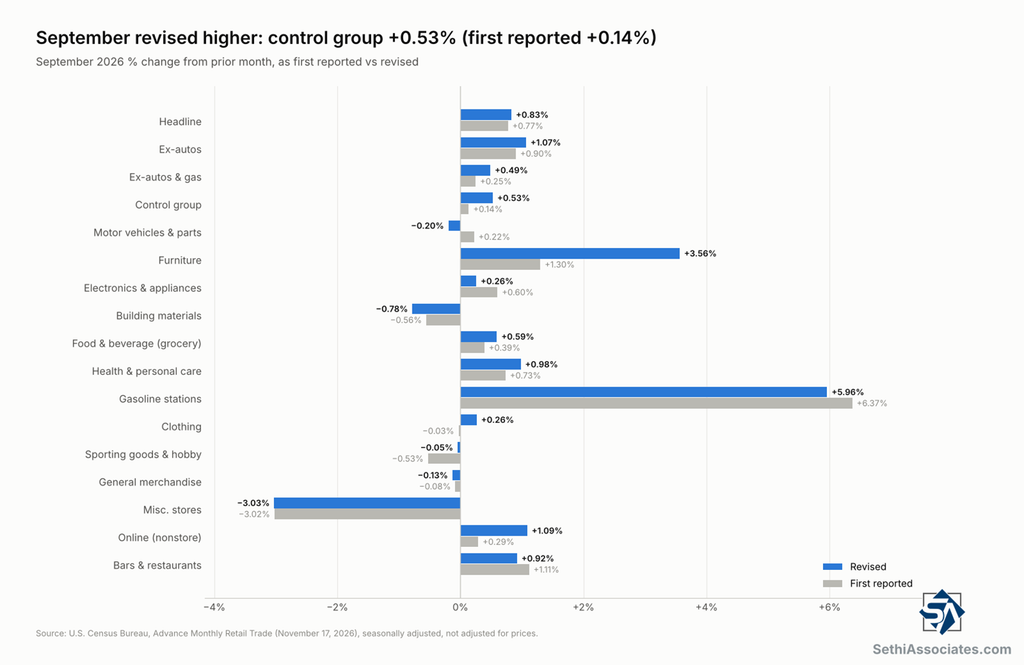
The bigger change was under the hood in September, where the control group (discussed in more detail below) was revised to +0.53% from +0.14%. Sales excluding autos were revised to +1.07% from +0.90%, and excluding autos and gas to +0.49% from +0.25%, with online retailers (+1.09% from +0.29%) and furniture (+3.56% from +1.30%) seeing the biggest upward revisions.
Autos and Gasoline
Motor vehicle and parts dealers fell 1.60%, the biggest drop since July, subtracting 0.30 percentage points from the headline. That follows a 0.20% decline in September (revised from a 0.22% gain), leaving them up just 1.31% year-over-year, the least since April. Unit sales point the same way, with light vehicle sales slipping to a 16.0 million annual rate in October from 16.4 million, the lowest since February (October Auto Sales Slip Even as Incentives Rise).
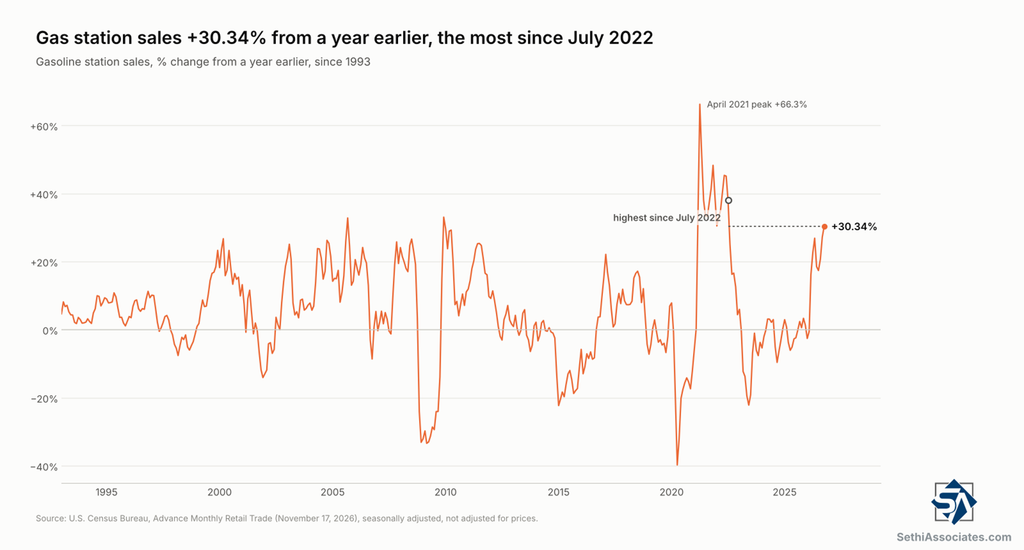
Gasoline stations rose 1.52% after +5.96% in September (revised from +6.37%) and added 0.14 percentage points, so sales excluding gasoline rose just 0.08%. Gasoline sales are up 30.34% from a year earlier, the most since July 2022.
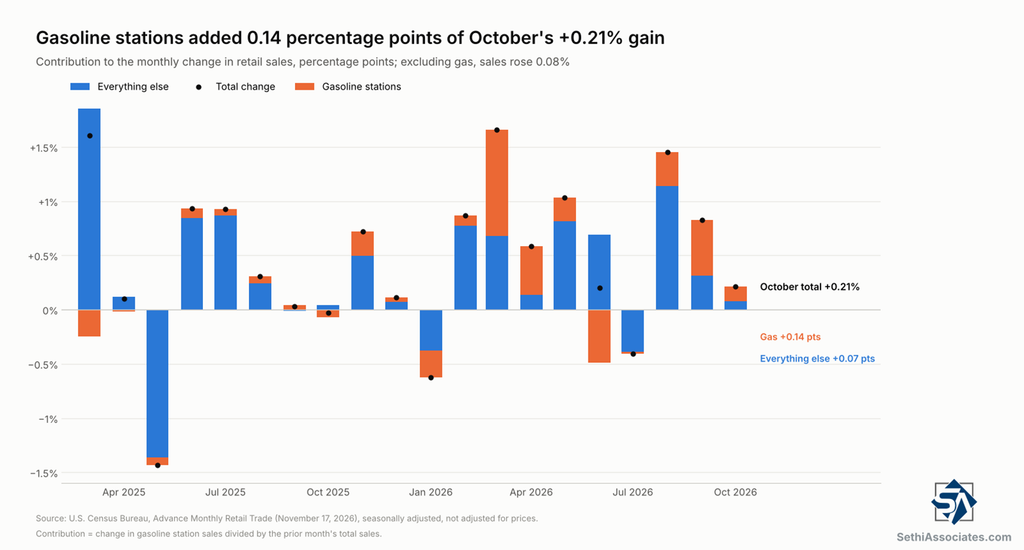
Stripping both out, sales excluding autos and gasoline rose 0.52%, the most since August, versus the 0.3% estimate, after +0.49% in September.
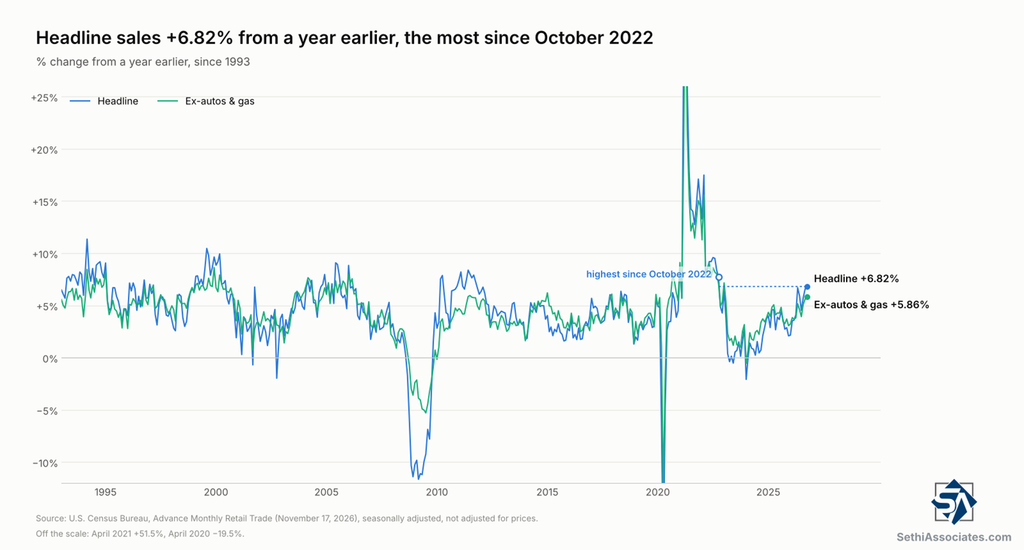
Headline retail sales rose 6.82% year-over-year, the most since October 2022. That’s up from +6.57% in September (revised from +6.29%). Sales excluding autos and gasoline rose 5.86%, the most since January 2023, from +5.61% (revised from +5.02%).
GDP Readthrough
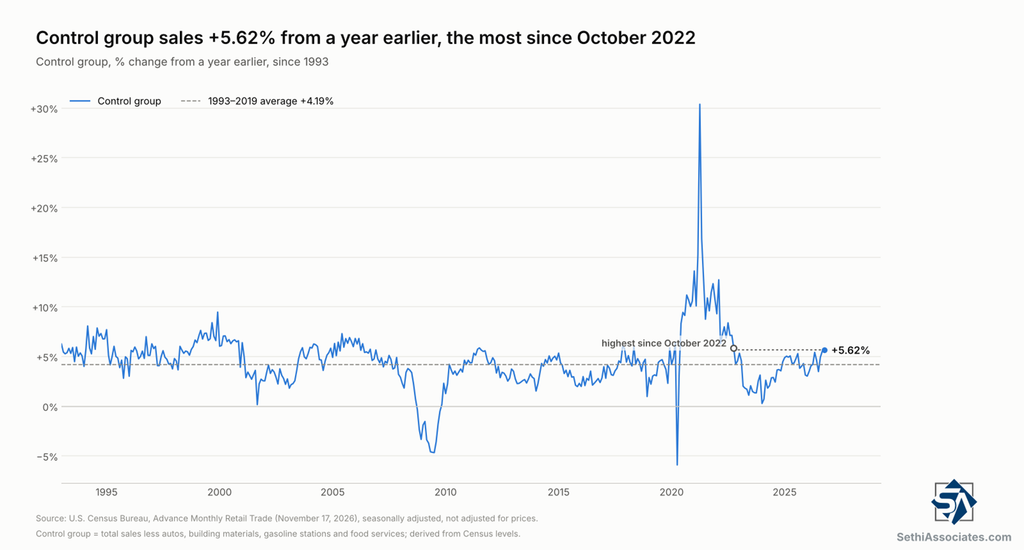
Control group sales (headline sales minus food services, auto dealers, building materials and gasoline stations – seen as a more stable metric of consumer spending and which feed into GDP as the goods consumption component) rose 0.58%, the most since August, versus the 0.3% estimate. The control group follows an upwardly revised 0.53% gain in September (initially +0.14%) and is up 5.62% year-over-year, the most since October 2022, from +5.52% in September. It has now risen in 14 of the past 18 months.
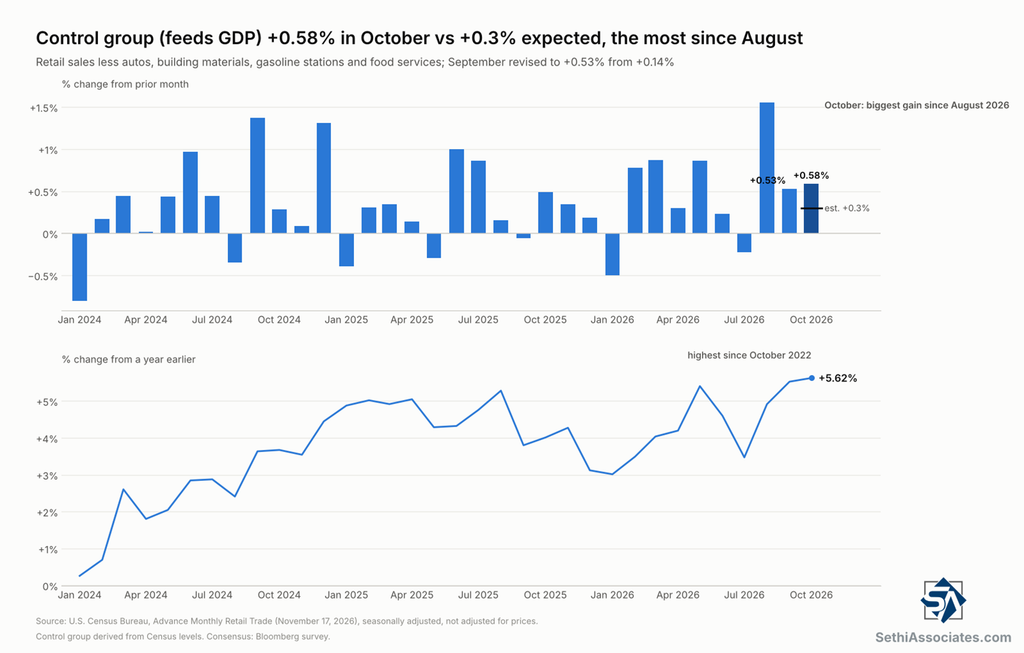
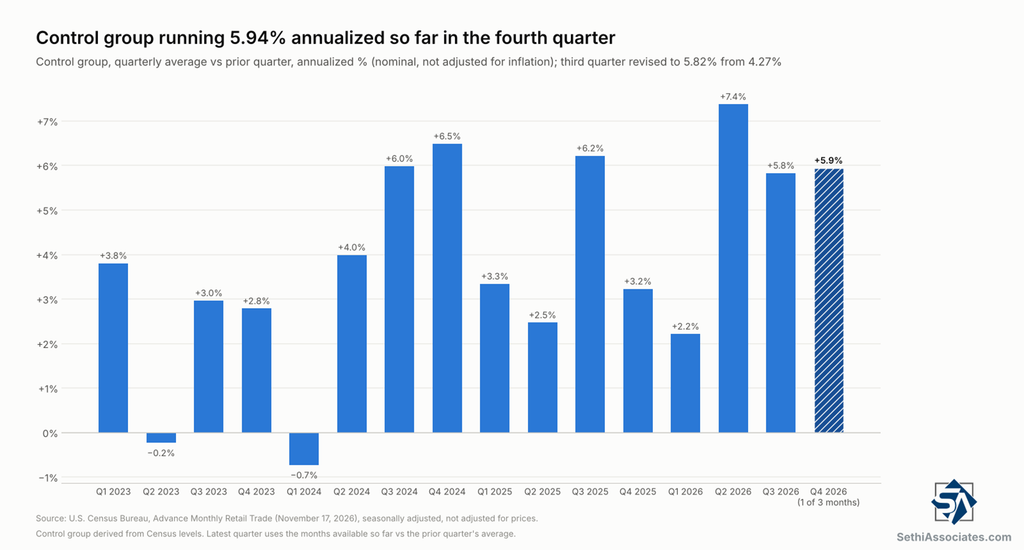
With the September revision, third-quarter control group sales rose at a 5.82% annualized pace (from 4.27% initially), and October alone is running 5.94% annualized above the third-quarter average (nominal, not adjusted for inflation), so a strong start to the fourth quarter. The Atlanta Fed’s GDPNow, at 3.48% as of November 9, updates later today (The Week Ahead – Have We Seen the Q4 Bottom?).
Category Detail
Eight of the 13 main categories rose (although electronics was up just 0.03%), the same count as September. Miscellaneous stores led, up 4.71%, the most since December 2024, reversing September’s 3.03% drop, and are up 13.30% year-over-year. Health and personal care rose 1.48%, a ninth straight gain, and is now up 1.03% year-over-year, its first positive annual reading since December 2025. Online (nonstore) retailers rose 1.24% and are up 11.76% year-over-year, the most since July 2022. Building materials rose 0.47% (up 5.59% year-over-year) and general merchandise 0.13%.
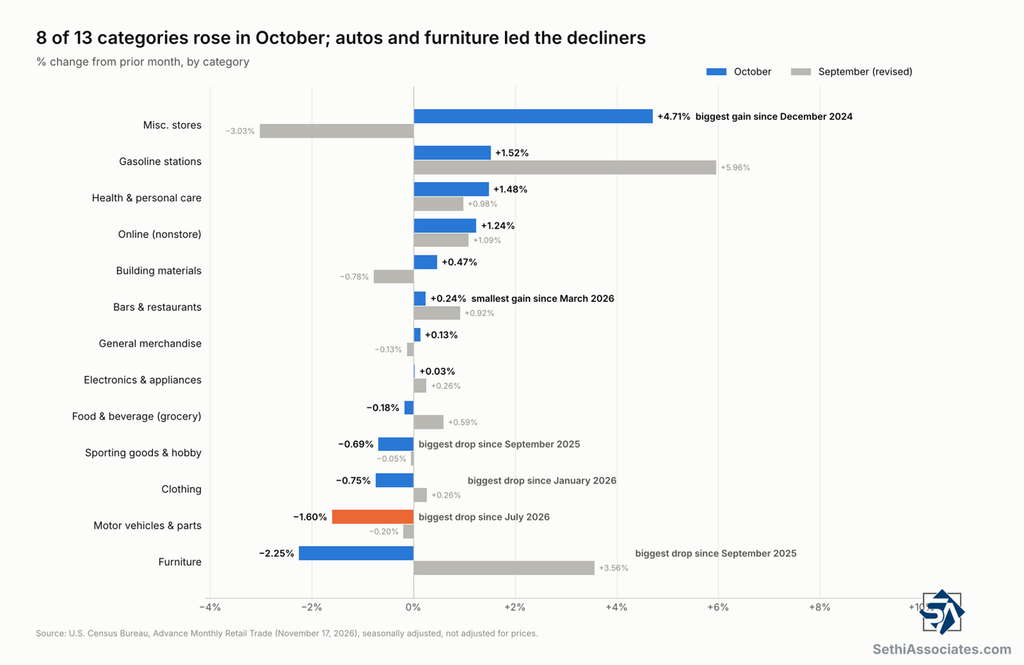
The five decliners were led by furniture, down 2.25%, the biggest drop since September 2025, after a 3.56% jump in September. Autos fell 1.60%, clothing 0.75% (the biggest drop since January), sporting goods and hobby stores 0.69% (the biggest since September 2025) and food and beverage (groceries) 0.18%, leaving groceries up just 0.89% year-over-year, the weakest of any category.
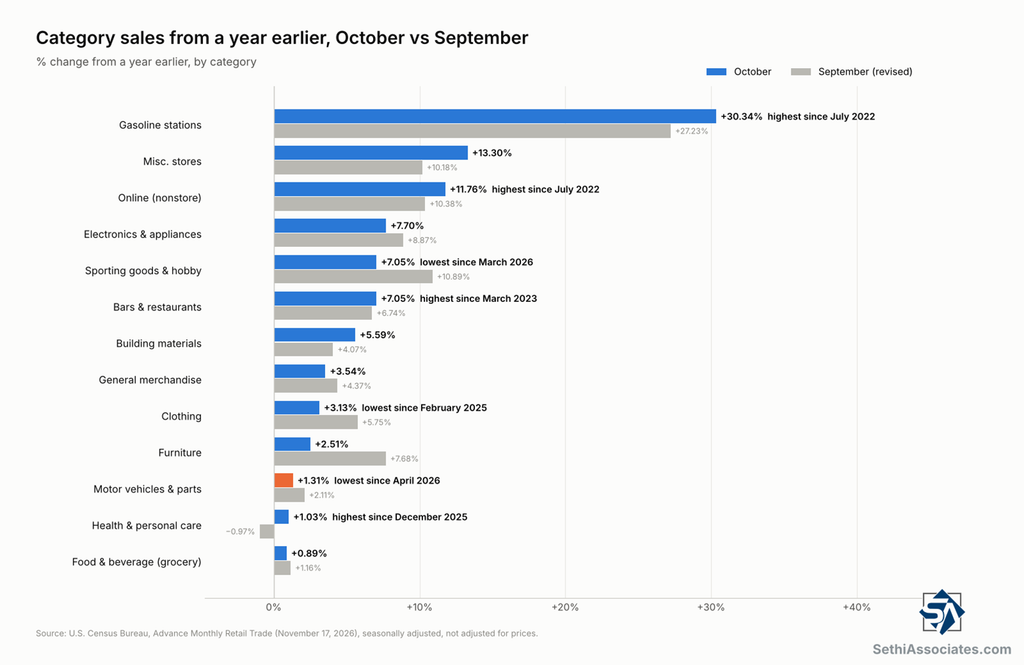
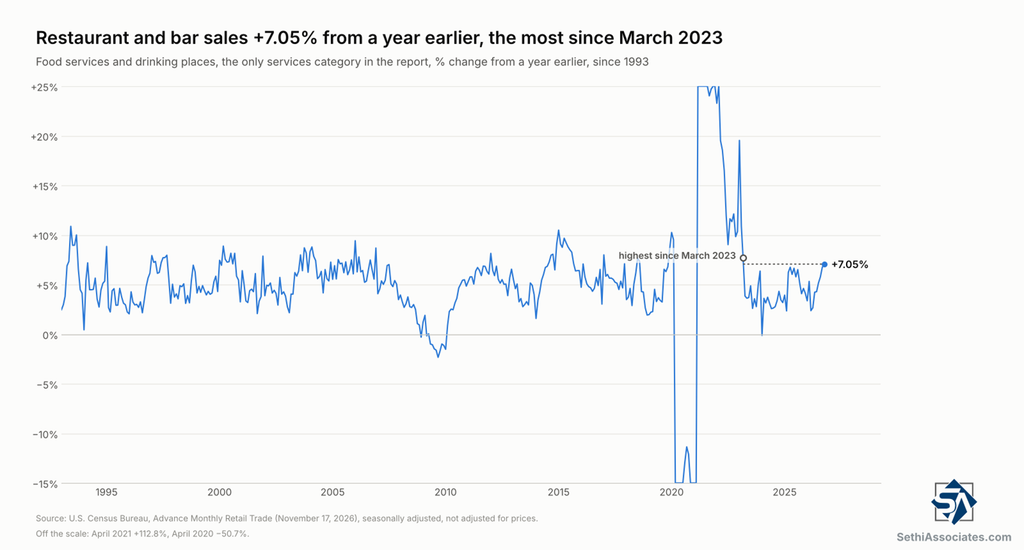
Bars and restaurants, the only services category in the report, rose 0.24%, the smallest gain since March but a ninth straight increase, and are up 7.05% year-over-year, the most since March 2023.
Taking Out Inflation
Census sales aren’t adjusted for prices, so to get closer to volumes I deflate each measure by the consumer price index categories that match what’s being sold: food at home for groceries, medical care goods for health and personal care stores, food away from home for restaurants, gasoline for gas stations, new and used vehicles for autos and core goods for everything else, each weighted by its share of sales. The BLS didn’t publish October 2025 prices, so the year-over-year figures for October are estimates.
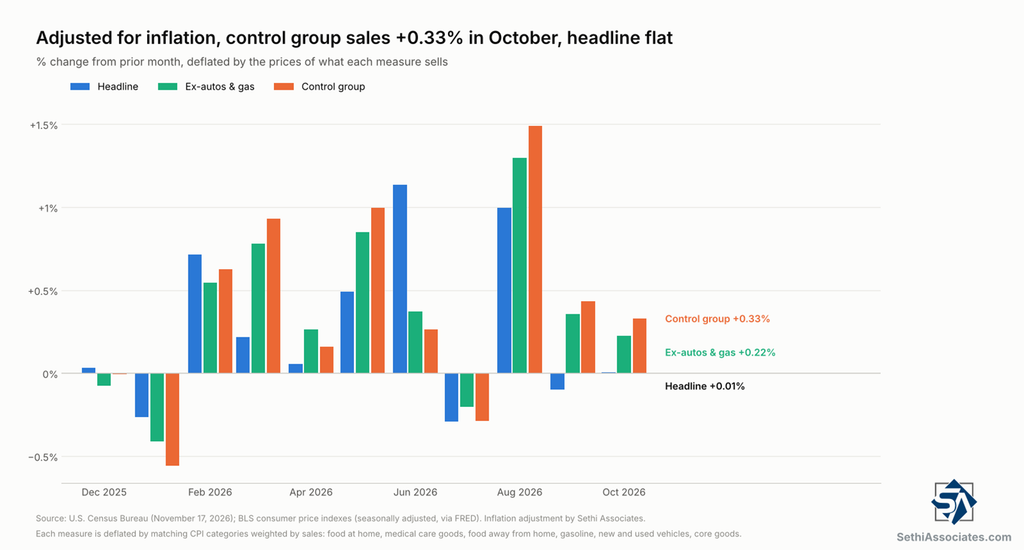
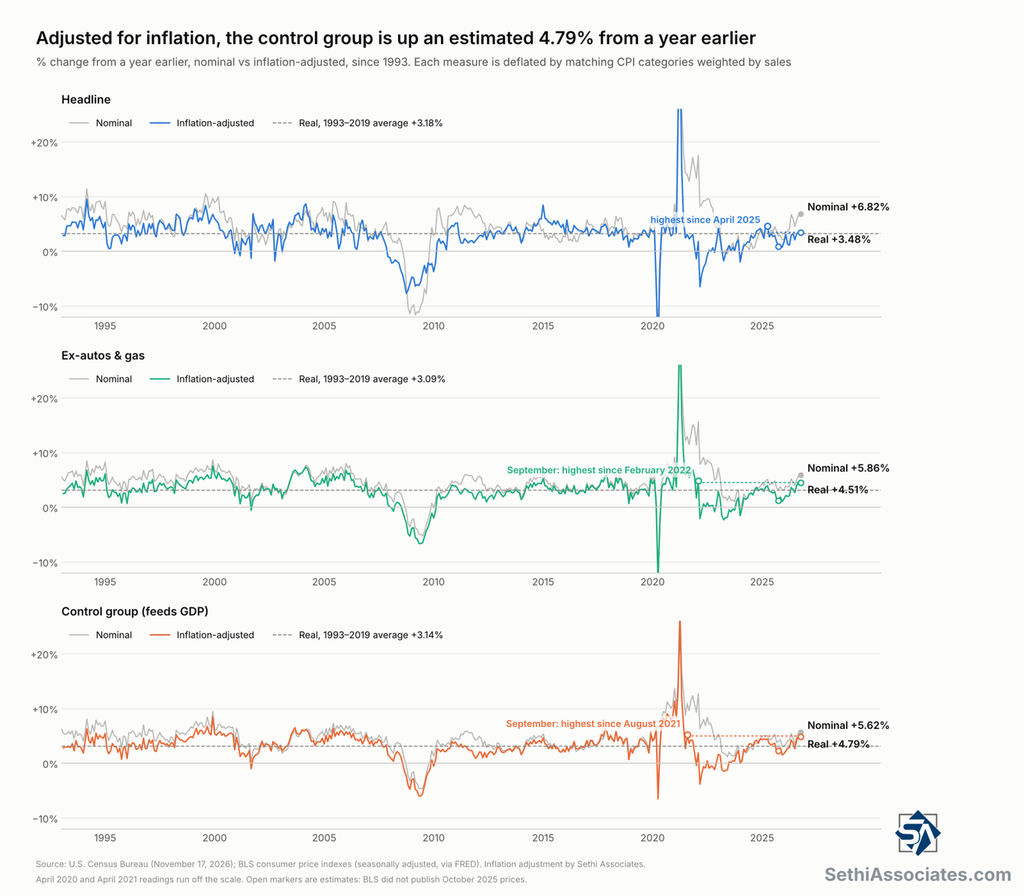
On that basis, headline sales were essentially flat in October (+0.01%) after −0.10% in September, as the prices of what retailers sell rose 0.21%. From a year earlier, though, they’re up an estimated 3.48%, the most since April 2025, and the level is just 0.09% below August’s record.
That’s a very different picture from the more common approach of deflating by the overall consumer price index (which FRED uses for its real retail sales series), since that index also includes services such as shelter that retailers don’t sell. On the CPI basis, real sales fell 0.14% in October and are up an estimated 2.70% from a year earlier using our 4.02% CPI estimate (Core CPI Comes in Hot Again, Putting a Half-Point Fed Hike on the Table) and remain 3.29% below their April 2022 peak.
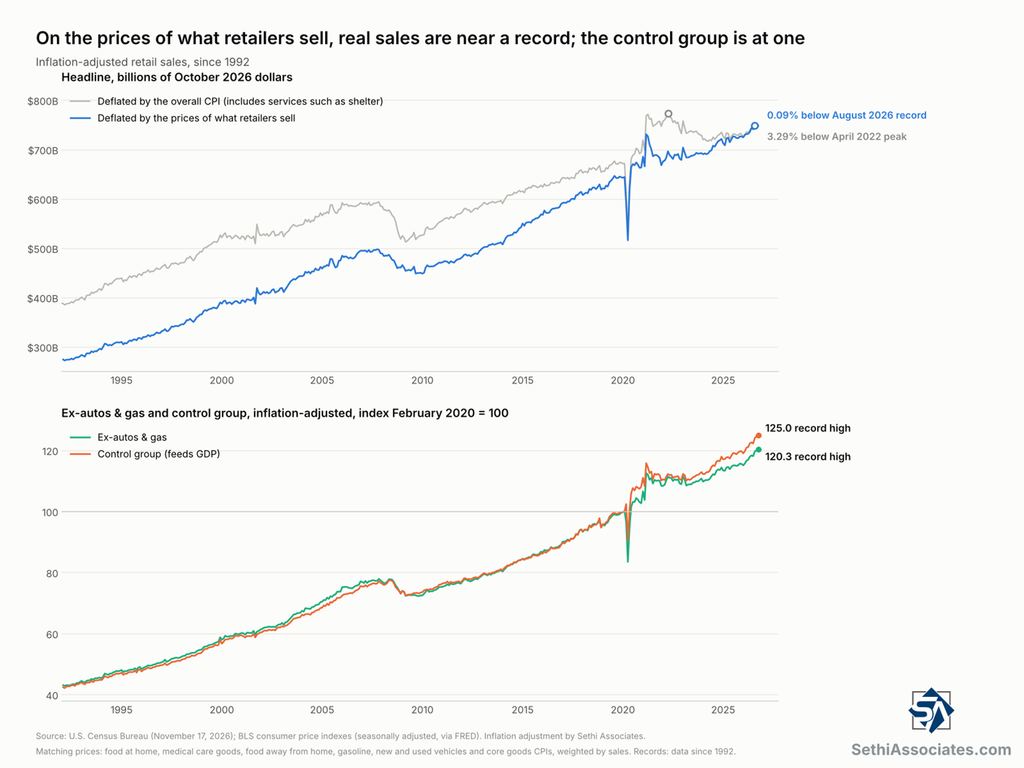
Excluding autos and gasoline, real sales rose 0.22% after +0.36% in September, with prices up 0.29%. They’re up an estimated 4.51% from a year earlier, matching September’s pace, which was the most since February 2022, and are at a record high.
The control group did best, with real sales up 0.33% after 0.43% in September to a record high, as its prices rose just 0.26%. It’s up an estimated 4.79% from a year earlier, down from September’s 4.95%, the most since August 2021, but well above its 1993–2019 average of 3.14%. Prices of the goods in the control group rose an estimated 0.80% over the past year, held down by falling prices for medical goods (−3.27% in the year through September) and core goods inflation of just 0.71%.
Analyst Reaction
Bloomberg said “a pullback in big ticket items like cars masked resilient demand for other goods,” and that the report “points to mixed consumer demand at the start of the fourth quarter. A stable job market alongside stock market gains have helped households weather widespread price increases, including for necessities like food and energy.” It added that seasonal promotions from Amazon.com (AMZN), Target (TGT) and Walmart (WMT) “may have also supported sales,” with companies saying “the inflationary environment has encouraged consumers to be more value conscious.”
ZeroHedge focused on the annual pace, noting headline sales growth of 6.8% year-over-year was “the strongest annual gain since Oct 2022.”
What to Watch
The takeaway is that outside of autos consumer spending was solid in October. Retailers report this week, with Home Depot (HD) today, Target (TGT), TJX (TJX) and Lowe’s (LOW) Wednesday and Walmart (WMT) Thursday, and November retail sales are due December 16.
Census release. Charts are built from Census Bureau data, with real sales deflated by BLS consumer prices via FRED.