What to Watch as Utilities and Energy Mask Solid Factory Output
Industrial production fell 0.4% in October as utilities and energy output dropped sharply, but manufacturing rose for a second month driven by autos to its highest level since March 2022.
You've reached your free article limit
You've read 0 of 1 free Pro articles.

- U.S. Industrial Production (M/M) Oct: -0.4% (est +0.1%; prev +0.7%; prev R +0.7%)
- Manufacturing Production (M/M): +0.3% (est +0.3%; prev +0.3%; prev R +0.3%)
- Capacity Utilization: 76.4% (est 76.8%; prev 76.9%; prev R 76.8%)
Executive Summary
- October industrial production fell 0.43%, the most since January, a clear miss versus the 0.1% gain expected and the first decline since August. September was revised up to +0.73% and August down to -0.07%, leaving the three-month average at a near-flat +0.07%.
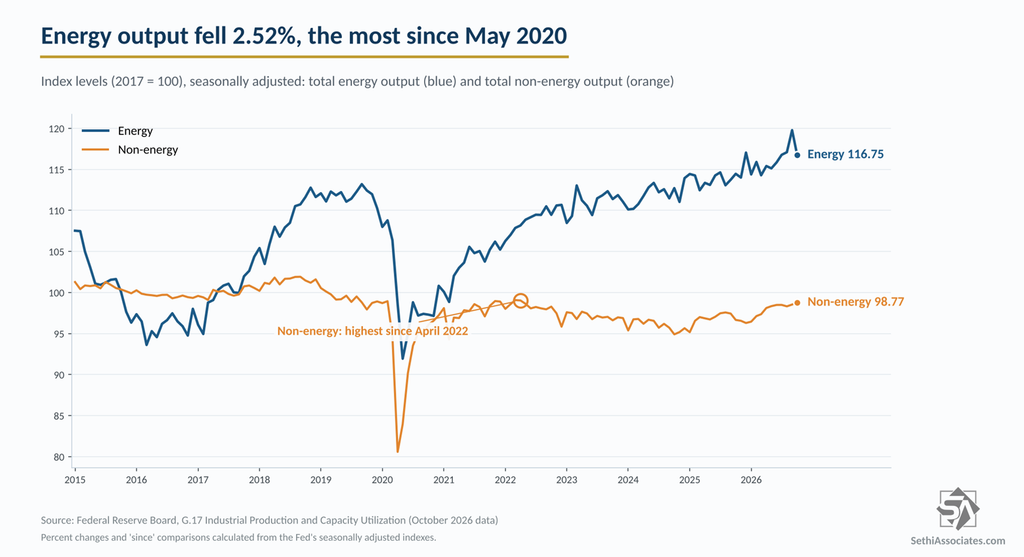
- The drop in October though came from utilities and energy, not factories. Utilities fell 4.25%, the most since January 2023, after September’s record, subtracting 0.55 percentage point from the headline. Mining, mostly oil and gas, took off another 0.10 point, and total energy output fell 2.52%, the most since May 2020.
- Manufacturing rose 0.28%, the most since April and in line with the 0.3% expected, to its highest level since March 2022, adding 0.21 point. Motor vehicles and parts jumped 4.44% and added 0.25 point, more than all of manufacturing’s contribution and the most since February 2025, while hi-tech output (computers, communications equipment and semiconductors) rose 2.05% to a record and added 0.05 point. The rest of manufacturing subtracted 0.09 point.
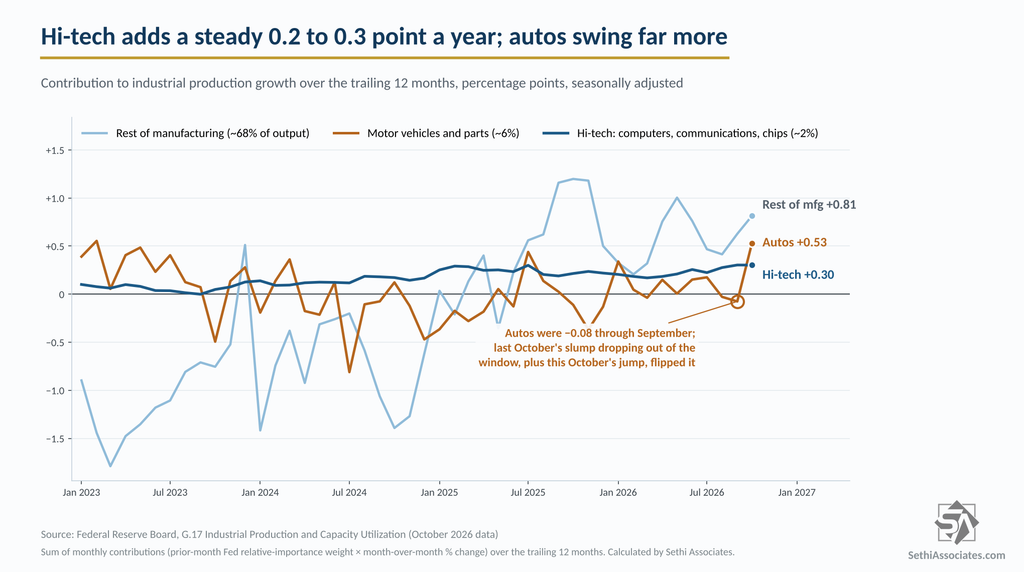
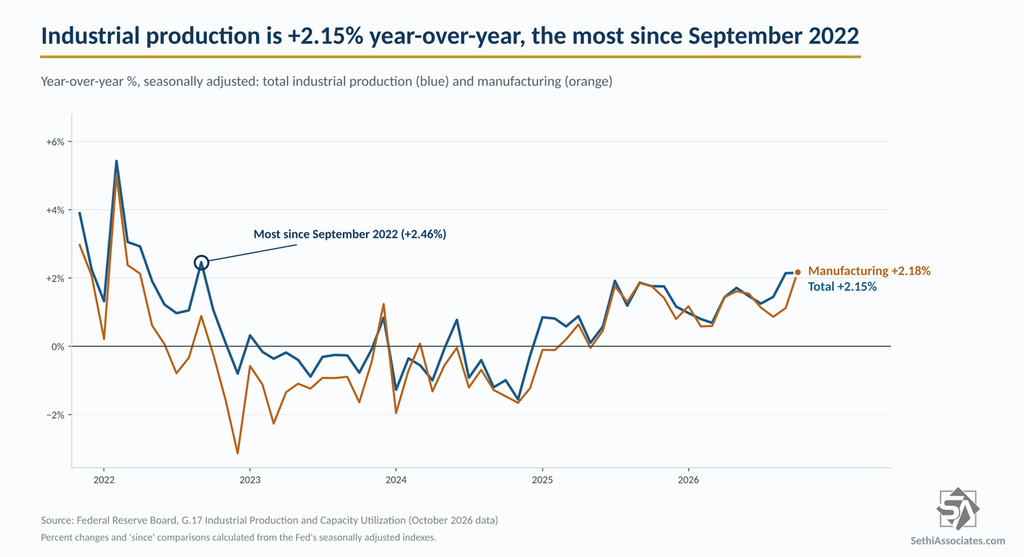
- Over the past 12 months, autos added 0.53 point to industrial production and the rest of manufacturing 0.81 point, against 0.30 point from hi-tech. Year-over-year, total output is +2.15%, the most since September 2022, and manufacturing +2.18%, the most since March 2022. Capacity utilization fell to 76.36% from 76.77%, below the 76.8% expected.
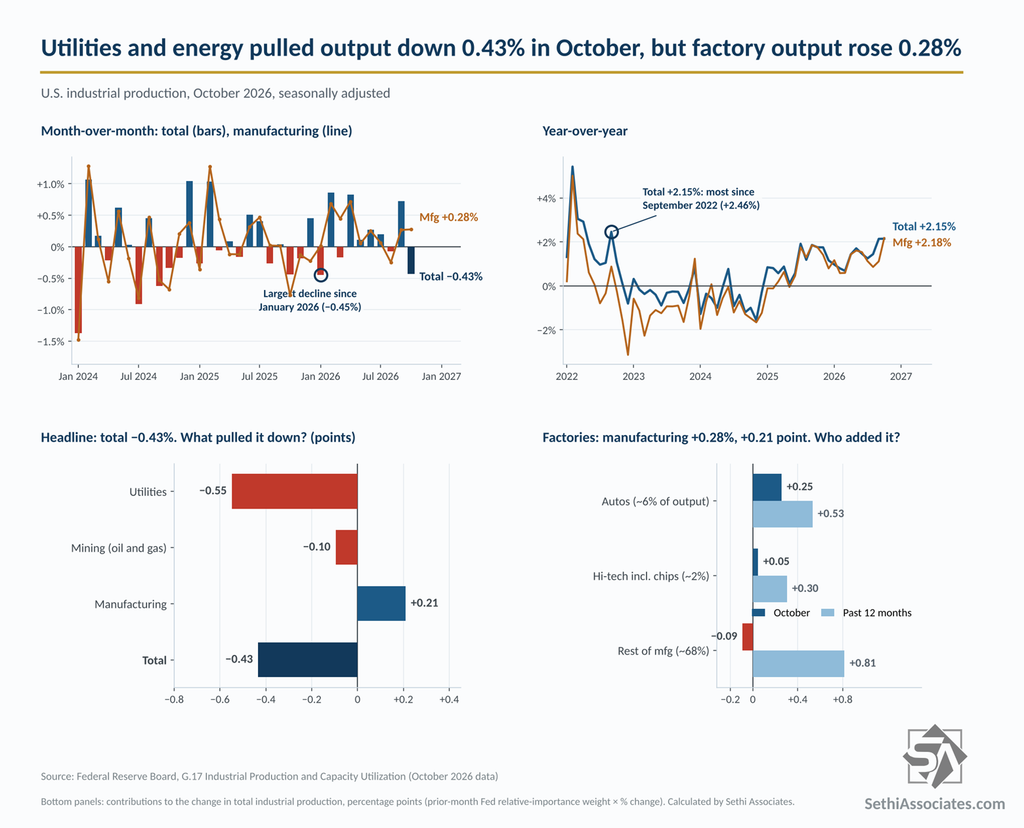
Although industrial production accounts for only around 12-15% of total gross domestic product, it is considered an important macroeconomic indicator as it measures output from the manufacturing (~75% of industrial production), mining (~12%) and utility (~12%) industries, and can aid in forecasting structural changes in the economy, business cycle inflection points and inflationary trends. Note industrial production measures real (inflation-adjusted) output, with each industry weighted by its share of value added.
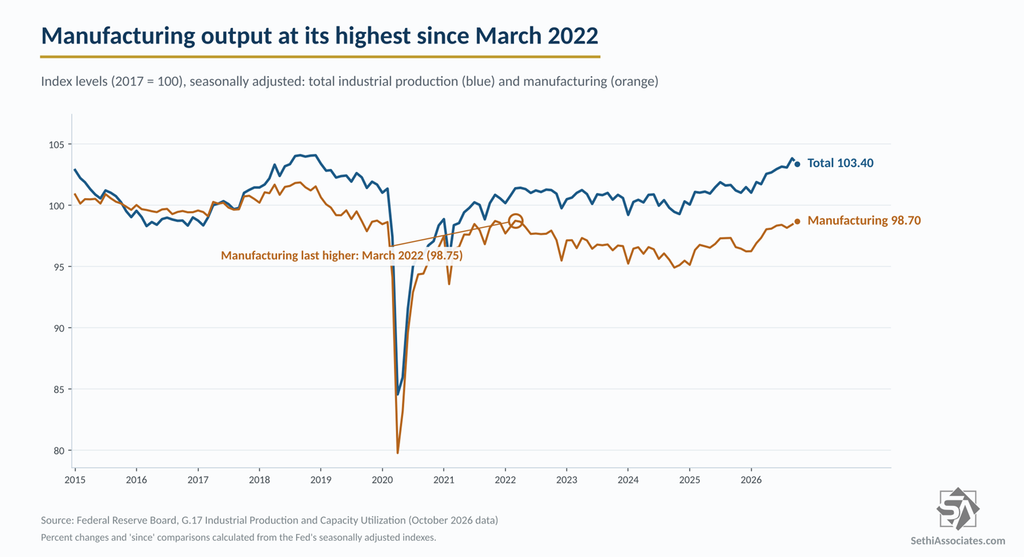
October industrial production (blue) fell 0.43% from September, the largest decline since January, a clear miss versus the 0.1% gain expected and the first decline since August. That gave back part of September’s gain, which was revised up to +0.73% (initially reported at +0.66%), while August was revised down to -0.07% (from +0.06%). The three-month average is +0.07%.
Manufacturing (orange, ~75% of industrial production), though, rose 0.28%, the most since April and a second straight gain, roughly in line with the 0.3% expected, with September unrevised at +0.27%.
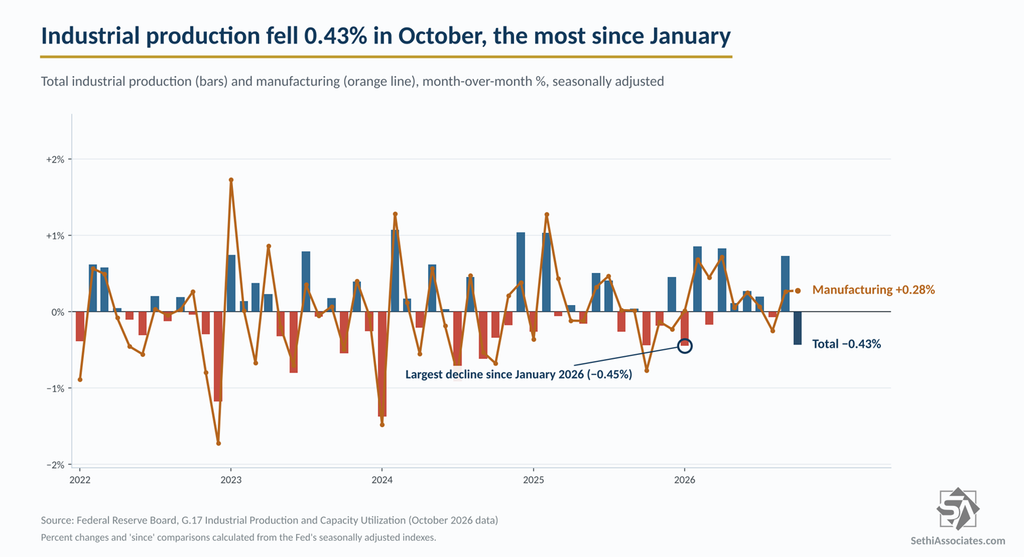
Using the Fed’s relative-importance weights, utilities subtracted 0.55 percentage point from the headline and mining 0.10 point, while manufacturing added 0.21 point.
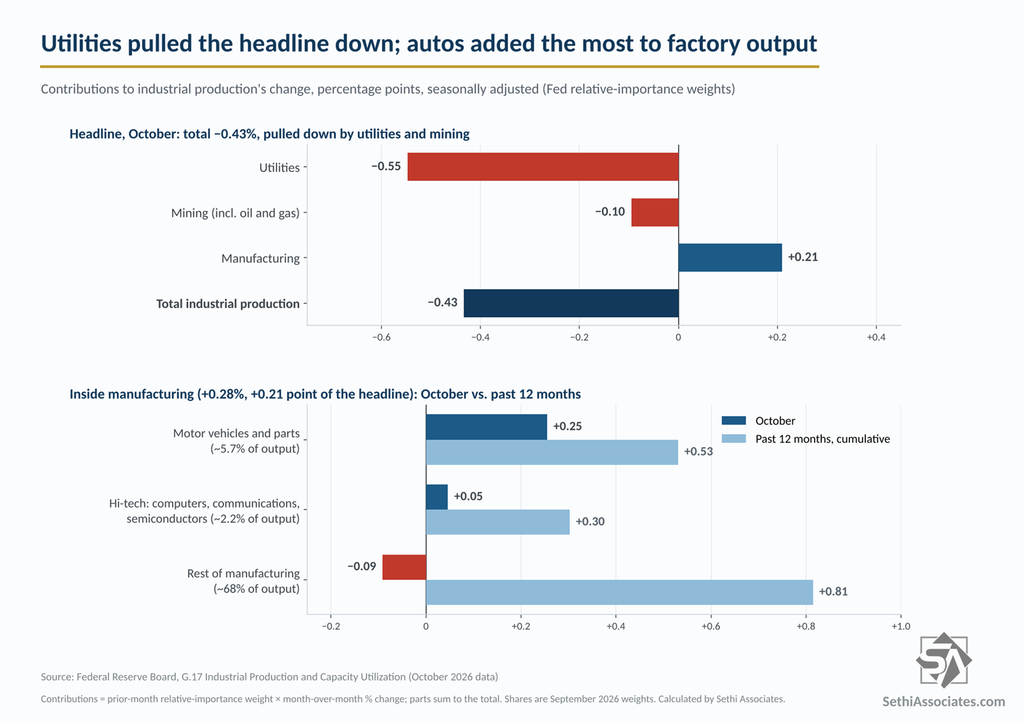
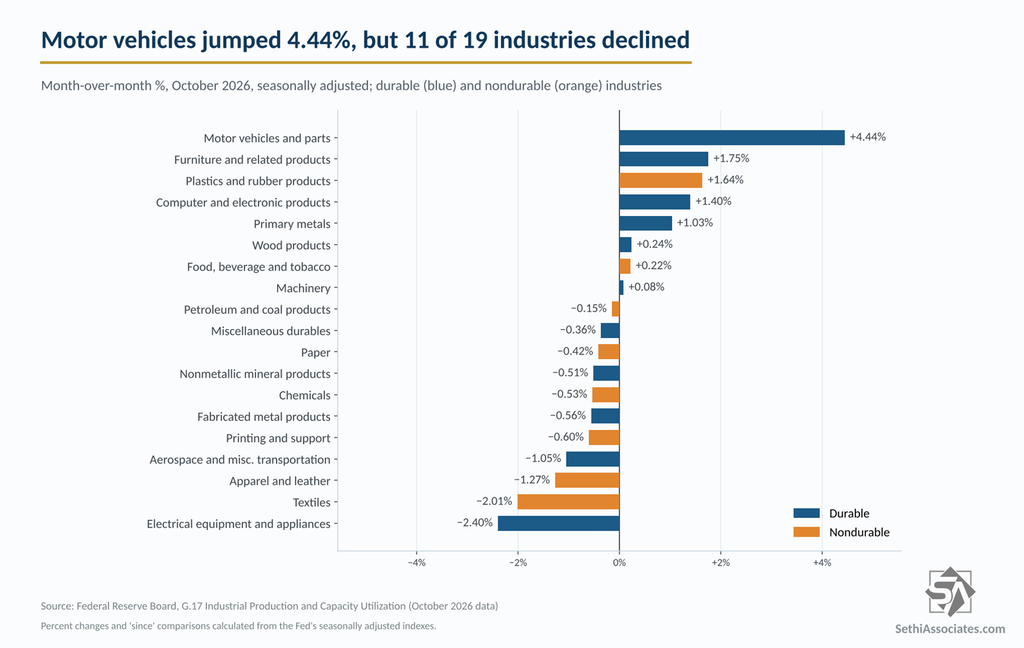
Autos did most of the lifting. Durable manufacturing rose 0.53%, led by a 4.44% jump in motor vehicles and parts, the most since February 2025, driven by motor vehicle assemblies rising to a 10.73 million annual rate from 10.34 million. Motor vehicles and parts, about 5.7% of industrial production, added 0.25 point to the headline, more than manufacturing’s entire 0.21-point contribution and the most since February 2025. Hi-tech, about 2.2% of output, rose 2.05% to a record and added 0.05 point, and the rest of manufacturing, about 68% of output, subtracted 0.09 point.
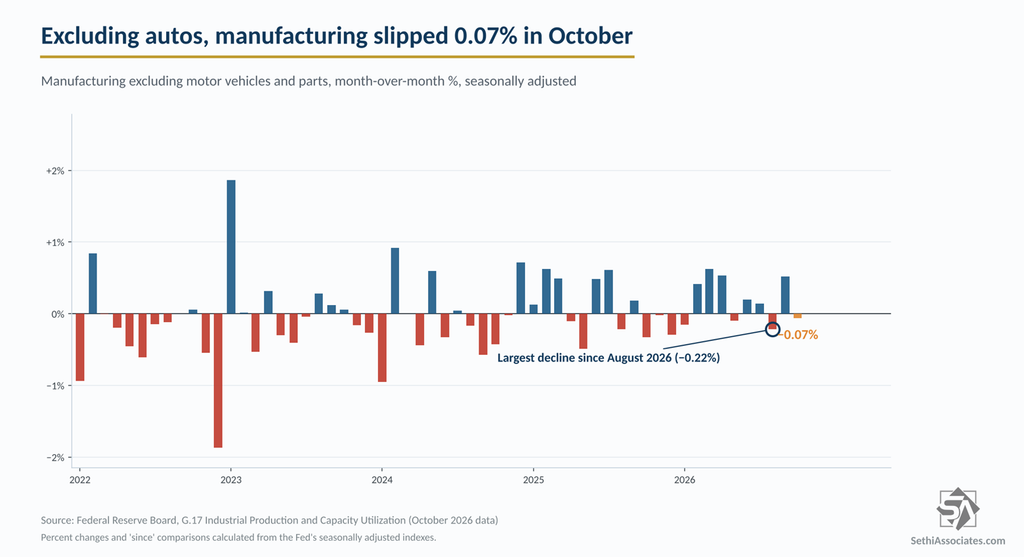
Nondurable manufacturing was flat (-0.03%). Excluding motor vehicles and parts, manufacturing slipped 0.07%, the first decline since August.
Over the past 12 months, autos added 0.53 point and the rest of manufacturing 0.81 point, versus 0.30 point from hi-tech, but that is the first time autos have exceeded hi-tech since January with the latter a much more stable source of output.
Factory output is now at its highest level since March 2022, while total industrial production eased from September’s highest level since December 2018.
From a year earlier, total industrial production is +2.15%, up from +2.14% in September and the most since September 2022, while manufacturing is +2.18%, the most since March 2022.
Only eight of the 19 major manufacturing industries grew. Behind autos, the biggest gains came in furniture (+1.75%), plastics and rubber products (+1.64%, the most since March 2025), computer and electronic products (+1.40%, to a record high) and primary metals (+1.03%, to the highest level since October 2015). Electrical equipment and appliances fell 2.40%, the most since June 2025, followed by textiles (-2.01%) and apparel (-1.27%).
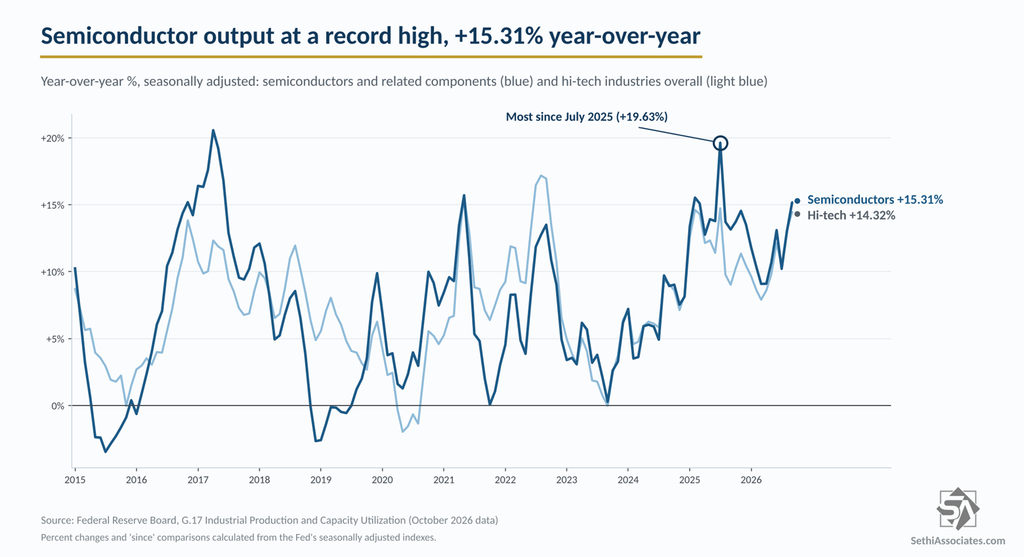
Hi-tech output rose 2.05%, the most since January, to a record high, and semiconductors and related components rose 2.22%, also to a record, and are +15.31% year-over-year.
Looking at industrial production from another angle, “market groups” (product-use classifications), “the major market groups posted mixed results in October.” Business equipment and defense and space equipment rose, while “all other major market groups posted declines.” Consumer goods fell 0.74%, the most since March, as a 4.60% drop in consumer energy products outweighed a 3.01% gain in automotive products.
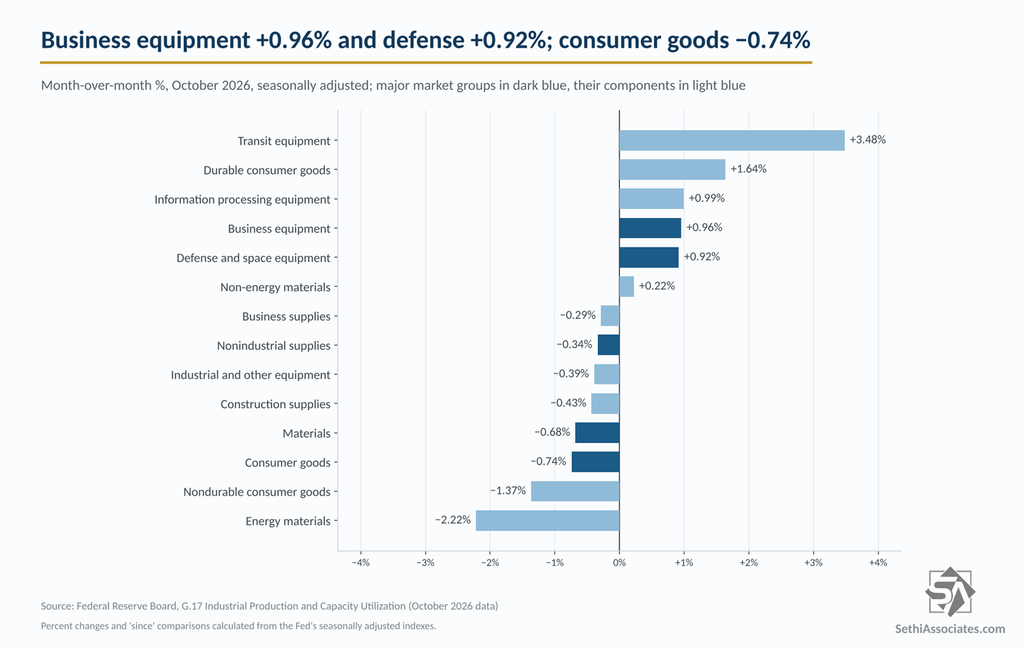
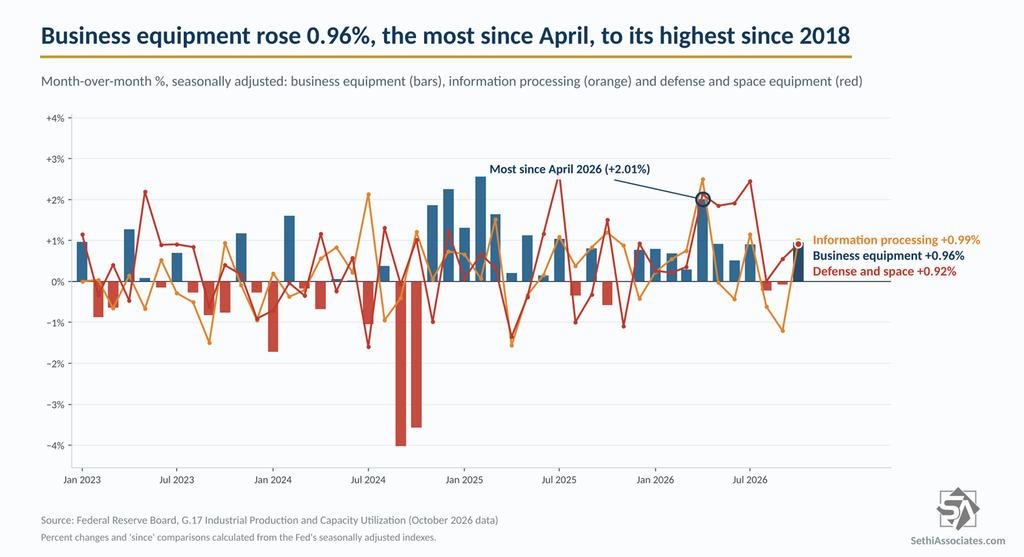
Business equipment rose 0.96%, the most since April, to its highest level since October 2018, with transit equipment +3.48%, information processing +0.99% and industrial and other equipment -0.39%. Defense and space equipment rose 0.92% to a record high.
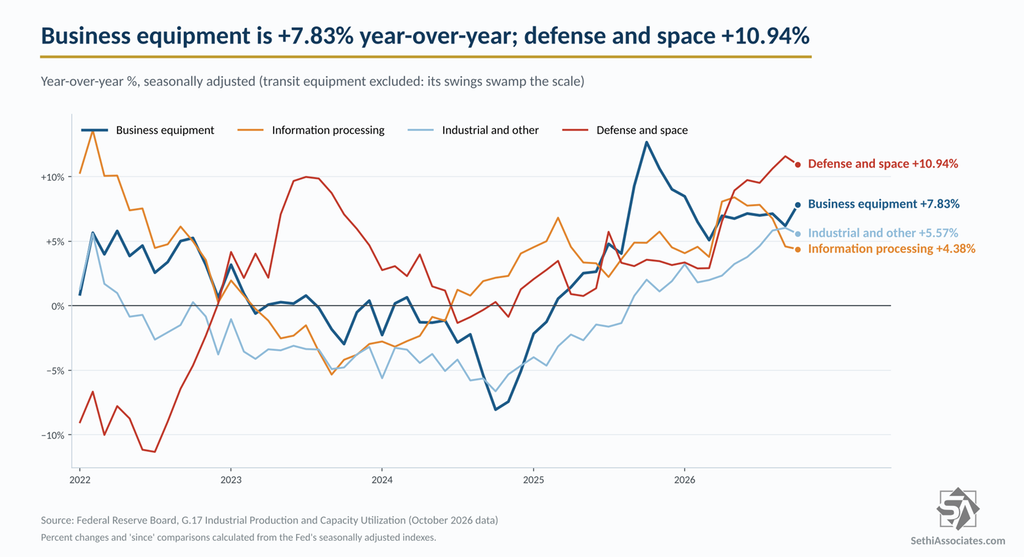
Year-over-year, business equipment is +7.83%, defense and space +10.94%, industrial and other equipment +5.57% and information processing +4.38%.
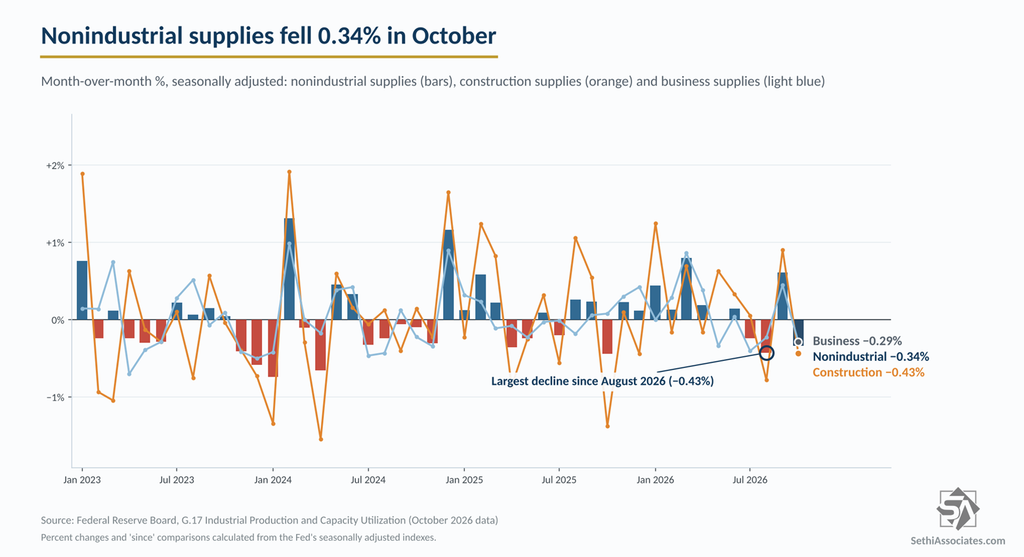
Nonindustrial supplies (intermediate goods used as inputs outside the industrial sector) fell 0.34%, with construction supplies -0.43% and business supplies -0.29%.
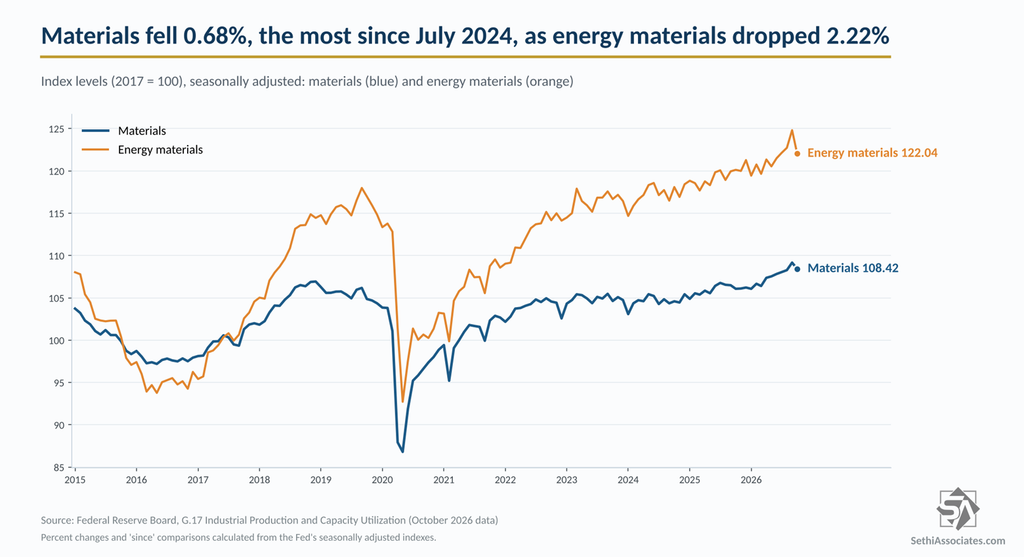
Materials fell 0.68%, the most since July 2024, “driven by a decline of 2.2 percent in its energy component” (-2.22%, the most since February 2021).
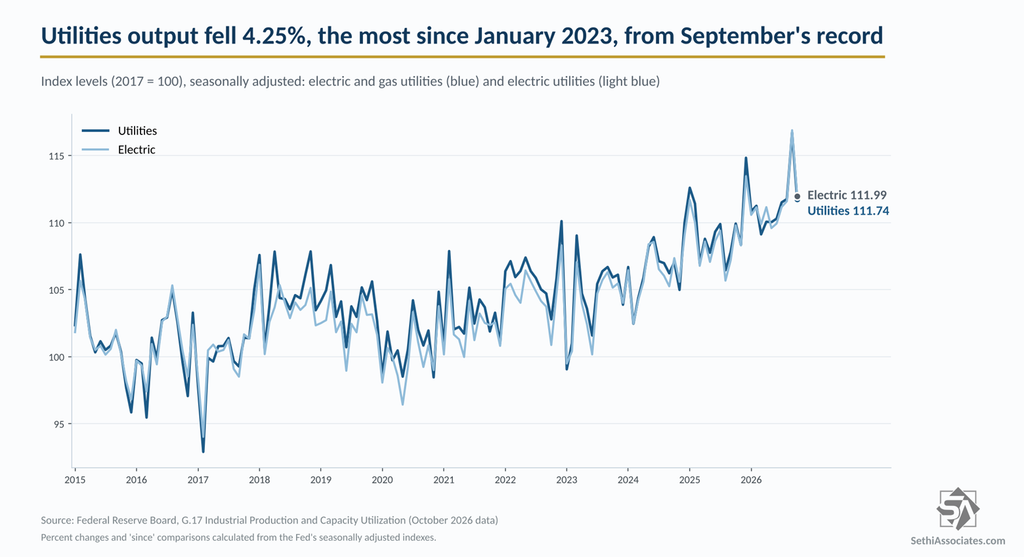
Utilities fell 4.25%, the most since January 2023, after a 4.43% jump in September (revised from +3.50%) to a record. “The output of both electric and natural gas utilities declined in October,” with electric -4.20% and natural gas -4.65%. ZeroHedge called it “a classic weather-related reversal after an unusually strong September,” noting the contiguous U.S. had its fourth-warmest October on record.
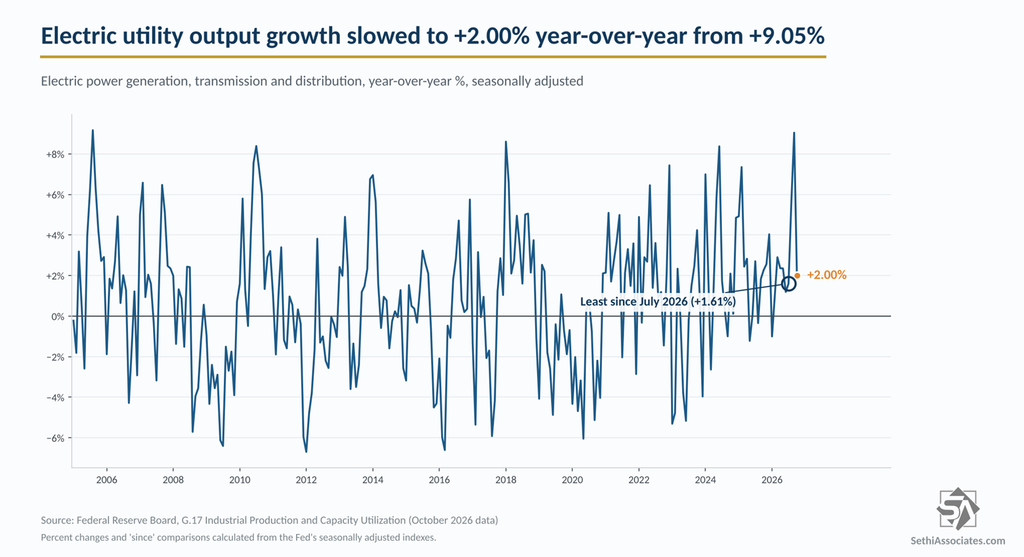
Electric utility output growth slowed to +2.00% year-over-year from +9.05% in September despite data center demand.
Mining (which includes oil and gas exploration) fell 0.85%, the most since March, and a second straight decline after September was revised to -0.22% (from +0.15%).
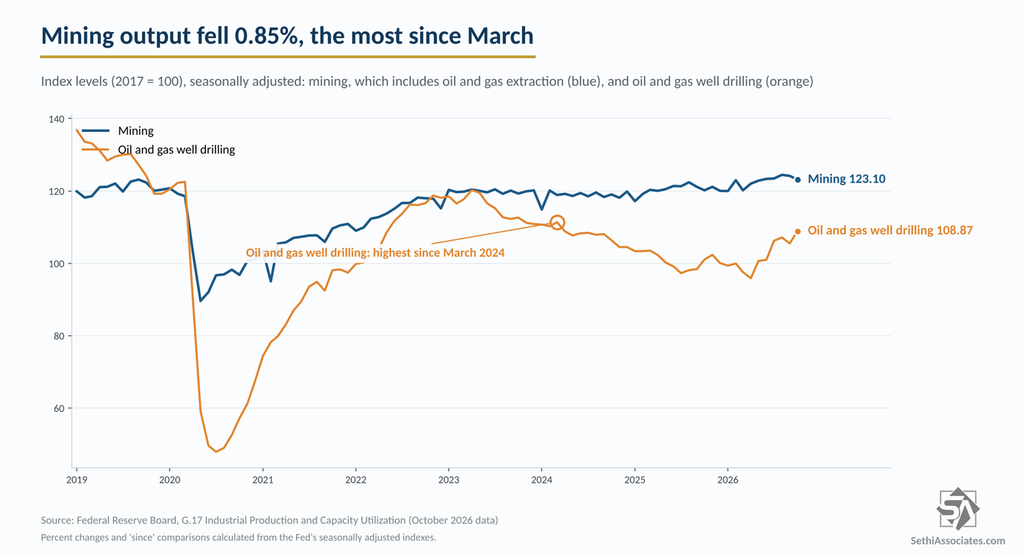
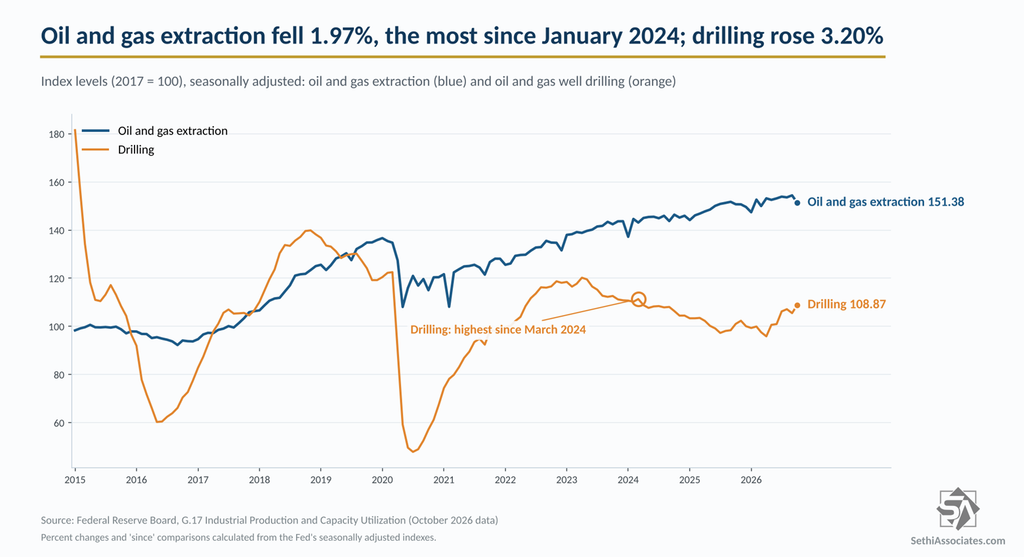
Oil and gas extraction fell 1.97%, the most since January 2024, with crude oil -2.07% and natural gas and natural gas liquids -1.55%. Oil and gas well drilling rose 3.20%, the most since July, to its highest level since March 2024, and is +7.76% year-over-year.
Overall energy output fell 2.52%, the most since May 2020, from September’s record, while non-energy output rose 0.25% to its highest level since April 2022.
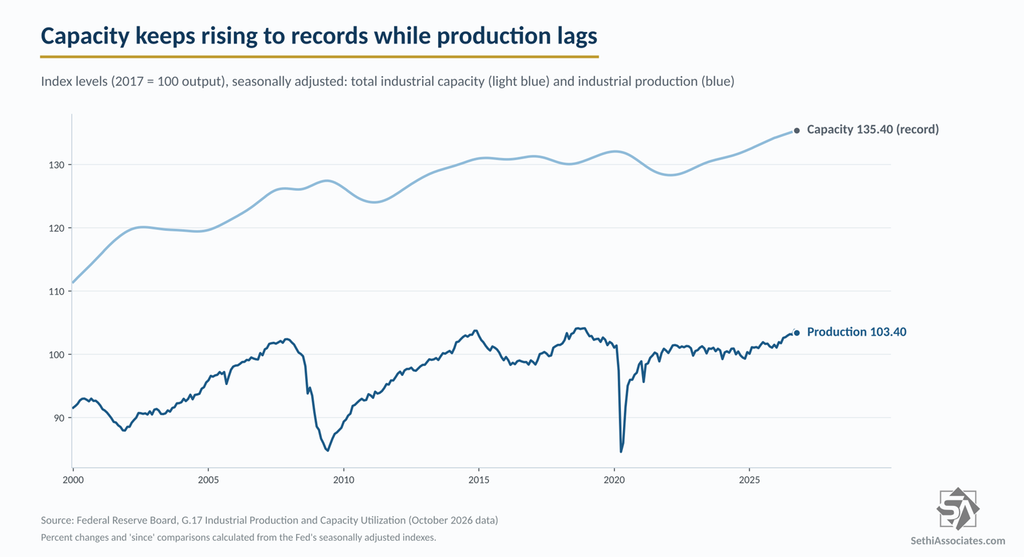
Total industrial capacity rose to another record, +1.15% year-over-year, so production continues to lag capacity.
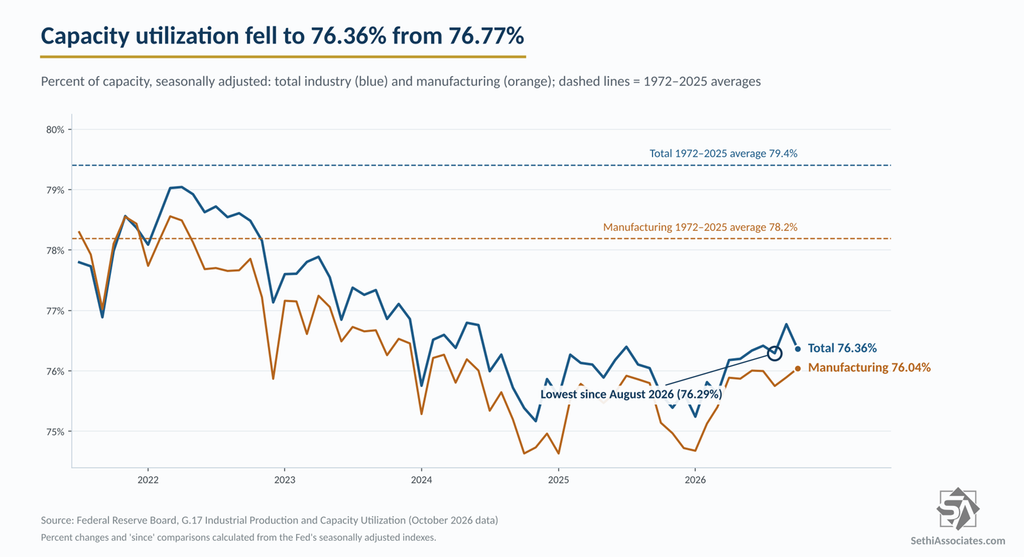
Capacity utilization (blue) as a result fell to 76.36%, below the 76.8% expected, from 76.77% in September (revised from 76.85%), “a rate that is 3.0 percentage points below its long-run (1972–2025) average.” Factory utilization (orange) though rose to 76.04%, the highest since May 2024, although still “2.2 percentage points below its long-run (1972–2025) average.”
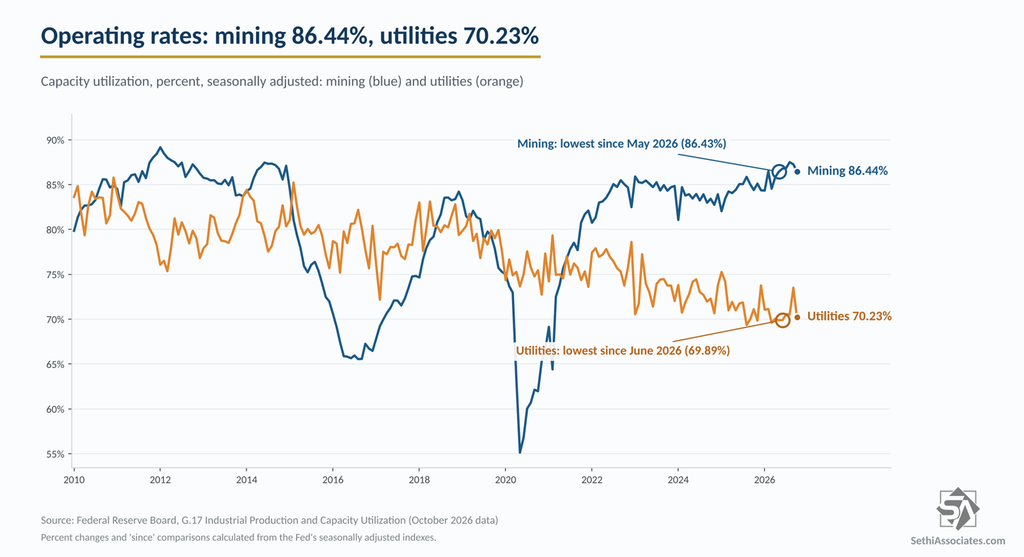
“The operating rate for mining moved down 0.8 percentage point to 86.4 percent, and the operating rate for utilities declined 3.3 percentage points to 70.2 percent.”
What to Watch
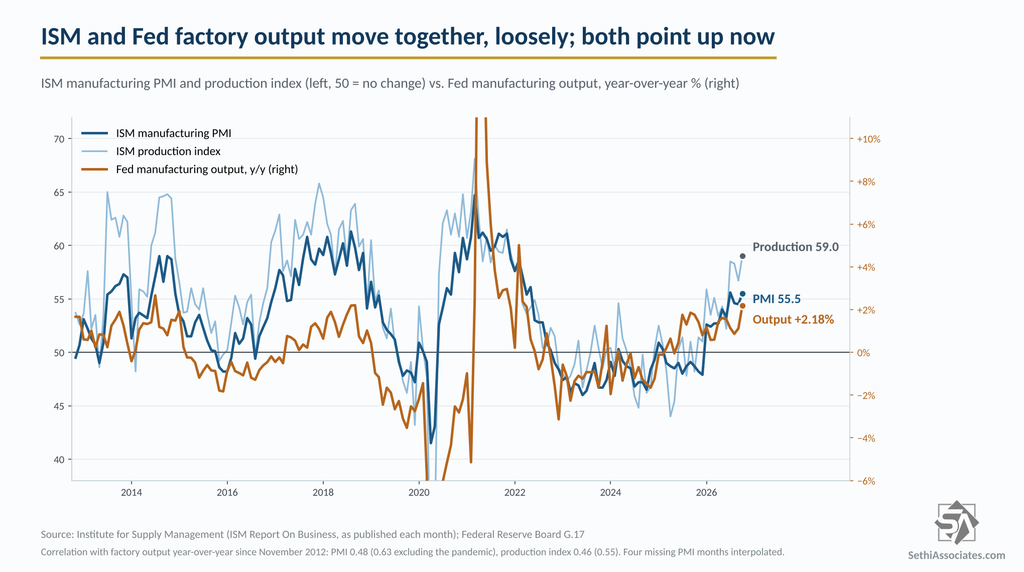
ISM’s manufacturing PMI rose to 55.5 in October and its production index to 59.0, the highest since November 2021. By our calculations, the PMI’s correlation with year-over-year factory output since late 2012 is 0.48 (0.63 excluding the pandemic), and the two move roughly together, with ISM leading by a month at most. The survey has often run hotter than the hard data, but not now: a PMI of 55.5 has typically lined up with factory output growth of about 0.8%, well below October’s +2.18%.
The Fed will publish its annual revision on November 24, moving the indexes to a 2022 base year and adding new Census benchmarks for 2023 and 2024, so the history behind these comparisons can shift. November data follow on December 16.
Source: Federal Reserve G.17