Charting the S&P 500: Hanging by a Thread to Bullish Signals
There was plenty of volatility this past week and it appears there will only be more.
You've reached your free article limit
You've read 0 of 1 free Pro articles.
Markets started on the right foot last Monday with a massive rally on good volume. There was no follow through the next day but let’s be clear — a 1.5% rally Wednesday sealed the deal to retain the uptrend. Yet, with news about Nvidia’s (NVDA) CEO departure imminent the buyers were not likely to take undue risk. The last couple of sessions of the week stuck to the pattern of weakness late, something that seems troublesome.
The candle remains teal, which is slightly bullish on the GoNoGo composite of indicators. That really is the only bullish signal we have on this weekly chart. The MACD continues to pull down as momentum (stochastics) just pushes lower.
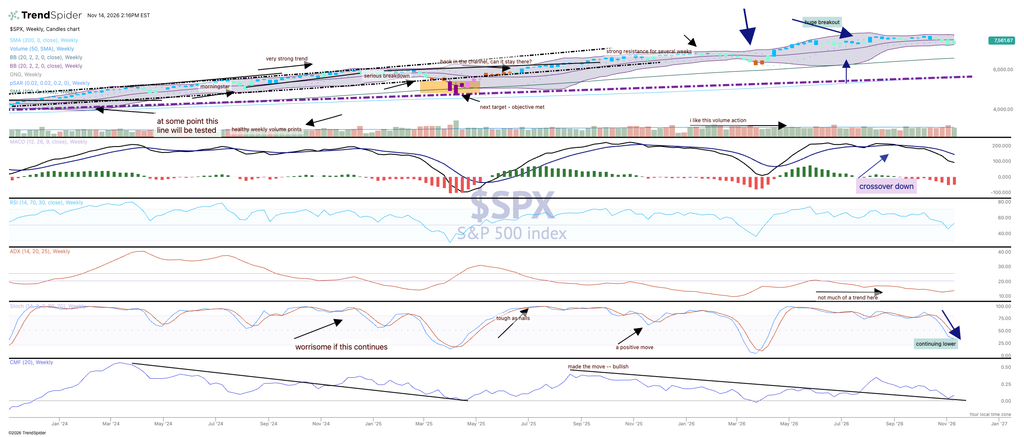
Money flow is barely hanging on to bullish signals. While the price action is resilient, the volume trends are not, they are neutral at best.
All signs seem to point towards a gradual pullback rather than fierce year-end rally.
At the time of publication, TheStreet Pro Portfolio was long NVDA.