Weekly Roundup: An Electric Week for the Market Was Also a Great One for the Portfolio
We added to one holding this week, and locked in outsized gains for two others.
You've reached your free article limit
You've read 0 of 1 free Pro articles.
The S&P 500 closed the week up modestly and, following Friday’s trading session, the Nasdaq Composite was little changed over the last five trading session. Factoring that into the equation, the S&P 500 finished the first half of Q3 2026 up shy of 4% while the Nasdaq Composite gained less than 2%. By comparison, the Portfolio climbed 5% over the last six and half weeks, and that outperformance expanded our year-to-date lead over the S&P 500.
During the week, the market digested the July CPI and PPI reports as well as the realization the duration of the conflict between the U.S. and Iran is going to be longer than many hoped. At the same time, the market shrugged off the continued move higher from oil and gas prices as well as Treasury yields with the Cboe Volatility Index (VIX) and other indicators pointing to a market that is increasingly complacent and somewhat giddy.
With the VIX closing the week at 14.34, its lowest level in 2026, we would argue even more than we did on Wednesday, the prudent move is to walk carefully in the near term. With that in mind, as you’ll read below, we lifted the Portfolio’s cash position this week, and we will continue to evaluate incoming data points and developments to position the Portfolio as needed. While August tends to be a seasonally slow time of year for the market, fortune does favor the prepared, and that is exactly what we’ll be doing, following the data as we do so.
We will also be doing some work on consensus EPS expectations for the S&P 500 for the back half of this year and 2027. Data from FactSet finds that, so far, 86% of S&P 500 companies which have reported Q2 2026 results delivered a positive EPS surprise. That, along with the market’s shift toward a Fed standing pat in September, helped propel the market to all-time highs this week.
One of the questions we’re working through is to what degree those paper gains from corporate investments in other companies and tariff refunds are already factored into EPS expectations. Are they a source of potential upside or just a cushion factor for existing consensus EPS expectations?
To the extent those forces do repeat in the coming quarters, the market is likely to ask some questions about the current consensus 2027 EPS figure of $405.17 for the S&P 500 and the implied 13% increase versus 2026.
As we move through next week, we’ll be working on that answer and paying close attention to what the August Flash PMI report has to say about in inflation pressures.
Enjoy your weekend, Saturday’s signals alert, and we’ll see you back here, bright and early on Monday as we begin the second half of Q3 2026.
Catching Up on the Portfolio This Week
The Portfolio continued to gain ground this week and we extended our lead over the S&P 500 as well. Friday’s move lower took some wind out of our sail, but year-to-date the Portfolio finished the week up more than 18.5%.
Incremental gains this week were reflected the larger moves in our shares of Neostellar Capital (NSLR), Netflix (NFLX), Axon (AXON) and Arista Networks (ANET) as well other holdings those rose faster than the S&P 500 this week. Those gains were mitigated by declines at Applied Materials (AMAT), Broadcom (AVGO), Amazon (AMZN), Apple (AAPL), Alphabet (GOOGL) and Builders FirstSource (BLDR).
Also helping the Portfolio was the aggregate rebound in the EPS All-Stars basket. While still a drag on the Portfolio’s performance, quarter to date it became a far smaller one. As we close out the first half of Q3 2026, that basket was down less than 2% compared to -18.2% at the end of July.
This week we made a few moves with the Portfolio that put some capital to work and rang the register, locking in some sweet gains for the Portfolio. On Monday, we used the post earnings drop in shares of Neostellar Capital (NSLR) to rebuild our position. The following day we learned CEO Mark Klein was also a buyer.
On Tuesday, we used the overbought condition in Microsoft (MSFT) shares to monetize a piece of the more than 40% move in the shares since late July. Wednesday, we made a similar move with Eaton (ETN) shares, fetching a nice 62% gain on that slug of shares.
Exiting the week, our cash position was around 8.2% of the Portfolio’s assets. Given our comments about the recent giddiness in the market, we are likely to tread carefully near-term, and subject to market conditions, take prudent action as needed. We’ll continue to look for opportunities to build up some of our newer positions as well as round out existing ones.
Now let’s turn and see what others on Wall Street had to say about the Portfolio’s holdings during this shortened but electric week for the market:
Tuesday: Philip Securities boosted its Palantir price target to $215 from $202, and reiterated its Buy rating. William Blair reinstated coverage of Applied Materials shares with a Market Perform rating. Argus upgraded shares of Boeing to Buy from Hold with a $265 target
Wednesday: Wells Fargo boosted its Microsoft target to $700 from $650. Piper Sandler boosted its target on American Express shares to $405 from $396
Thursday: JPMorgan bumped up its December 2027 Microsoft target to $625 from $550 citing growth acceleration in Azure and M365 Commercial Cloud with its AI infrastructure buildout “being the key underlying driver for acceleration in both businesses.”
Friday: We saw numerous price target revisions for Applied Materials. Some were higher, like those from Seaport Research ($575 from $500), Craig-Hallum ($585 from $530), RBC Capital ($600 from $520) and JPMorgan ($650 from $515). Others on Wall Street reduced what some would consider more aggressive price targets, like the ones at B.Rile ($790 to $700), BofA ($720 to $650), and UBS ($705 to $675).
Key Global Economic Readings
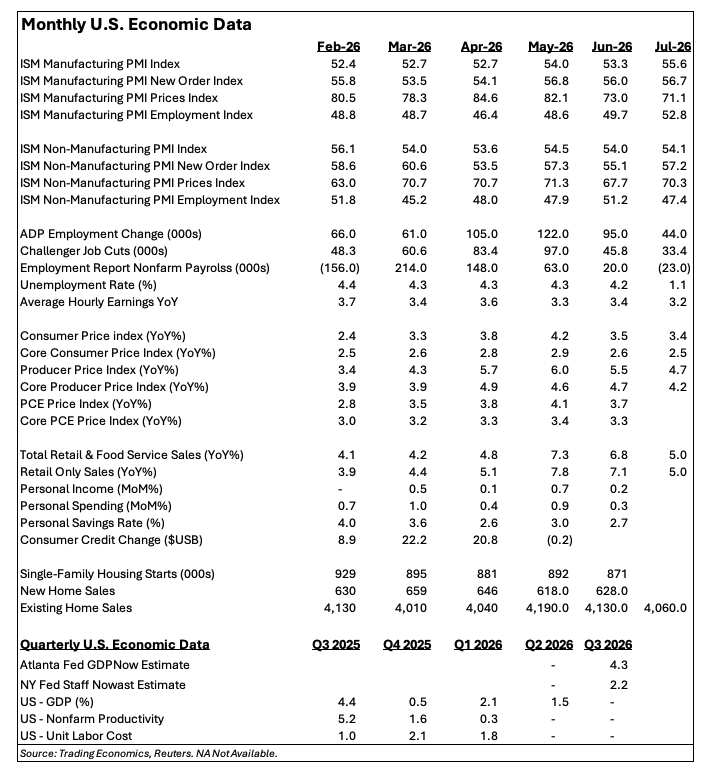
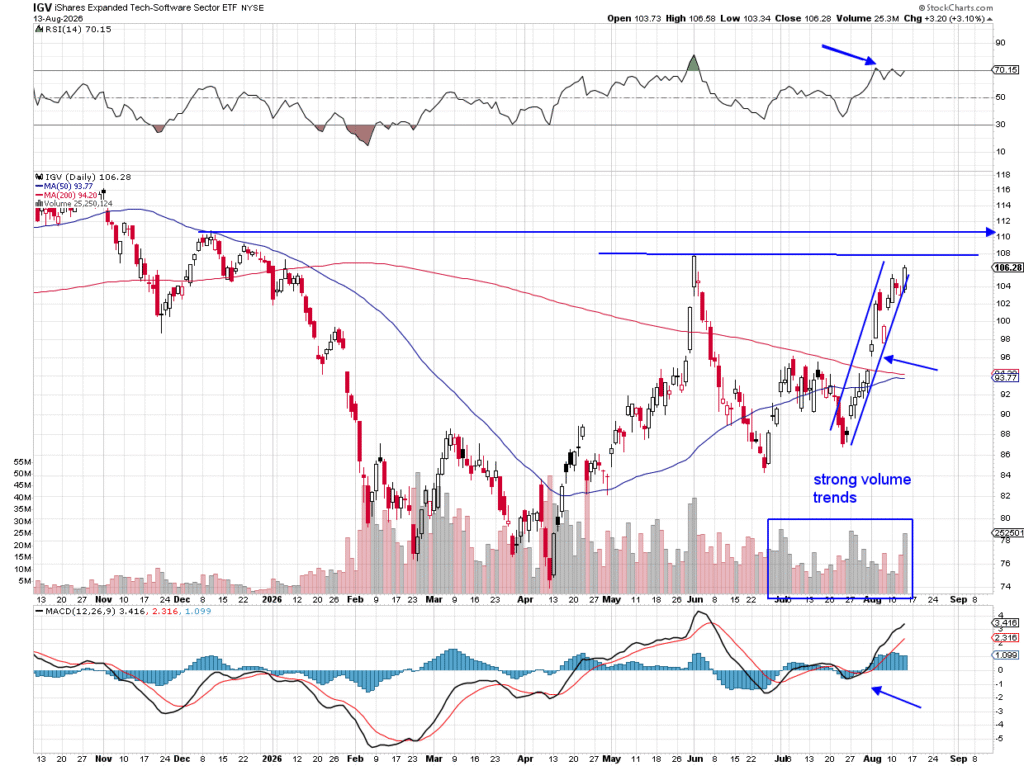
Chart of the Week: iShares Expanded Tech-Software Sector ETF
What a turnaround for the software sector! It seemed that in the future once all companies embraced and started to use AI it was going to make software, or software-as-a-service (Saas), completely worthless and useless. Of course, that was hyperbolic thinking, but when your mind is focused only on one concept or trend at a time, you tend to think with blinders on rather than seeing the entire worldview. What do I mean exactly? Basically, as Jensen Huang of NVIDIA (NVDA) said that companies like ServiceNow (NOW), Salesforce (CRM), Microsoft (MSFT) and Workday (WDAY) are vital components to the AI buildout and are necessary requirements.
Regardless of the pleas for calm and rationality, this group was severely punished by the sellers. Look at the (IGV), iShares Expanded Tech-Software ETF. It collapsed from the highs in November 2025 to its lowest level in early April. That market a spot not seen since 2023 and put the IGV down about 32% for the year, in just three months’ time! Stunning move, but even more impressive is the recent surge.
The IGV has a ton of positive energy here, with a strong buy on the MACD and overbought condition in the RSI (top pane). The recent move above the 50- and 200-day moving averages was accomplished on higher turnover, the volume trends are now firmly bullish. Looking at the candle chart, we can see the IGV has only had four down sessions in the last 15, more than 20% in the time, an impressive run that does not appear to be over yet.
There is resistance, however, just ahead at $108 then at $111. We’ll see how the IGV responds to sellers at these posts, but there’s no question this ETF is on the rise. Just back to flat for 2026 is not good enough and software may just be the place to be for the last four months of the year. Old all-time highs are less than 10% away from current levels.
Other charts we shared with you this week were:
Monday, August 10: S&P 500 – This Is What the Bulls Have Been Waiting for
Monday, August 10: Builders FirstSource (BLDR) – Is Our Homebuilder Play at the Bottom?
Tuesday, August 11: Eldorado Gold (EGO) – Important Base for EGO as Gold Shines Bright Again
Wednesday, August 12: Boeing (BA) – Boeing Accelerates to New Status
Thursday, August 13: SiTime (SITM) – SiTime Clocks in Some Bullish Moves
The Coming Week
We will begin the second half of the current quarter at a slower pace compared to the last few weeks. Data points for July housing starts and industrial production will give us some things to look at for our positions in Builders FirstSource (BLDR) and Paccar (PCAR). But the economic data that we’ll be focusing our attention on will be the August Flash PMI report from S&P Global on Friday, August 21.
What it says primarily about inflation and how that stacks up to June and July could reshape how the market herd thinks about inflation pressures, but also the Fed standing pat at its September meeting. To the extent that Fed Chair Warsh looks to comment on inflation and monetary policy during his Jackson Hole address, the findings in the report would be one of the last indicators as he puts the finishing touches on those comments. We’ll also be examining the August flash data for its employment findings following the July Employment Report miss and those downward revisions it contained.
Here’s a closer look at the economic data coming at us next week:
U.S.
Monday, August 17
Empire Manufacturing Index (August) – 8:30 AM ET
NAHB Housing Market Index (August) – 10:00 AM ET
Tuesday, August 18
ADP Employment Change Report – (Weekly) 8:15 AM ET
Housing Starts & Building Permits (July) – 8:30 AM ET
Import/Export Prices – July (8:30 AM ET)
Industrial Production & Capacity Utilization (July) – 9:15 AM ET
Pending Home Sales (July) – 10:00 AM ET
Wednesday, August 19
MBA Mortgage Applications Index – (Weekly) 7:00 AM ET
EIA Crude Oil Inventories (Weekly) – 10:30 AM ET
Thursday, August 20
Initial & Continuing Jobless Claims (Weekly) – 8:30 AM ET
Philadelphia Fed Index (August) – 8:30 AM ET
EIA Natural Gas Inventories – (Weekly) 10:30 AM ET
Friday, August 21
S&P Global Flash PMI (August) – 9:45 AM ET
International
Monday, August 17
China: Industrial Production, Retail Sales, Fixed Asset Investments (July)
Tuesday, August 18
China: Foreign Direct Investment (July)
UK: Employment Change (June)
Eurozone: ZEW Economic Sentiment Index (August)
Wednesday, August 19
UK: Inflation Rate, Producer Price Index (July)
Eurozone: Inflation Rate, Consumer Price Index (July)
Thursday, August 20
Eurozone: Flash Labour Cost Index (Q2 2026)
Friday, August 21
Japan: S&P Global Flash PMI (August)
Eurozone: S&P Global Flash PMI, Flash Consumer Confidence (August)
UK: Retail Sales (July)
UK: S&P Global Flash PMI (August)
As you peruse the list of companies poised to report next week, you’ll notice a considerably smaller number. Don’t let that lull you into thinking it will be a relatively quiet week for earnings. As you’ll notice, there is a pronounced shift to retailers next week with Home Depot (HD), Lowe’s (LOW), Target (TGT), Ross Stores (ROS), Walmart (WMT), BJ’s Wholesale (BJ), and our own TJX (TJX) reporting.
We’ll be putting those reports and guidance through their paces as well as their insights about the consumer. Reason being, we will be quickly approaching the year-end holiday shopping season, which tends to represent around 20% of retailer revenue per data from the National Retail Federation. Part of our examination will be sizing those companies up against the findings of the July Retail Sales report, that showed retail only sales for the May to July period up 6.6% year over year. Results greater than that will signal share gains, while those that fall below point…
We’ll also be listening to homebuilder Toll Brothers (TOL) about the expected use of incentives in the second half of the year and what that means for margins. Should we hear comments about the growing use of structural building products from Toll as a means to drive down cost, they would be a nice point of affirmation for Builders FirstSource. And yes, Toll is a customer of Builder.
Here’s a closer look at the earnings reports coming at us next week:
Monday, August 17
Open: Fabrinet (FN)
Tuesday, August 18
Open: Baidu (BIDU), Home Depot (HD), Klarna (KLAR)
Close: La-Z-Boy (LZB), Toll Brothers (TOL)
Wednesday, August 19
Open: Analog Devices (ADI), Estee Lauder (EL), Kingsoft Cloud (KC), Lowe’s (LOW), Target (TGT), TJX (TJX)
Close: Coty (COTY), Nordson (NDSN), Webull (BULL)
Thursday, August 20
Open: Advance Auto (AAP), Alibaba (BABA), Walmart (WMT)
Close: Flower Foods (FLO), Ross Stores (ROST)
Friday, August 21
Open: BJ’s Wholesale (BJ), Buckle (BKE)
Portfolio Investor Resource Guide
Economic Data: Here’s a List of Links to the Key Economic Data We Closely Watch
Investing Terminology: 16 Key Terms Club Members Should Know
10-Ks: Want to Know About a Stock? Read the Company’s Reports
10-Qs: Unlock the Numbers and Key Information Behind Your Stock With the 10-Q
Income Statement –Our Cheat Sheet to Understanding This Financial Document
Balance Sheet, Cash Flow Statements, and Dividends – How to Know If a Company Is Off-Kilter? Read Its Balance Sheet
Valuation Metrics – Everyone Wants a Value. Here’s How Investors Can Find
Thematic Investing 101 Webinar
Like the Benefits of ETFs? Let’s Talk About Models
The Portfolio Ratings System
1 – Buy Now (BN): Stocks that look compelling to buy right now.
2 – Stockpile (SP): Positions we would add to on pullbacks or a successful test of technical support levels.
3 – Holding Pattern (HP): Stocks we are holding as we wait for a fresh catalyst to make our next move.
4 – Sell (S): Positions we intend to exit.