Resurgent Yields Drive Stocks Lower to Start the Week
Bond yields hit fresh multi-year highs, while oil whipsawed on Iran headlines, sending the S&P 500 into the red for September.
You've reached your free article limit
You've read 0 of 1 free Pro articles.
Quick Summary
- Stocks fell to start the week on a renewed jump in Treasury yields to multi-year highs while oil whipsawed on U.S.–Iran headlines and Fed rate hike bets rose to fresh highs as well.
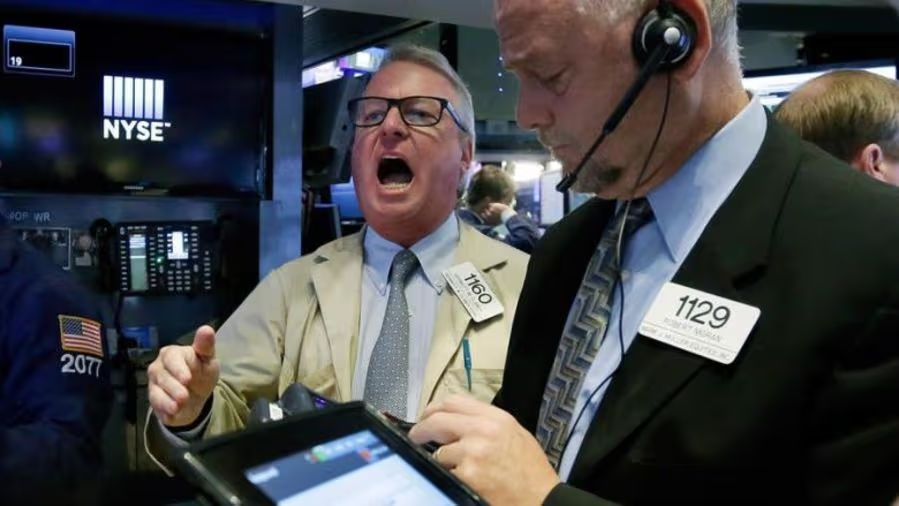
- Indices opened lower under pressure from the reacceleration in yields. They would bounce off their midday lows on U.S.–Iran sanctions-relief headlines, but never made it back to unchanged and would fade in the afternoon trade. The Nasdaq would lead to the downside -0.9%, followed by the S&P 500 -0.8% and the Dow Jones Industrial Average and Russell 2000 both -0.7%. The losses brought the S&P back to flat levels for the month.
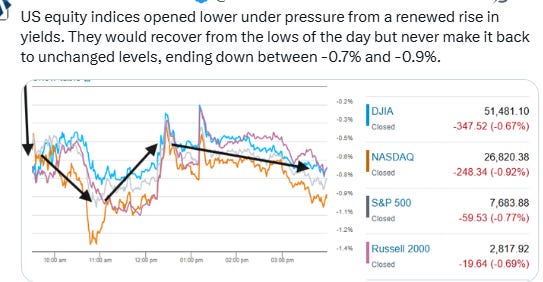
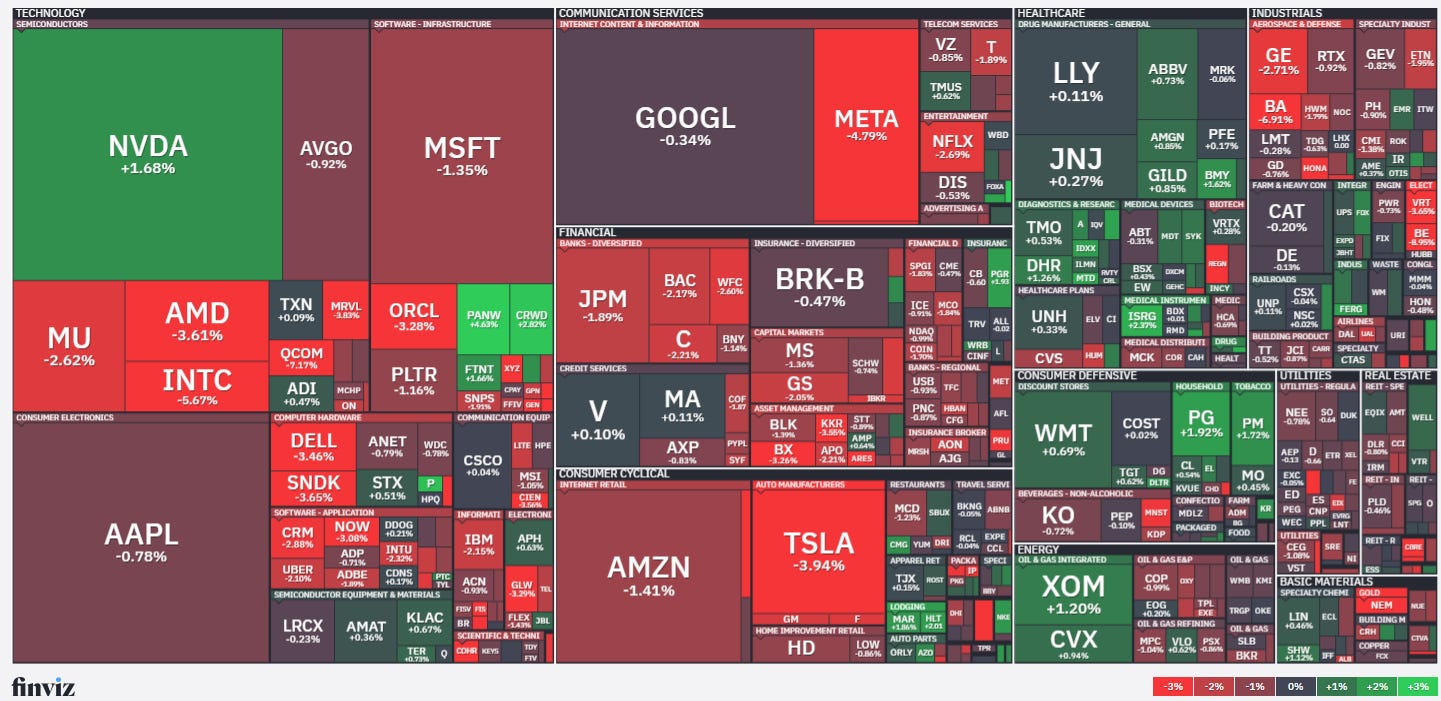
- Breadth was weak: just 3 of 11 sectors were higher and none up more than 0.4% — defensives Staples (+0.4%) and Health Care (+0.3%) plus Energy (+0.2%). In contrast four sectors fell more than 1% (Communications, Consumer Discretionary, Financials, and Industrials); super-heavyweight Tech was -0.7% as the AI trade faltered with Meta Platforms (META) falling 4% as did Advanced Micro Devices (AMD) while Micron Technology (MU) was down 2%.
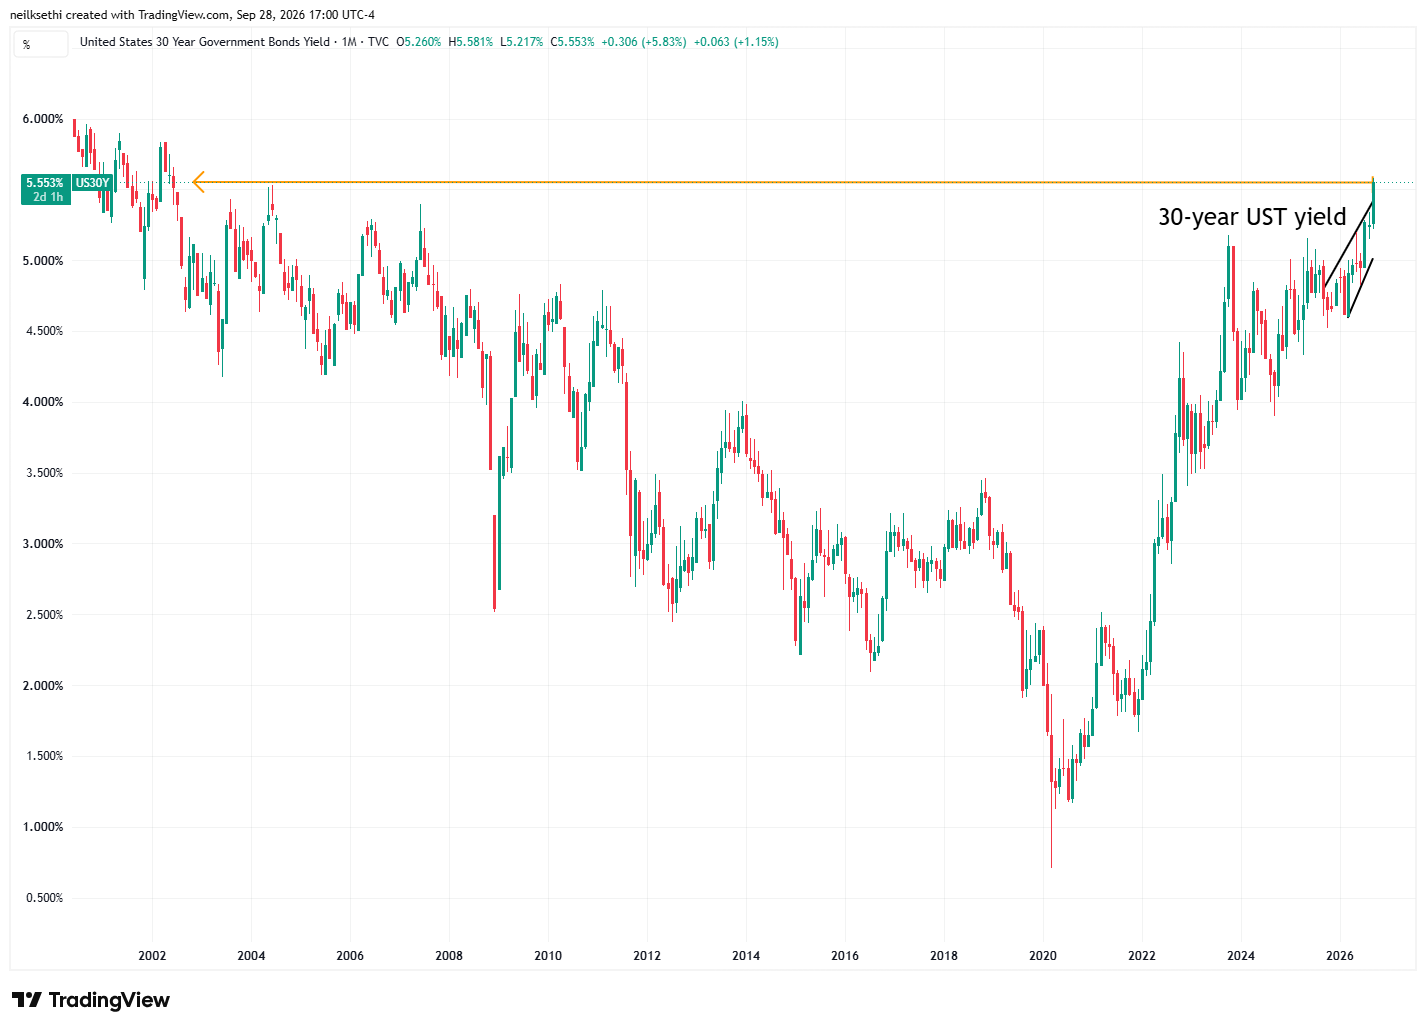
- The 10-year topped 5.2%, its highest since 2007, the 30-year cleared 5.5% to the highest since 2002, and the 2-year rose ~8bp to ~4.93%, the highest since 2024, with money markets now fully pricing four rate hikes by the end of next year.
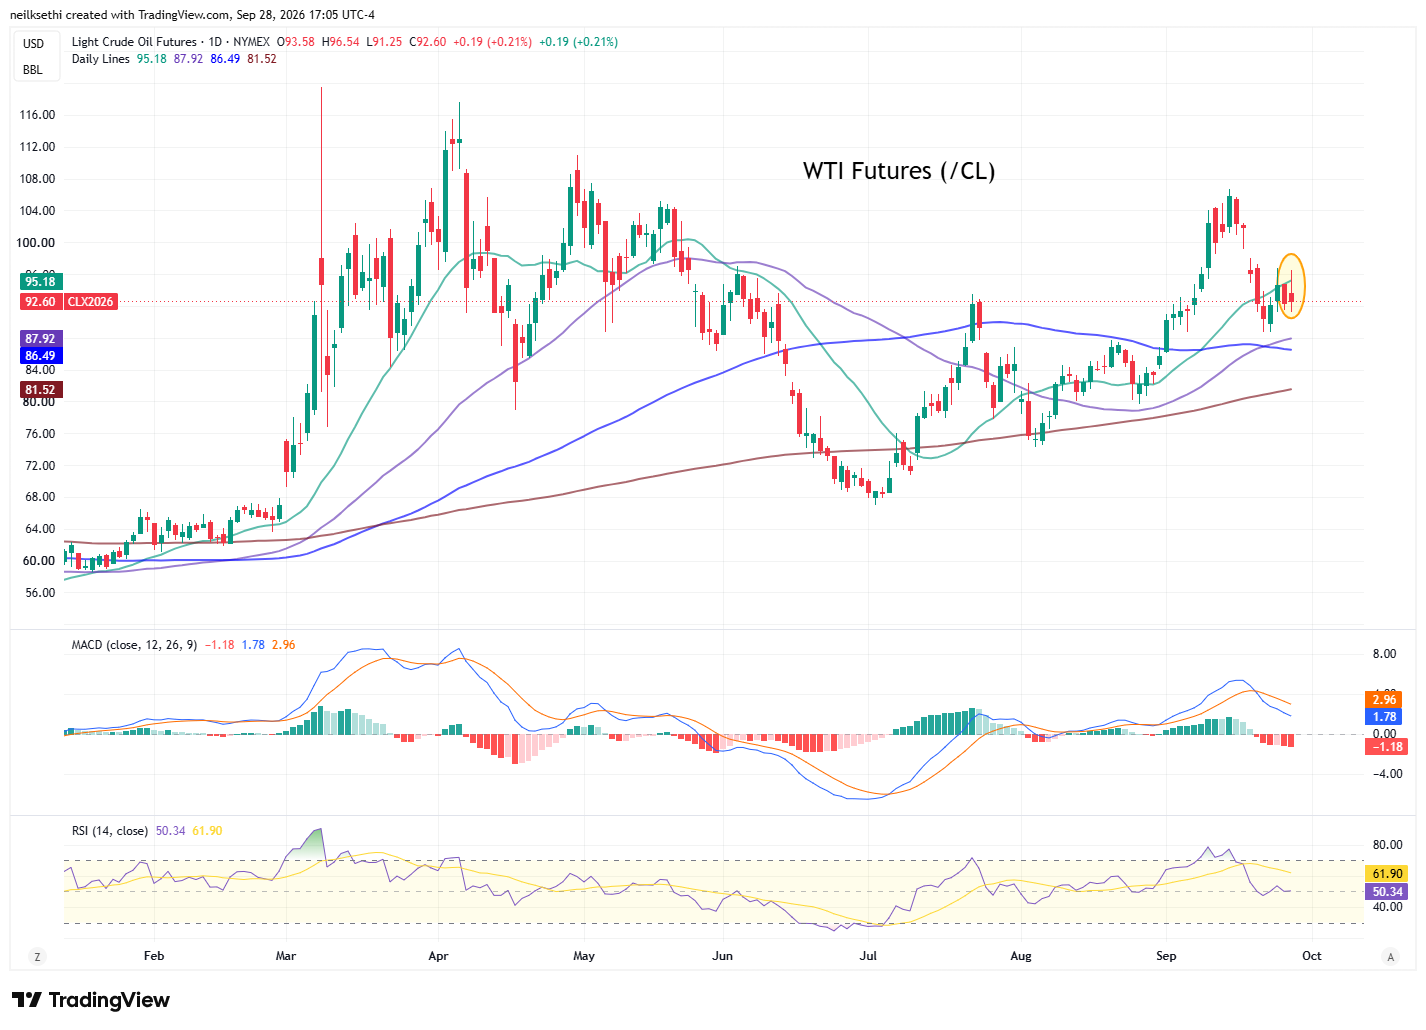
- Oil round-tripped — WTI spiked above $95 after Tehran said it’s sticking to a proposal President Trump has rejected, then reversed to settle roughly flat near $92 (Brent ~$105) after Trump said the US and Iran held talks today, through mediators, and said the US is willing to provide sanctions relief and release frozen funds for “concrete progress” on a nuclear deal, according to a CNN report. A later Bloomberg story said Iran is pessimistic on a deal before US midterm elections in November.
Market Commentary
Equities:
- “President Trump knocking back Iran’s offer for diplomacy is driving a renewed rise in oil prices and is weighing on USTs,” said Prashant Newnaha, senior Asia-Pacific rates strategist at TD Securities in Singapore. The Middle East gridlock “is likely to remain the market’s focus until PCE, ISM and payrolls data later in the week.”
- Markets are getting closer to entering a “new normal,” according to Oppenheimer. “In our view the recent volatility in oil prices and interest rates suggests that markets are on a path toward a new normal rather than one of heightened volatility and significant downside risk,” analyst John Stoltzfus said Monday in a note to clients.
- “The broader market hasn’t been able to gain much traction because of rising yields and oil prices,” said Chris Larkin at E*Trade from Morgan Stanley. “And with the Fed focused on the inflation side of its mandate, unless this week’s labor market data is a major surprise, it will likely play second fiddle to interest rates and energy.”
- Those yields have “come back up meaningfully today, and that’s causing an understandable weakness in the tape,” Justin Bergner, portfolio manager at Gabelli Funds, told CNBC. “The competition for capital with AI hyperscaler spending … also pressures the consumer with higher rates, so it kind of makes the market more one-sided than it already is.”
- “The focus will be on the bond market as earnings season is still a couple of weeks away,” said Matt Maley at Miller Tabak. “So, oil prices and this week’s plethora of economic data will be the focus.”
- “Our view remains that the US economy is resilient enough to absorb the impact of modestly tighter monetary policy,” said Ulrike Hoffmann-Burchardi at UBS Chief Investment Office.
- “People are trading the Iran war headlines for yields to rally or yields to sell off,” said Brij Khurana, a portfolio manager at Wellington Management. “They might be missing the bigger picture, which is that with commodities prices this high for this long, it is going to start to create negative real income and demand destruction.”
Bonds:
- “Seeing the two- and 10-year curve invert or flatten dramatically calls into question the idea that the economy is very strong and that is part of what’s being priced into the bond market,” said Zach Griffiths, head of investment-grade and macro strategy at the research firm CreditSights.
- “The rapid rise in 2-year government note yields worldwide signals that major central banks need to raise their policy rates further in response to the inflationary impact of higher-for-longer oil prices resulting from the recent re-escalation of the Middle East war,” wrote Ed Yardeni, president of Yardeni Research. “Unfortunately, these higher rates also exacerbate the outlook for large government deficits worldwide.”
- Treasury yields are likely to stay elevated even if the Iran war is settled and oil prices come down, economist Mohamed El-Erian said Monday. The chief economic advisor at Allianz said in a CNBC interview that while the energy spike has exacerbated the move in yields, a larger imbalance between supply and demand will remain. “The fundamental issue I want to stress [is] that we would be having this yield discussion, even if oil prices were lower,” he said on “Squawk Box.” “We have an imbalance in longer-term demand for bonds and longer-term supply of bonds.”
- “While there have been episodes when monetary policy and/or economic data overshadowed the fluctuations in oil prices, it is clear that the potential fallout on the global economy from the war with Iran remains a key driver of the macro narrative,” said Ian Lyngen, head of US rates strategy at BMO Capital Markets.
Stock and Sector Breakdown:
Sector breadth weakened to 3 of 11 sectors higher Monday comprised of two defensives (Staples and Health Care) plus Energy, none up more than +0.4%. On the other side every sector was down by -0.4% or more with four down over 1% (Communications, Consumer Discretionary, Financials, and Industrials). Super-heavyweight Tech was -0.7%.
Mega-cap stocks also remained under pressure, leaving the Vanguard Mega Cap Growth ETF (MGK) down -0.9%, with Meta Platforms (META) -4.8% a particular laggard, giving back some of last week’s double-digit advance. In related news, MongoDB (MDB) -18.5% plunged after President and CEO Chirantan “CJ” Desai stepped down effective immediately to take a senior role at Meta, marking the company’s second CEO transition in less than a year just ahead of its September 29 Investor Day. Former CEO Dev Ittycheria was named interim president and CEO as the company begins an external search, while MDB reaffirmed its Q3 and FY27 guidance.
In terms of the S&P 500, utility provider Bloom Energy (BE) -9.0% led to the downside due to concerns surrounding Oracle’s Project Jupiter data center development in New Mexico, where Bloom technology is expected to provide electricity.
Semiconductor stocks were another source of weakness, with the PHLX Semiconductor Index (SOX) falling -1.6%. That was despite NVIDIA (NVDA) finishing +1.7% after increasing its share repurchase authorization by a record $150 billion to $235 billion and launching its Open Agent Safety Platform designed to prevent AI breaches.
NIKE (NKE) +1.7%, meanwhile, displayed notable relative strength ahead of its fiscal Q1 report Thursday afternoon despite HSBC, Deutsche Bank, and Piper Sandler all cutting price targets. The gain provided a reprieve from a difficult year for the stock, which remains down roughly 43% year-to-date amid an uneven turnaround marked by weakness in Greater China, discounting, competitive pressures, and questions surrounding the company’s product pipeline and direct-to-consumer strategy.
Palo Alto Networks (PANW) +4.6% was the top-performing component of the S&P 500 after it received a higher price target from BTIG after five-star analyst Gray Powell came away encouraged from a meeting with management. It was one of only two components (along with Paramount Skydance (PSKY) +3.2%) up over 3%. PSKY was higher after a Reuters report that Paramount planned to move its Class B shares to the NYSE starting on October 6th.
After the bell, Advanced Micro Devices (AMD) announced it had agreed to acquire World Labs for $8.2 billion, gaining an artificial intelligence startup founded by industry pioneer and researcher Fei-Fei Li.
[Note: chart uses futures prices.]
The number of large SPX winners (up over 3%) dropped to just two Monday, while the number of large losers (down over 3%) rose to ~40. Both of these metrics have remained very subdued since the start of August rarely getting above 50 and only once above 100.
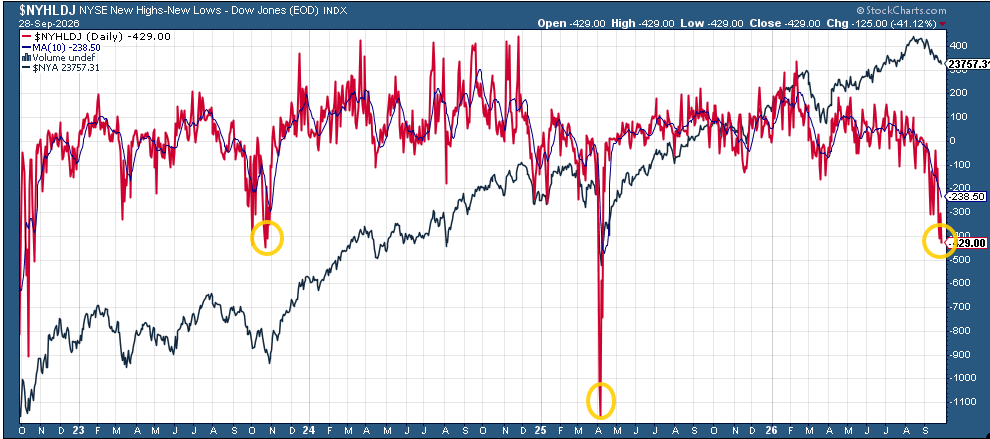
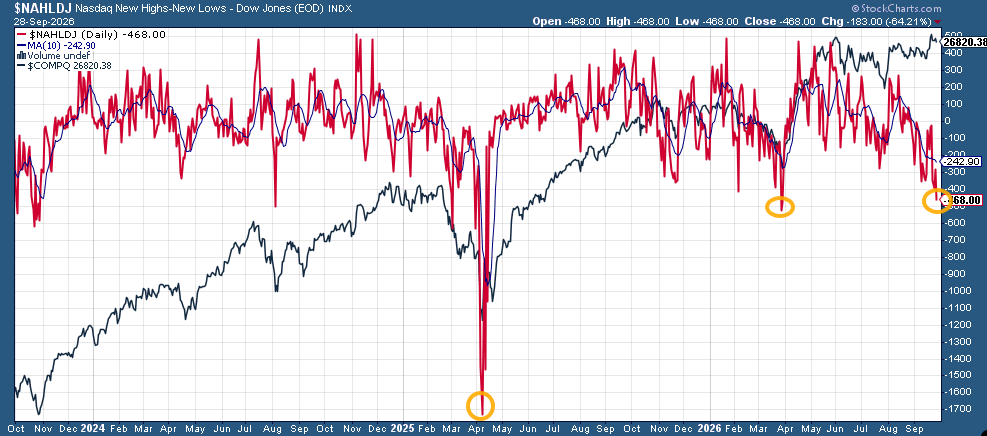
Other breadth metrics were similarly weak. In particular, new 52-week highs vs lows dropped to -426 on the NYSE and -451 on the Nasdaq. The former, outside of liberation day, is the least since October 2023, and the latter the least since April (and before that liberation day).
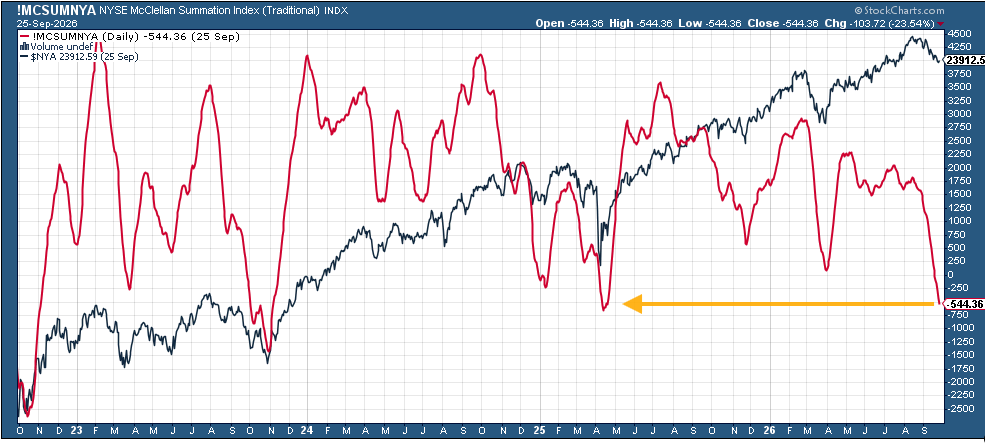
On the NYSE McClellan Summation Index is just about to the post-liberation day lows.
Some other stock-specific commentary from TheStreet Pro since Friday:
- Bob Lang –
- Stephen Guilfoyle –
- James “Rev Shark” DePorre – I Usually Trade Risky Small-Caps. Here’s Why I’m Also in Amazon, SpaceX
- Bret Jensen – How to Join Michael Burry’s Birkenstock Bet
A Look At The Charts
Note on all charts the colored lines are moving averages (the average price over the lookback period — days on the daily charts, weeks on the weekly charts):
20 = green
50 = purple
100 = blue
200 = brownException is monthly charts where blue is 10-month moving average and brown is 20-month moving average.
MACD = Moving average convergence/divergence line, a measure of momentum that compares longer term and shorter term momentum to gauge if a move is strengthening or weakening. This is probably my favorite individual indicator.
RSI = Relative Strength Index (basically what it sounds like) = measures the strength of the move comparing gains to losses over the given lookback window (I use the standard 14 periods).
SPX ended unchanged after having fallen back into its downtrend channel earlier in the session. The daily MACD remains in a “go long” positioning, and the RSI over 50.
Nasdaq Composite tested its former resistance but it held and has a stronger chart.
The Nasdaq-100 (QQQ) closed slightly higher. Daily MACD and RSI also positive here.
The Russell 2000 (RUT) I said three weeks ago was “much more problematic,” and that remains the case as it fell to the lowest close since June 10th and also broke last Wednesday’s intraday low. Its daily MACD remains in “go short” positioning, and the RSI back under 40. Getting closer to that test of the 200-DMA I mentioned a week ago.
The equal-weighted SPX I said last Wednesday is “back to concerning.” I mentioned early last week “I did take off most of my holdings in (RSP) for now. I’ll be looking for a tradeable bottom to form.” Like the RUT it broke last Wednesday’s intraday low. Daily MACD and RSI are still weak. Has some room to get there, but that uptrend line/200-DMA area might be the place for a buy.
Treasury yields rose again across the curve:
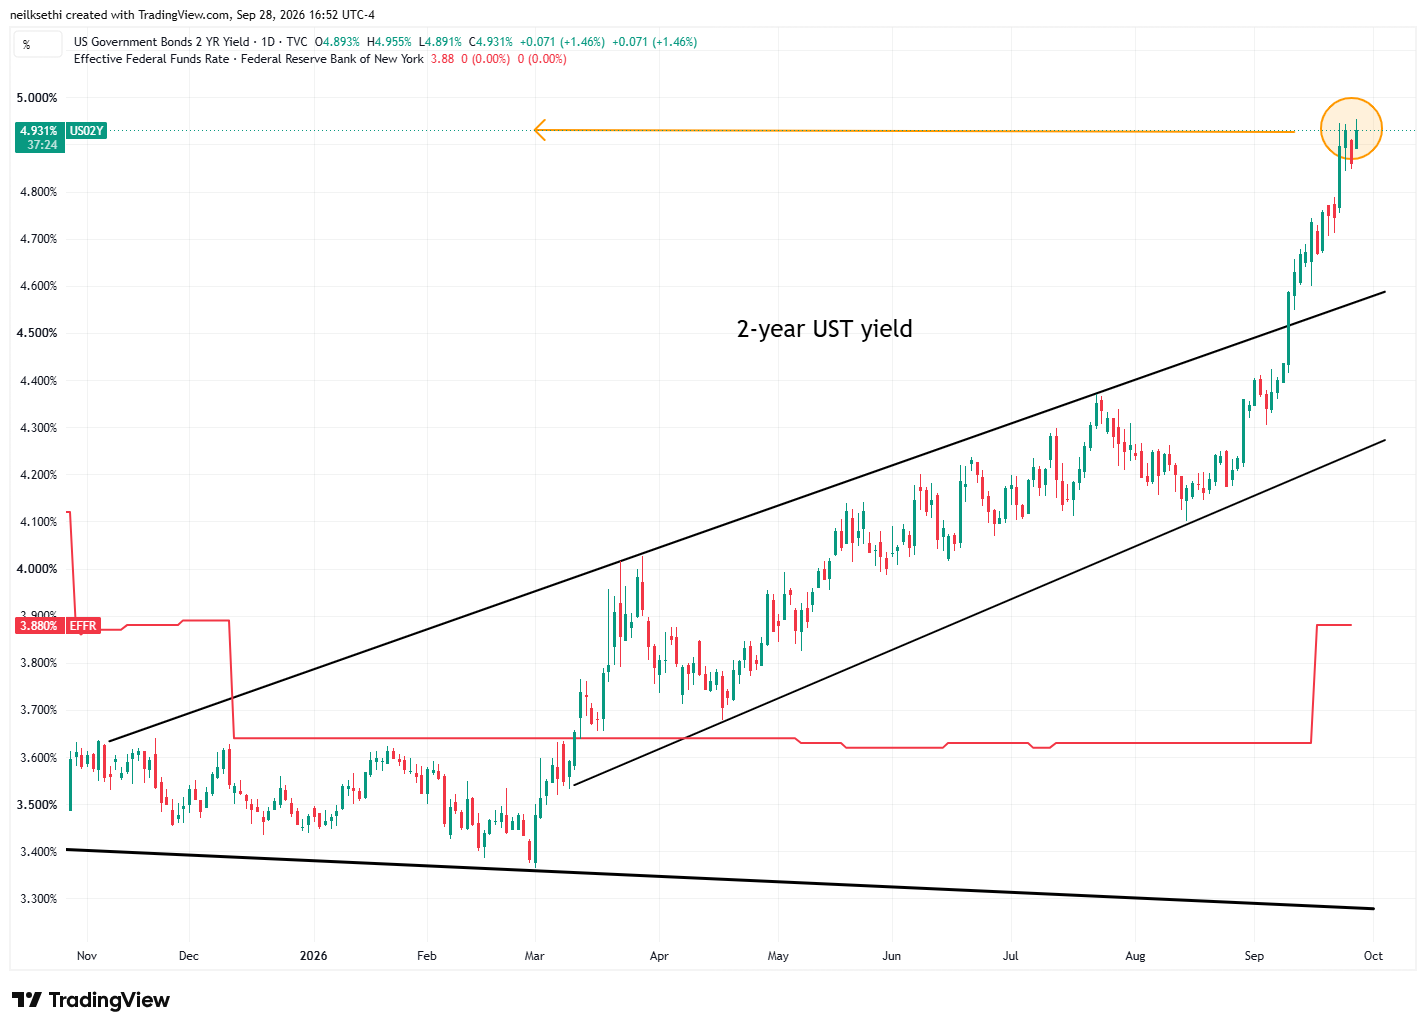
The 2-year Treasury rose 7 basis points exactly matching Thursday as the highest close since May 2024 (including after-hours).
It is ~114 basis points above the Effective Fed Funds rate, so still screaming for (a few) more rate hikes.
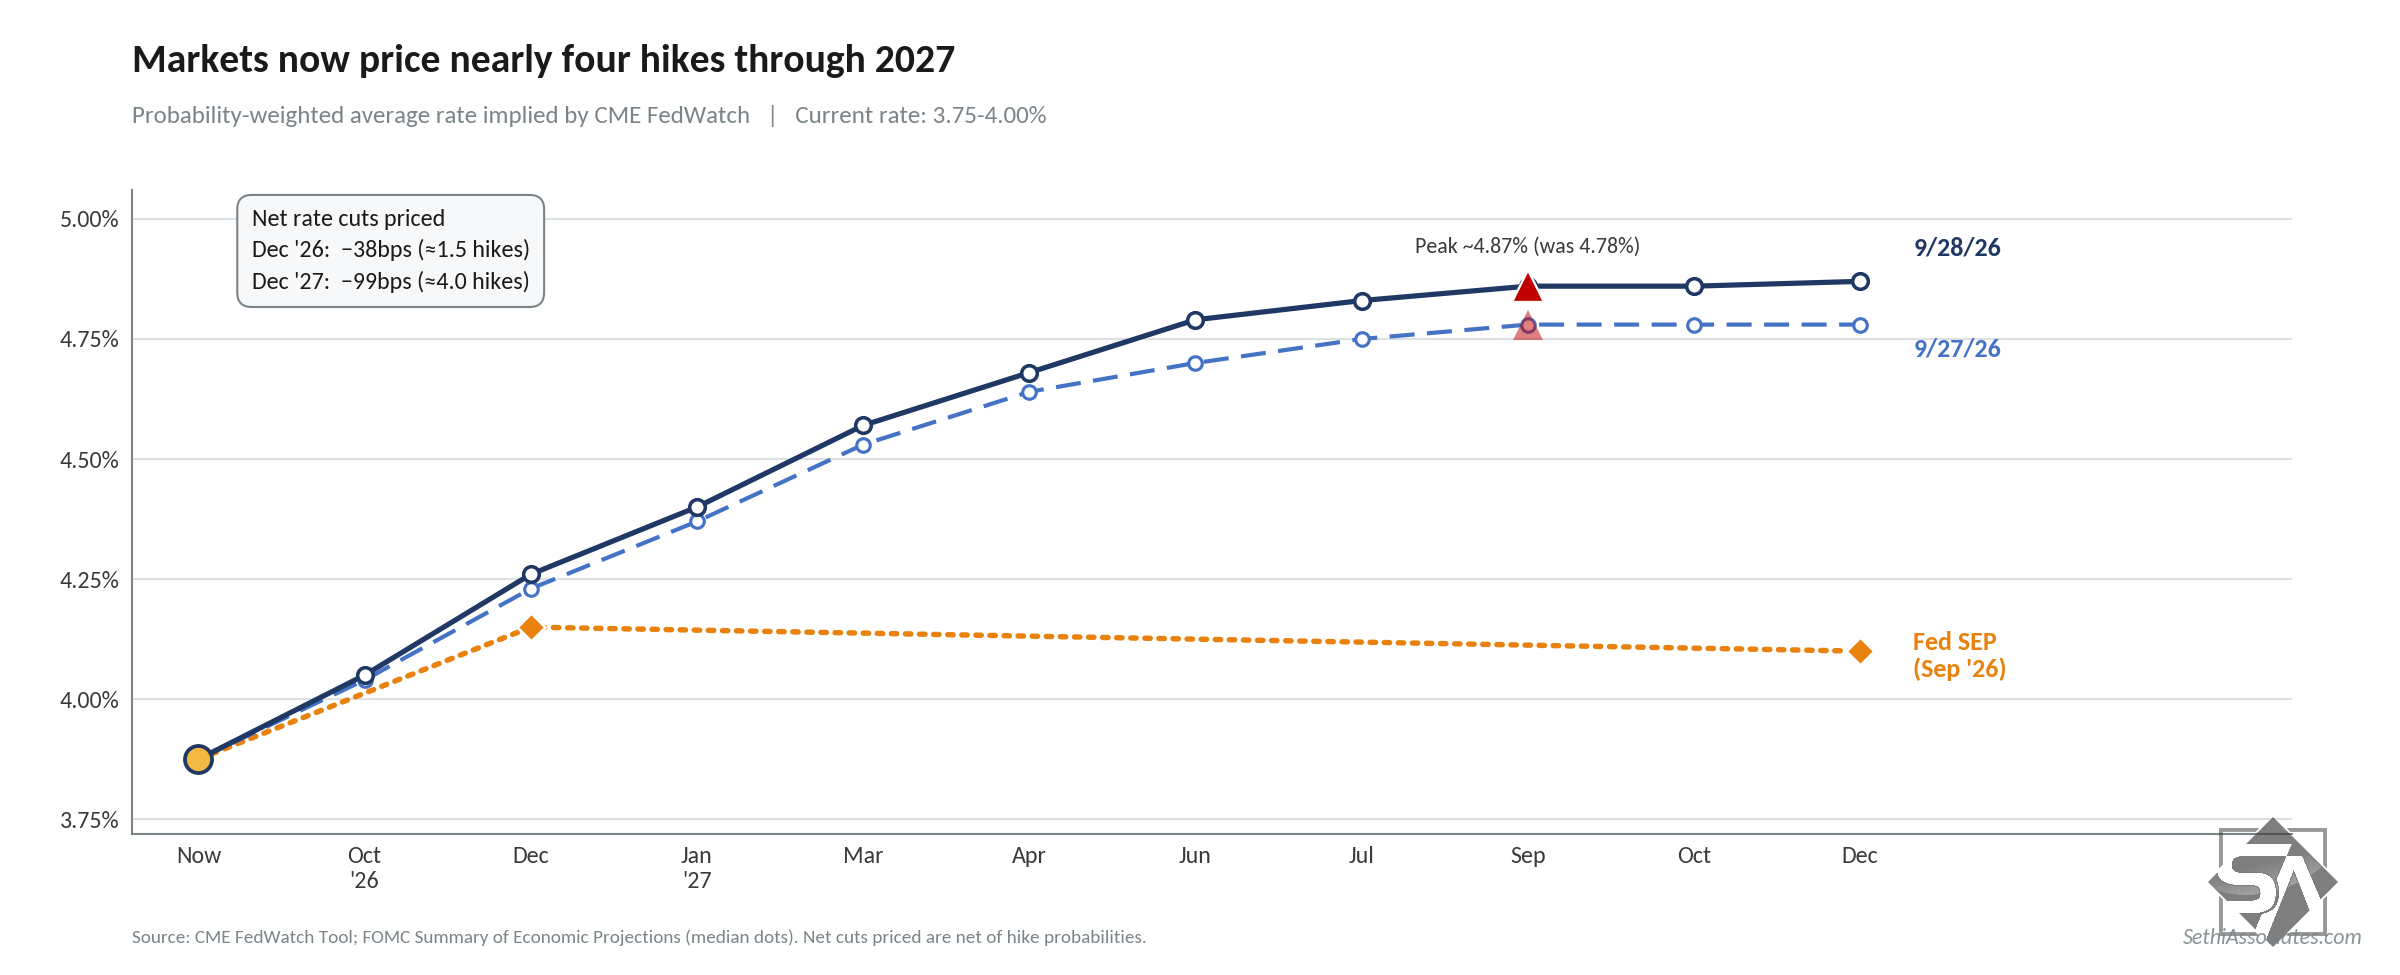
In that regard, Fed fund futures from CME’s Fedwatch tool also pushed back up to new highs at least as far as total hikes is concerned with the chances for an October hike staying at 70% and two hikes this year at 58%, while now 99 total basis points in hikes are priced through YE 2027.
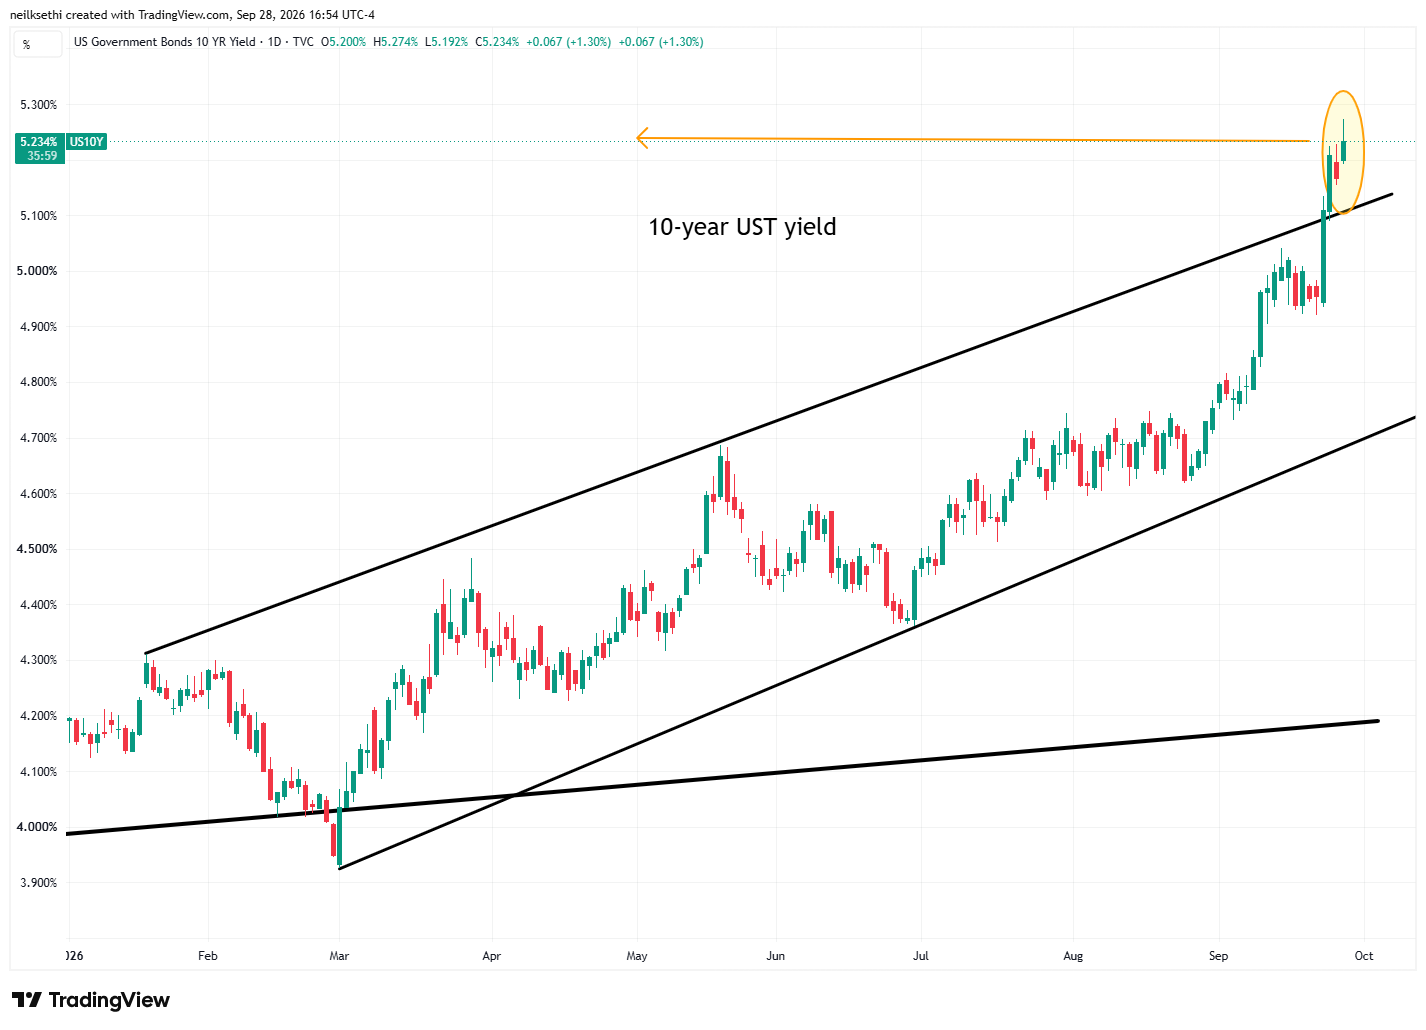
10-year yields up 7 basis points to 5.23% including the after-hours session, the highest close since June 2007.
30-year yields up 6 basis points to 5.55%, the highest close since May 2002.
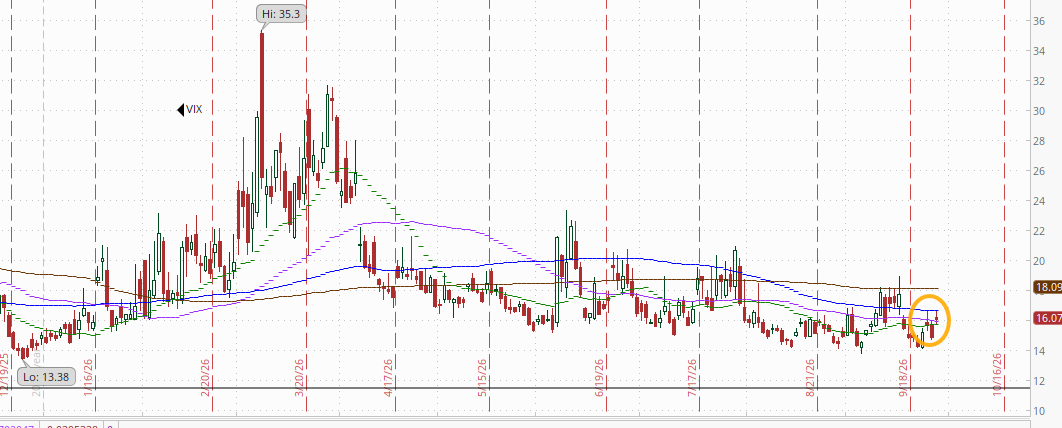
VIX remains remarkably quiescent at 16.1. That’s consistent with ~1.01% average daily moves in the SPX over the next 30 days.
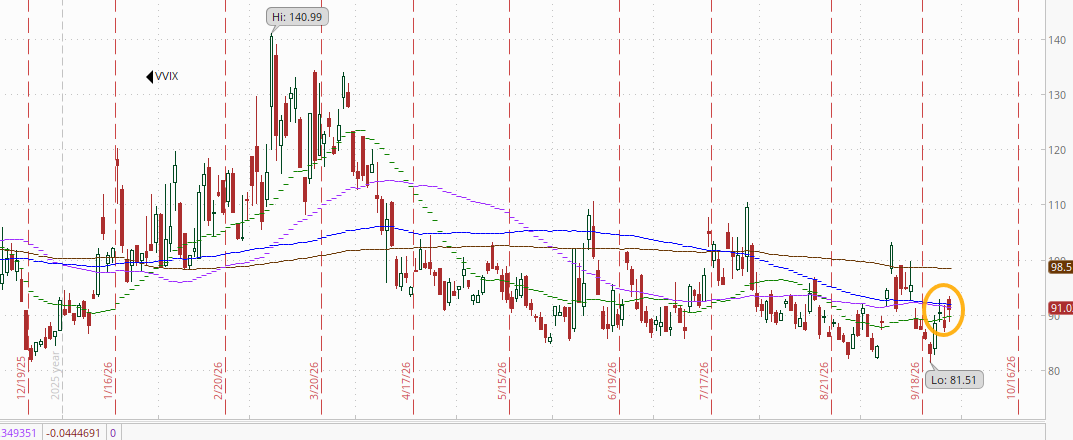
The VVIX (VIX of the VIX) up to 91.0, also remaining very subdued.
The current level is consistent with “moderate” daily moves in the VIX over the next 30 days (historically, normal is 80-100). Above 100 is the level flagged by Charlie McElligott as indicating higher stress.
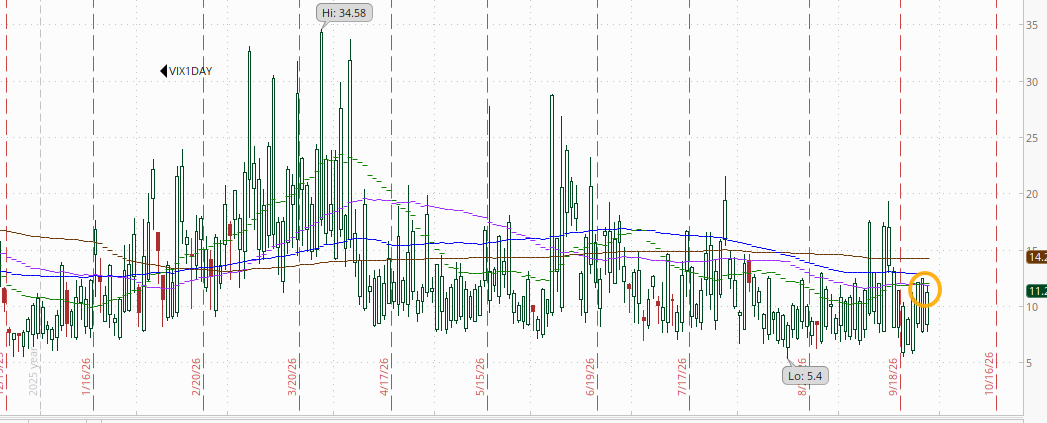
With the weekend past, the 1-day VIX eased to 11.3. The current reading isconsistent with a move of 0.72% in the SPX next session.
WTI futures (/CL) little changed in the middle of their range since the start of the Iran conflict.
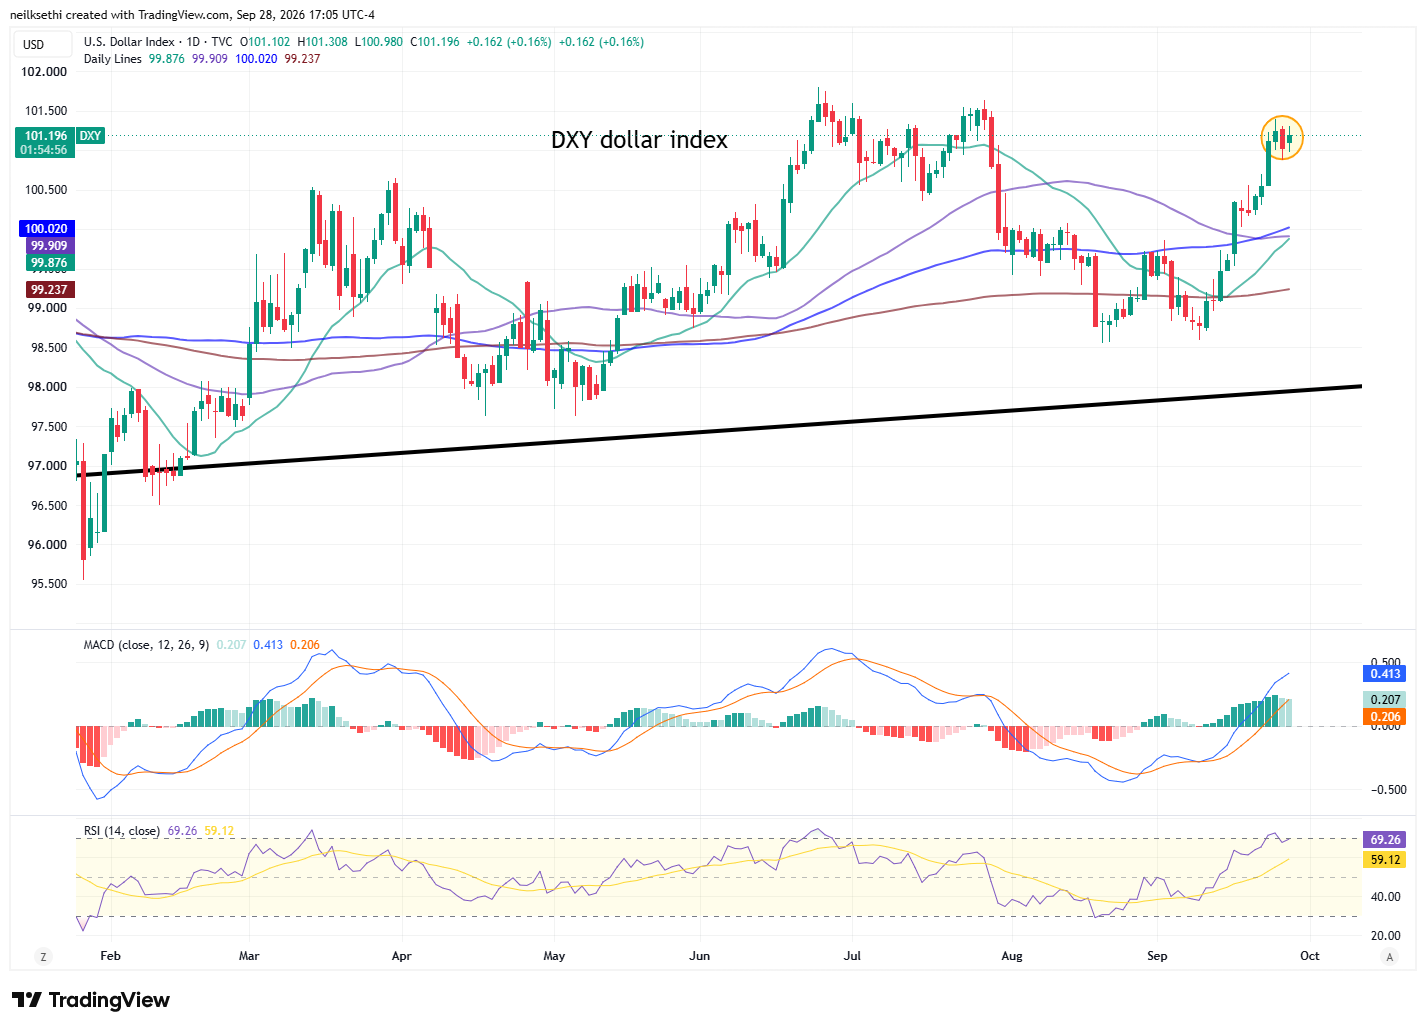
The DXY dollar index (which is fixed weighted with a heavy (57%) weighting vs the euro), traded sideways for a second session remaining not far from the highs of the year.
As I mentioned two weeks ago “The daily MACD remains positive and the RSI is above 60 so it continues to have strong technical support.”
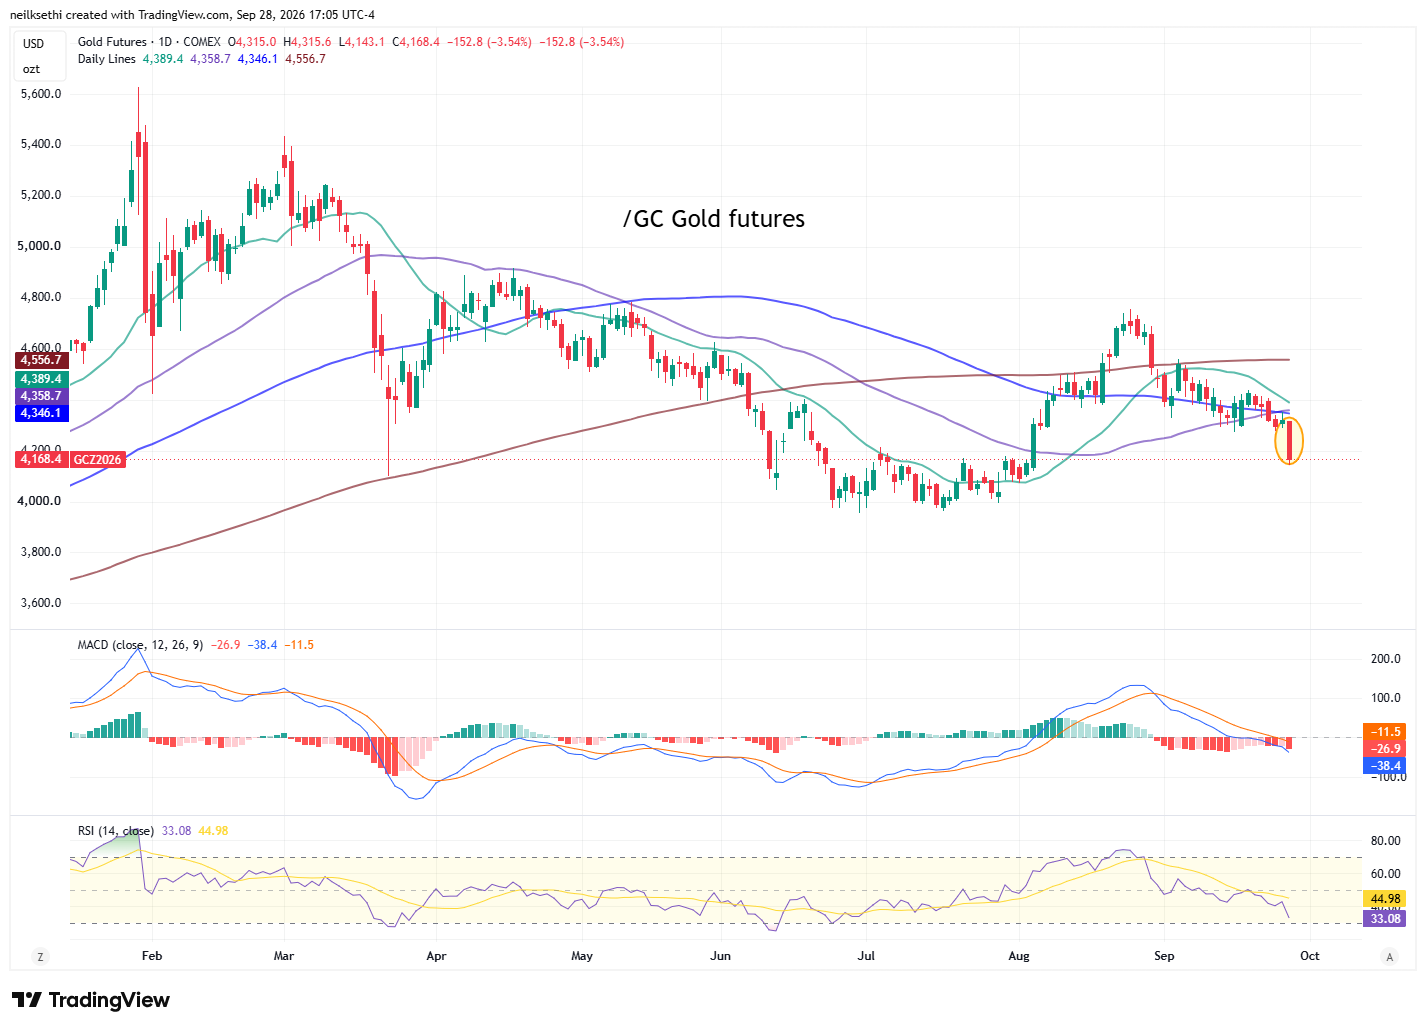
Gold futures (/GC) I said last week needed to hold the prior week’s intraday lows, and it failed to do that today bringing out the sellers. It closed -3.5%, its worst day since June 10th, to the lowest close since August 4th. The daily MACD remains negative and the RSI is under 50.
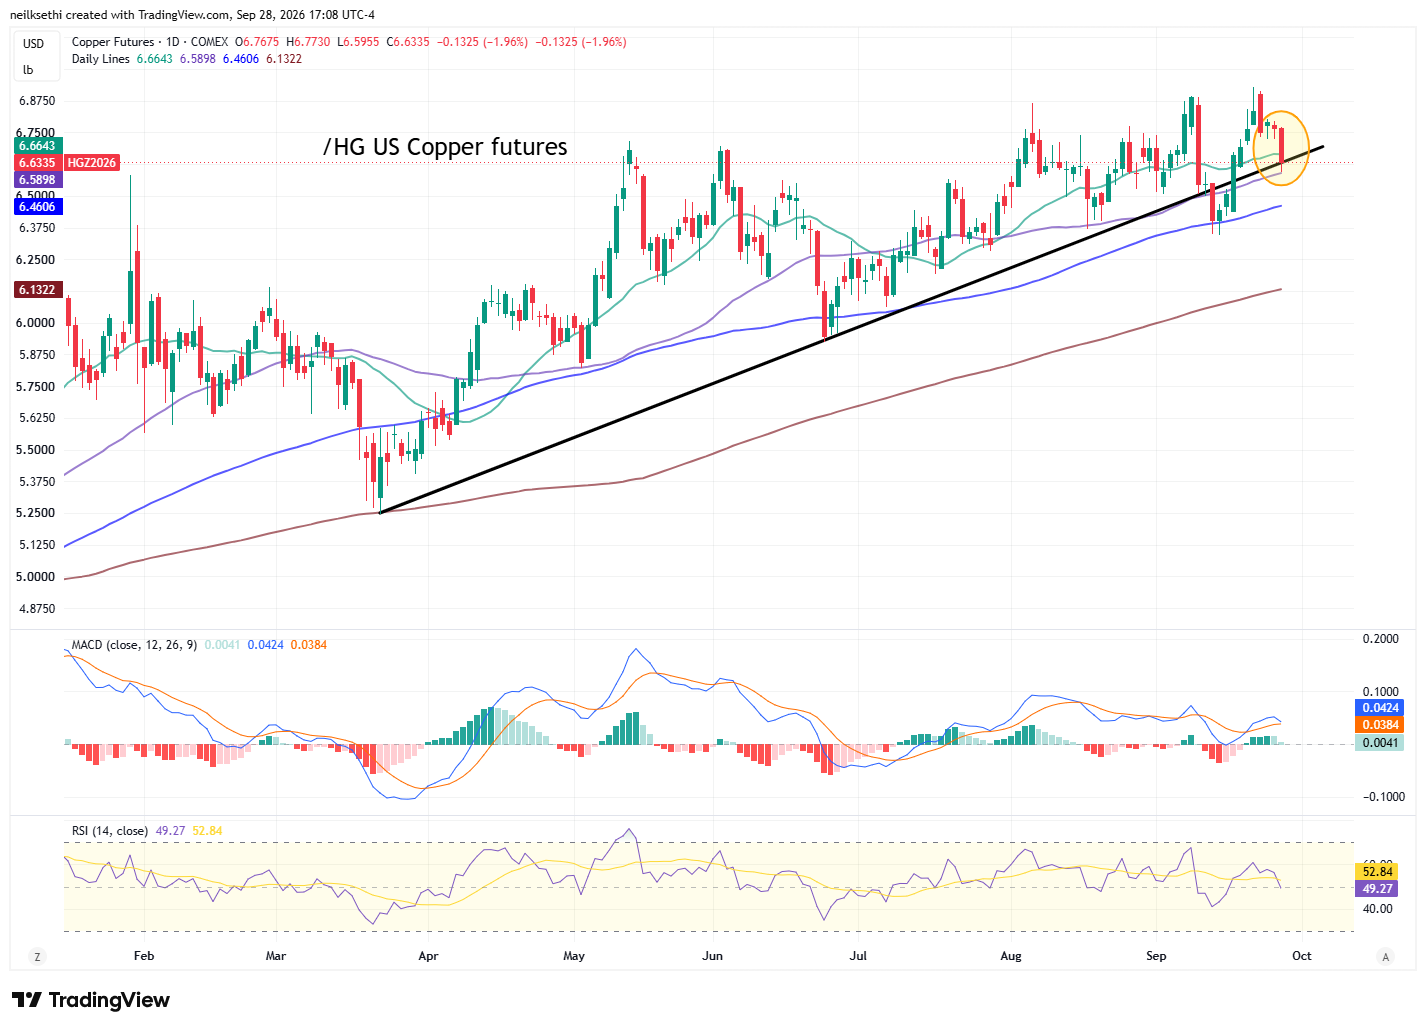
US copper futures (/HG) dropped -2% but were able to find support at the 50-DMA. Daily technicals have now softened to neutral.
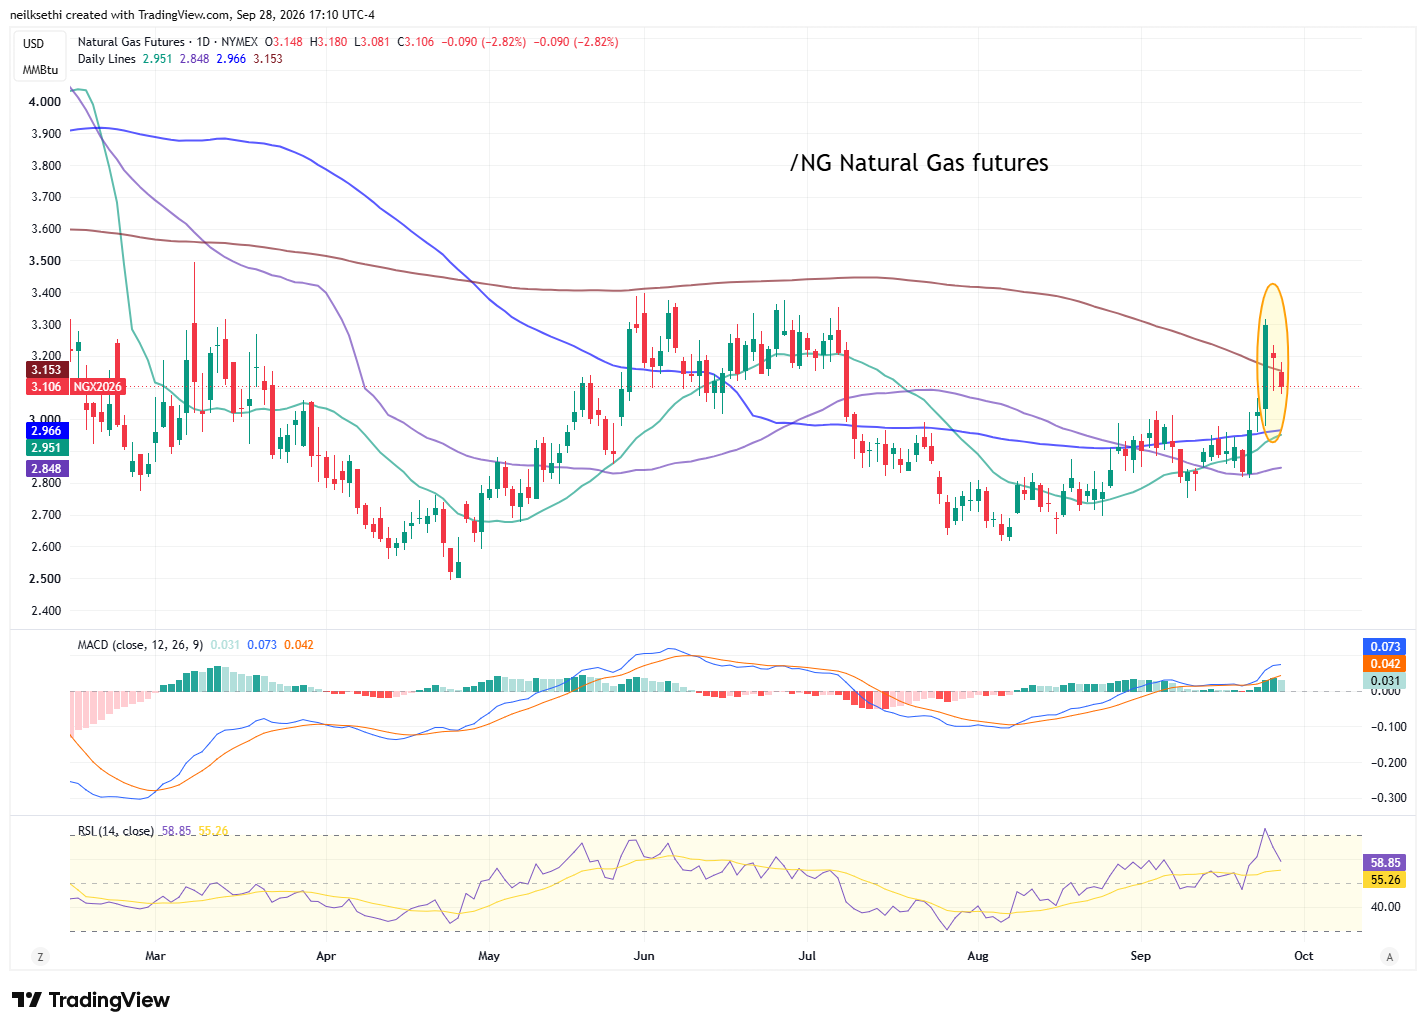
US natural gas futures (/NG) fell back for a second day after the 9.1% rip higher Thursday. I had mentioned then “I’ve got a tight stop,” so I was out on Friday. It’s now back under the 200-DMA so that is starting to look like it was just a big short-covering rally.
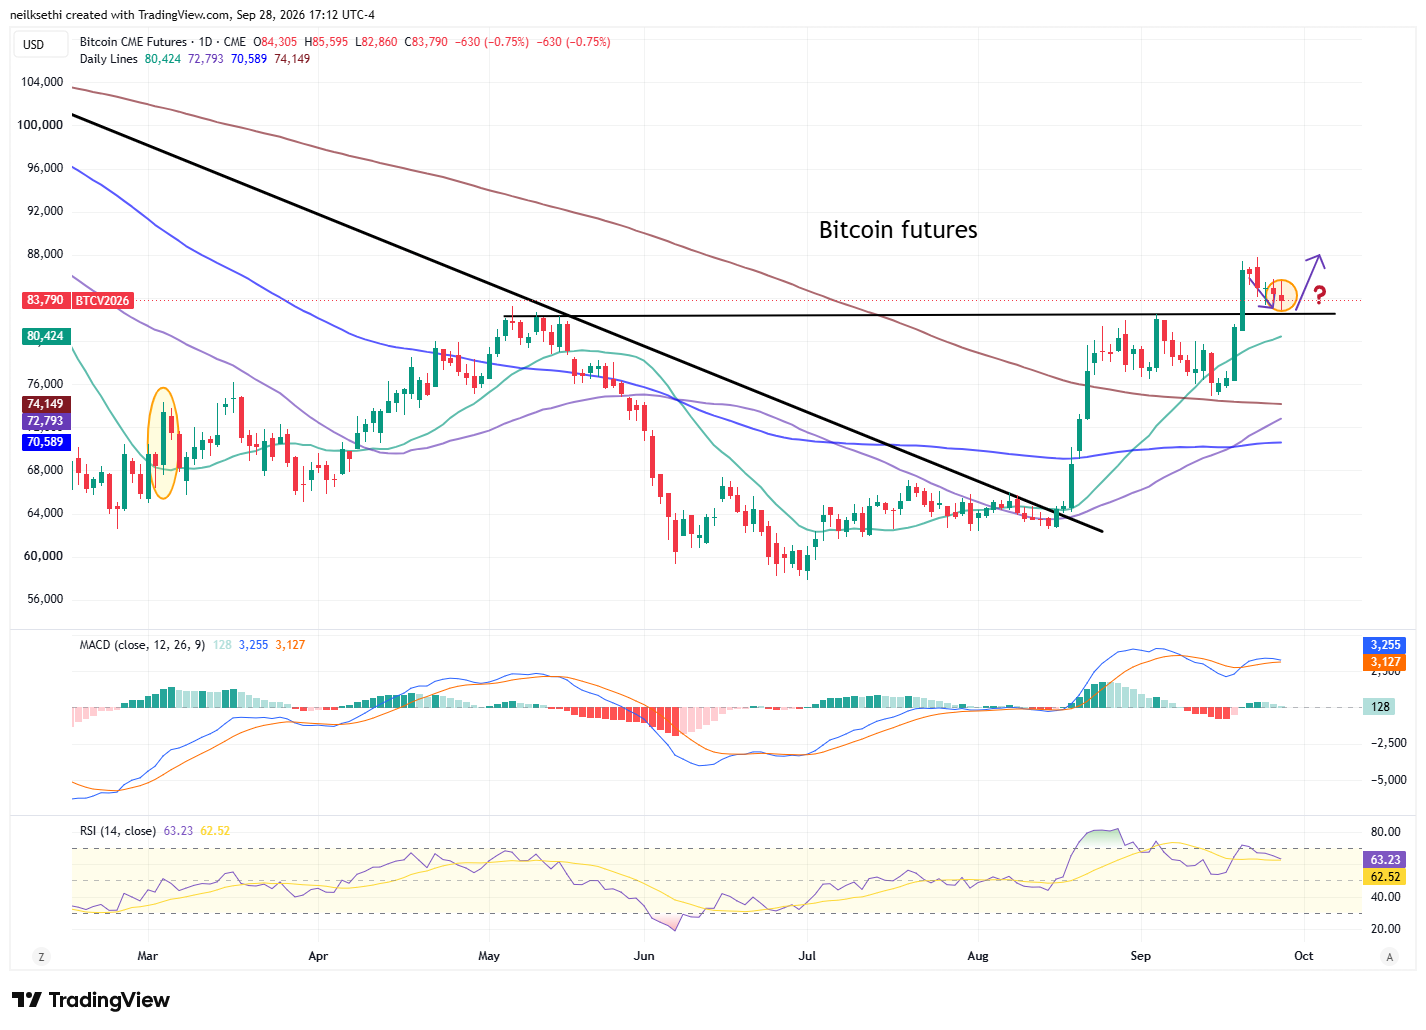
Bitcoin futures eased back for a fifth session (the longest since June 5th), continuing to follow the“natural path” (for bulls) I laid out on Wednesday (in purple). It’s now at the point though it needs to bounce. A break of the $82,000 level, and I will be selling. Daily MACD and RSI remain positive for now.
More From TheStreet Pro:
- Bob Lang – Charting the Markets: Leaving an Ugly September Behind
- Stephen Guilfoyle – As Hormuz Deal Collapses, Hope Fades on Market… And So Does Rationality
- Bob Byrne – Who Gets Paid When You Ask AI a Question?
- James “Rev Shark” DePorre –
- Bret Jensen – The AI End Game Appears to Be Growing Near
- Peter Tchir – Taking Stock of China Meeting, Treasuries and Energy
And From Me If You Missed It:
- Amazon Faces 1 Big Obstacle Before Becoming a Buy
- One Thing Republicans and Democrats Agree On: The Economic Outlook Has Declined
- Flat Durable Goods Orders Mask Robust Business CapEx
Miscellaneous:
Wrap-Up – Another Wednesday
I said last week in Wednesday’s wrap-up:
The gravitational pull of surging interest rates was too powerful for even the renewed Tech trade to escape Wednesday. I had mentioned in prior weeks that it would be difficult for stocks to succeed if rates were going to continue ratcheting higher, let alone a jump like we saw today.
I had hoped that we had seen the highs, at least in the short term, but clearly not. We are unfortunately now apparently in a “good news is bad news” (and vice versa) cycle, and given my positive outlook on the economy, I’m not sure how much bad news we’re going to get… So it seems we’ll just have to wait for this most recent leg in yields to run its course. We’re already above levels that I thought would cap things so I’m taking the other side of this trade, but it could be some time before that pays off the way things are going.
This hasn’t dented my longer-term optimism though, and the pullback is creating what will prove to be bargains in many stocks.
And today was a reprise of Wednesday’s action. A push higher in interest rates sucking the life out of even the previously strong Tech trade. As to Tech that was a one-day blip and the trade came back Thursday and Friday. Will we see something similar this time as well?
As to the non-Tech trade, I will continue with my now well-worn statement that we have gotten to a place where things are very stretched in terms of the rout in bonds and non-Tech areas of the market. As I have noted, though, these things can continue well beyond where they “should,” so your guess is as good as mine as to when we see at least a short-term reversal. It will come at some point, so all we can do in the meantime is wait and try to stick with what’s working.
Let’s see what we get tomorrow.
The Day Ahead – The Week Starts To Pick Up
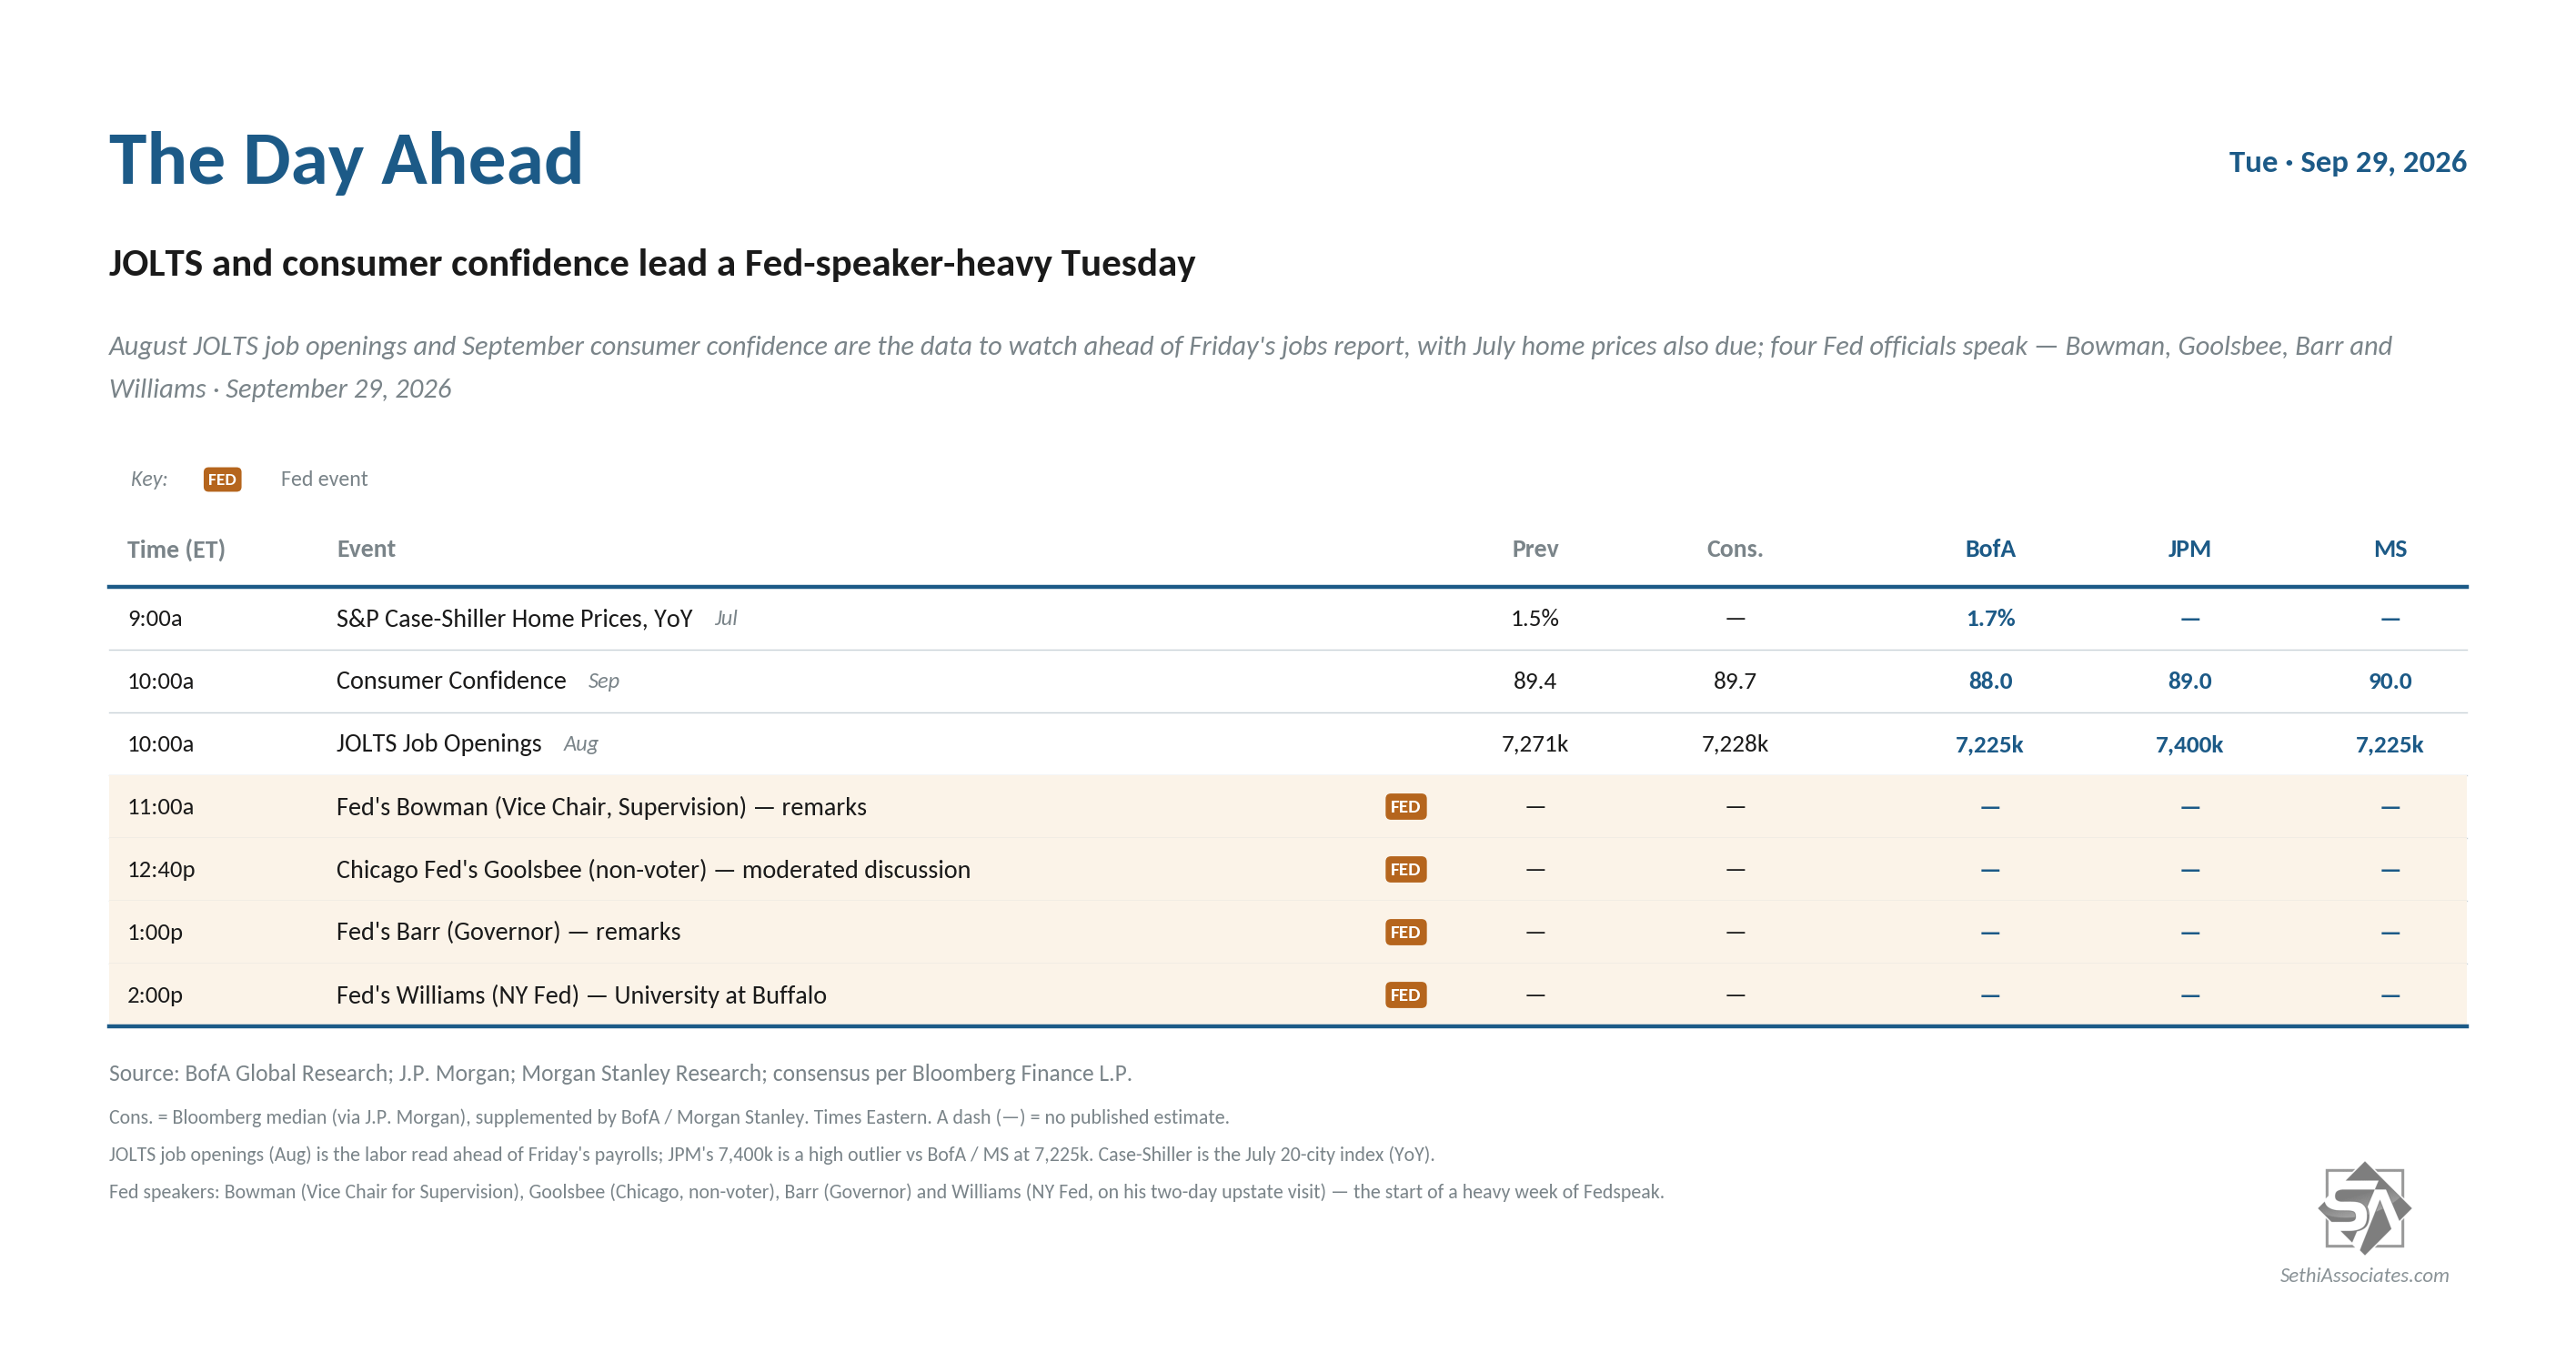
US economic data picks up with August JOLTS, September Conference Board consumer confidence, and July repeat home sale indices (S&P/FHFA). We’ll also get a regional Fed survey (no ADP with the monthly report Wednesday).
Fed speakers continue and we’ll again hear from Governors Bowman and Barr and regional presidents Williams and Goolsbee who we’ve heard from at least once in the past week (some several times). But the new one is Governor Waller, who I’m very interested in hearing from given his leading voice and considering he indicated ahead of the September FOMC he didn’t think a rate hike was necessary but still voted for one.
Non-Bill (>1yr in maturity) US Treasury auctions off this week.
We’ll get one SPX component reporting Tuesday in Carnival (CCL).
Ex-US highlights are a decision from the RBA (Australia), UK August consumer credit, Spain September CPI, Italy July industrial sales, August PPI, Eurozone September economic confidence, Canada July GDP. Numerous central bank speakers also.
From Christophe Barraud’s international Week Ahead rundown: