Amazon Faces 1 Big Obstacle Before Becoming a Buy
Amazon sports three wide moat businesses and almost universally positive analyst coverage. So why isn’t it a buy?
You've reached your free article limit
You've read 0 of 1 free Pro articles.
When I looked at Nvidia (NVDA), I noted that a handful of hyperscalers are a large part of Nvidia’s story — and the biggest is Amazon (AMZN), on track to deploy 2 million Nvidia GPUs in 2027–28, up from about 1 million early this year. So I thought we would turn the lens around and do a dive into Nvidia’s single largest customer.
To answer the initial question, Amazon, like Nvidia, is in my portfolio at a similar weighting. Good sized but not oversized for the reasons I’ll go through below.
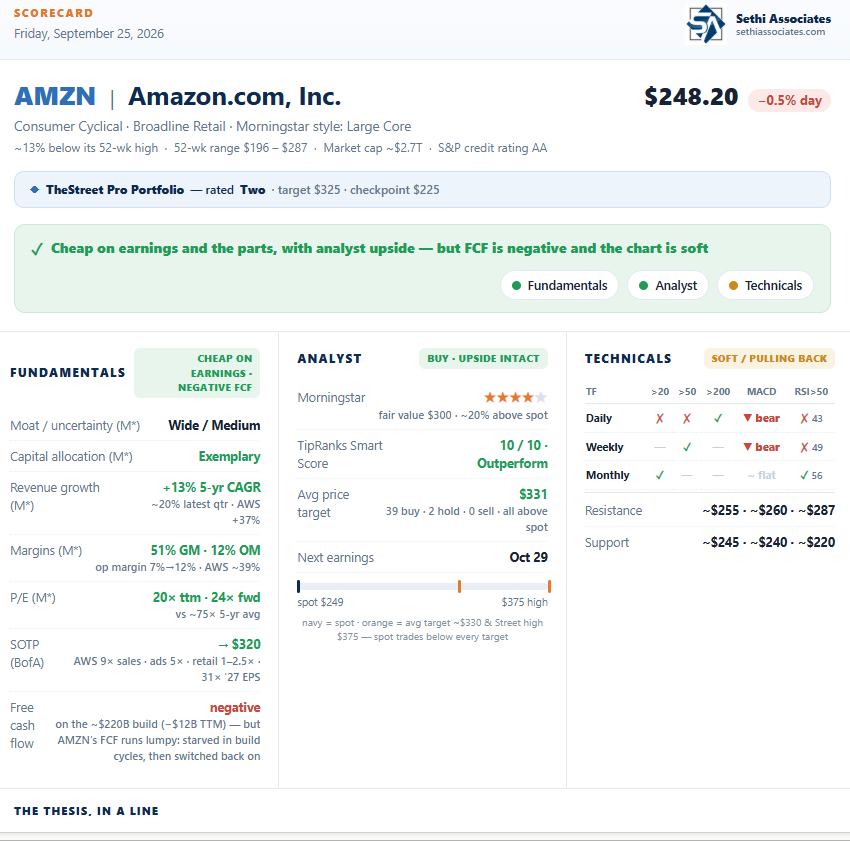
The overall takeaway is Amazon like Nvidia is cheap on earnings (although those are boosted by its “other bets” as we’ll get to) and on the sum of its parts, with a wide moat and Buy ratings across the board. It though faces a Meta-like free cash flow issue (which though is not unusual for this name) and its technical setup is weaker.
Note: A summary scorecard is at the end of the piece.
Fundamentals
Amazon is really three wide-moat businesses that reinforce one another:
- Retail is the flywheel — more than $800 billion in gross merchandise value and a marketplace where more buyers and sellers keep attracting more of both.
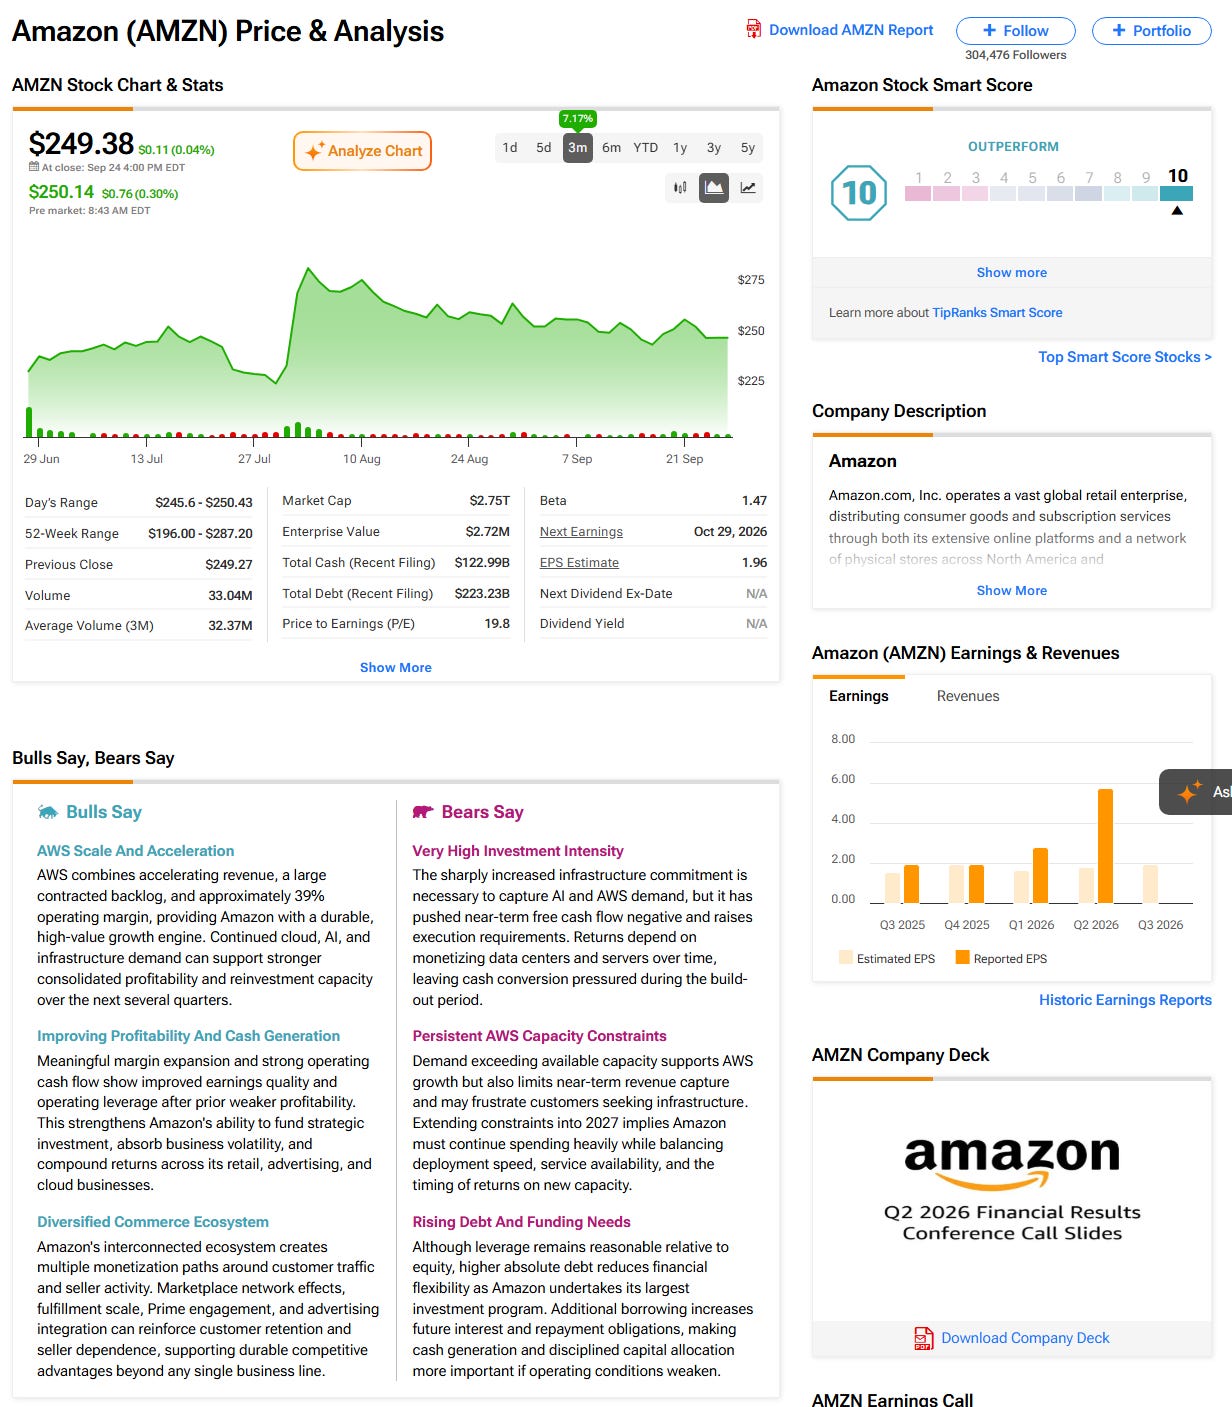
- AWS is the profit engine: roughly 17% of revenue but the majority of operating income, ~39% margins, and a backlog that jumped to $496 billion (up 154% year over year), with growth reaccelerating to +37%.
- Advertising has quietly become a third behemoth — nearing $75 billion in sales over the last twelve months, up from $50 billion two years ago, at margins north of 30%.
Because AWS and ads carry far higher margins than retail, operating margin has climbed from about 7% to 12%, and Morningstar models it heading toward 14%. Amazon even makes its own chips — Graviton and Trainium — which lower AWS’s cost to serve and give customers a cheaper compute option.
And like Nvidia, Amazon has made other bets in the AI-space that so far have paid off in a big way. Amazon’s gains on its investment in Anthropic have been staggering and have been a major boost to earnings this year. The downside is it seems unlikely those can compound at a similar rate going forward.
The real catch is cash. All those revenues come at an increasing cost. Amazon’s $220 billion capital-spending build has pushed free cash flow negative — about −$12 billion over the trailing year. But at this point it’s worthwhile to note that Amazon’s free cash flow has often experienced this phenomenon — running negative in investment cycles, then switched back on when the build eases or the market demands it, as it did in 2023–24.
Valuation
My usual cash-flow lens doesn’t work on Amazon — with FCF negative, price-to-free-cash-flow is meaningless, which is precisely why the market is repricing the stock. So the right frame is the sum of the parts. BofA values AWS at 9x 2027 sales, advertising at 5x and retail at 1–2.5x, which pencils out to roughly 31x 2027 earnings and their $320 target. On plain earnings, Amazon trades near 20x trailing — cheap against its ~75x five-year average — though forward is closer to 24x, because Goldman and BofA model 2027 EPS dipping as capex and depreciation ramp. The point isn’t that it’s cheap on every measure; it’s that on the measures that value the mix — the parts, and normalized earnings power — Amazon screens well below where its own franchises should trade.
What the analysts say
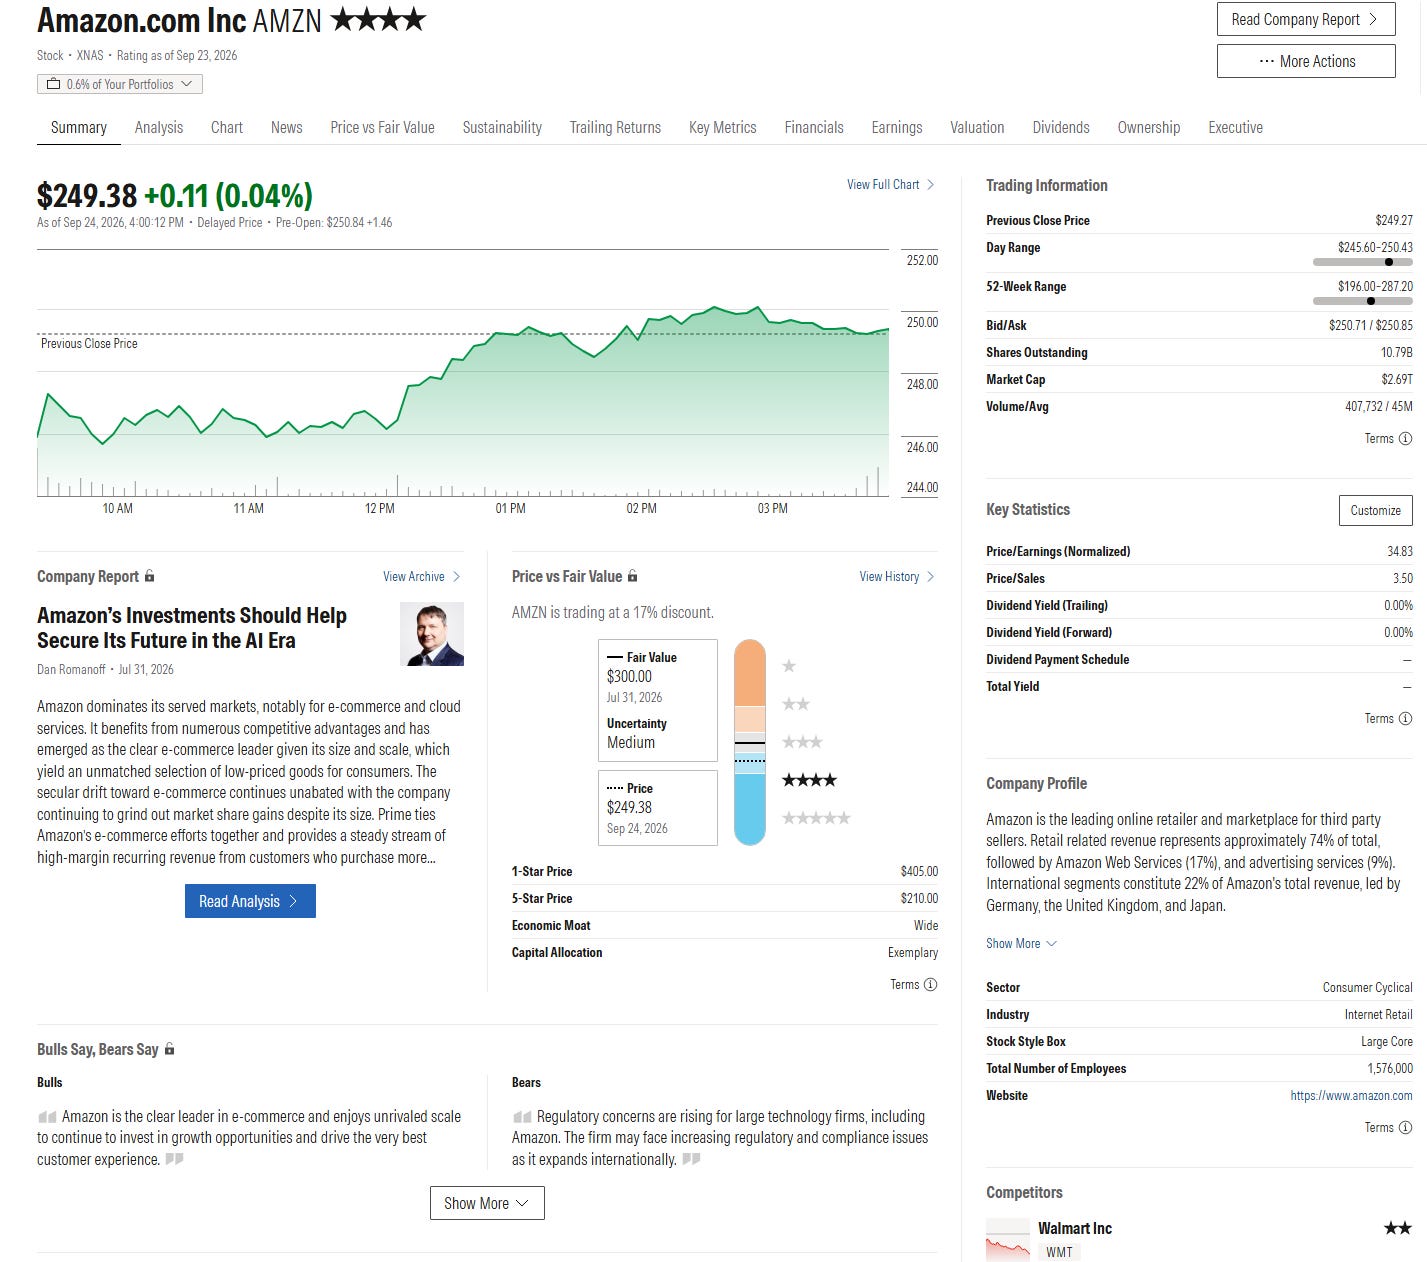
The sell side is almost uniformly constructive. Morningstar carries a 4-star rating and a $300 fair value; Goldman is Buy at $375 (the Street high, ~50% above spot); BofA is Buy at $320; and Amazon earns a perfect 10-of-10 “Outperform” Smart Score on TipRanks. It has 39 buys, 2 Holds, and 0 Sells with a consensus target of $331 and every published number above the current price. This is a name Wall Street likes; its discount is about the cash-flow optics, not the business.
The agentic-AI question
Given the buzz around Meta’s Muse agentic AI offering (which I covered in my META piece), I would be remiss not to note the current live debate around whether AI shopping agents will disintermediate Amazon’s businesses. The fear is that an AI bot will not just default to Amazon, and it also will be immune to targeted advertising. Amazon unsurprisingly has blocked Muse from searching, browsing or transacting on its properties, suggesting the worry is real.
But let’s remember that agent conversion is unproven — Walmart’s (WMT) early test of OpenAI’s instant checkout reportedly underwhelmed. And no rival owns what Amazon does end to end: infrastructure, commerce, payments, advertising and its own chips. Amazon can field its own agent off the models already in Bedrock whenever it chooses, and Goldman’s work on agentic commerce names Amazon a long-term winner, not a loser.
Technicals
Note on all charts the colored lines are moving averages (the average price over the lookback period — days on the daily charts, weeks on the weekly charts):
20 = green
50 = purple
100 = blue
200 = brownException is monthly charts where blue is 10-month moving average and brown is 20-month moving average.
MACD = Moving average convergence/divergence line, a measure of momentum that compares longer term and shorter term momentum to gauge if a move is strengthening or weakening.
RSI = Relative Strength Index (basically what it sounds like) = measures the strength of the move comparing gains to losses over the given lookback window (I use the standard 14 periods).
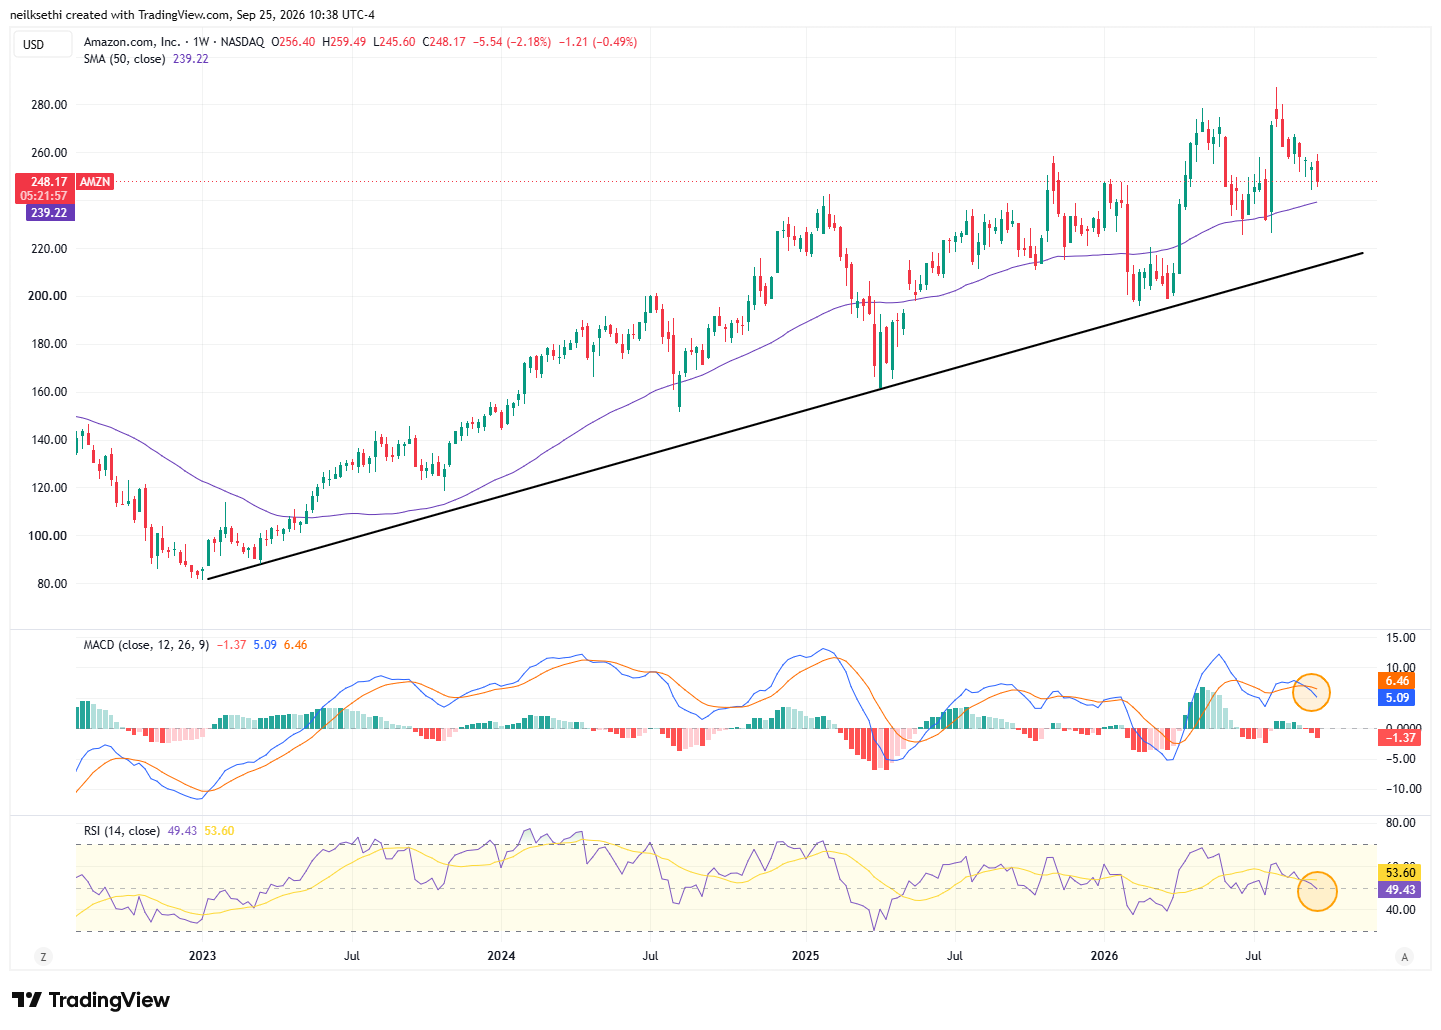
The chart is not great but not a disaster either. Longer term it remains in an uptrend, above rising 200-day, 50-week, and 10- and 20-month moving averages. That is important. It is also above its trendline from the January 2023 lows.
The monthly chart is the most constructive, with a neutral monthly MACD and RSI above 50.
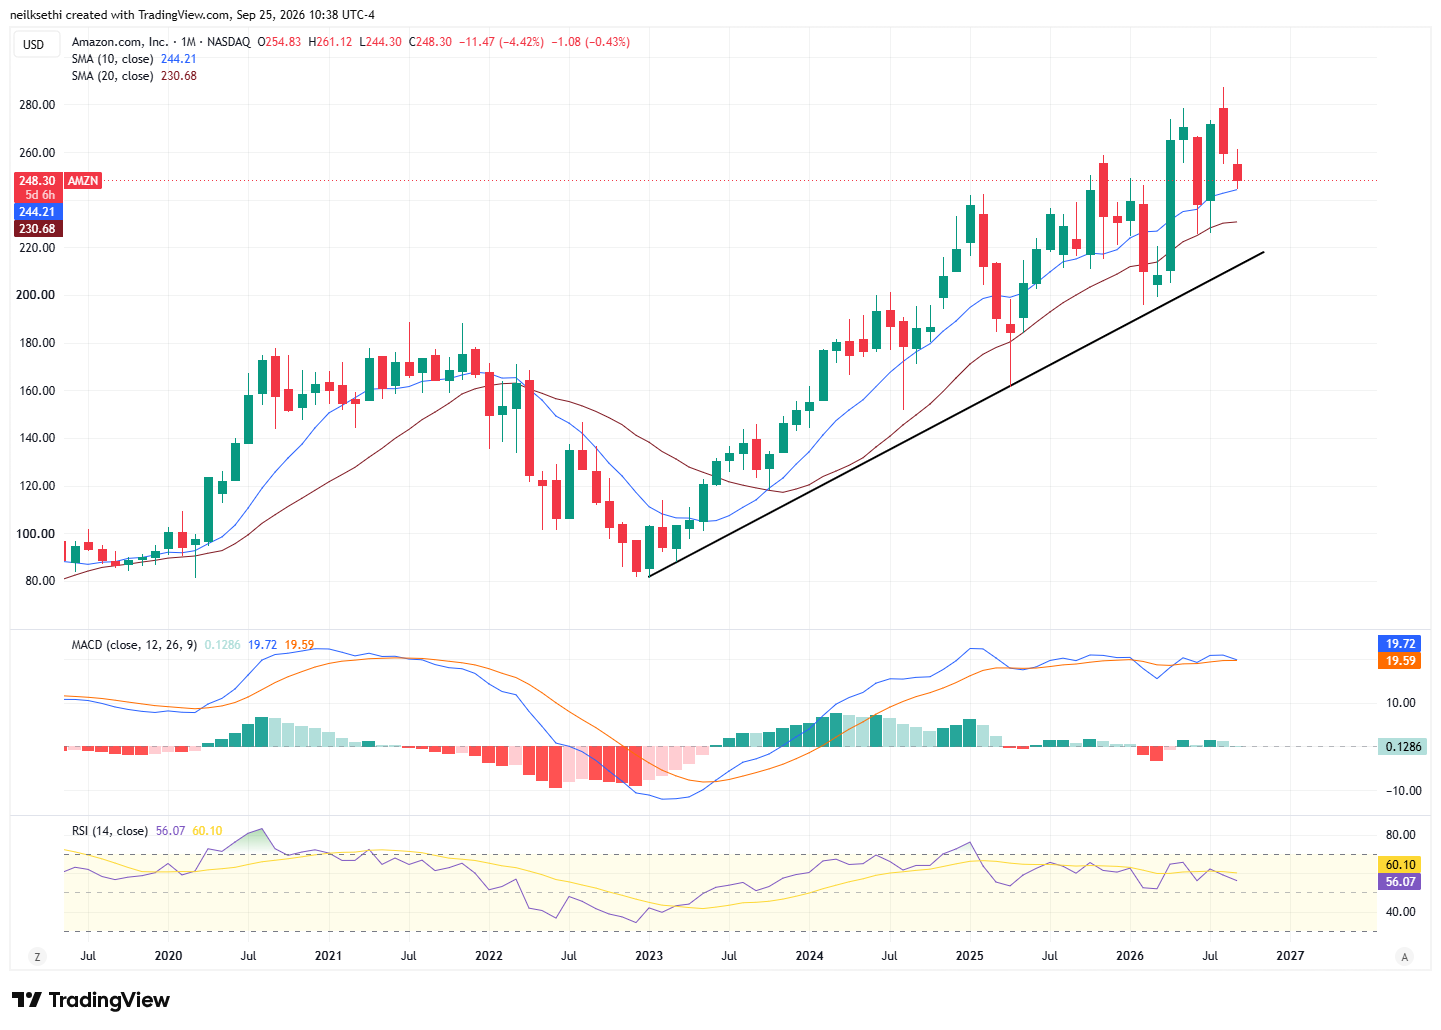
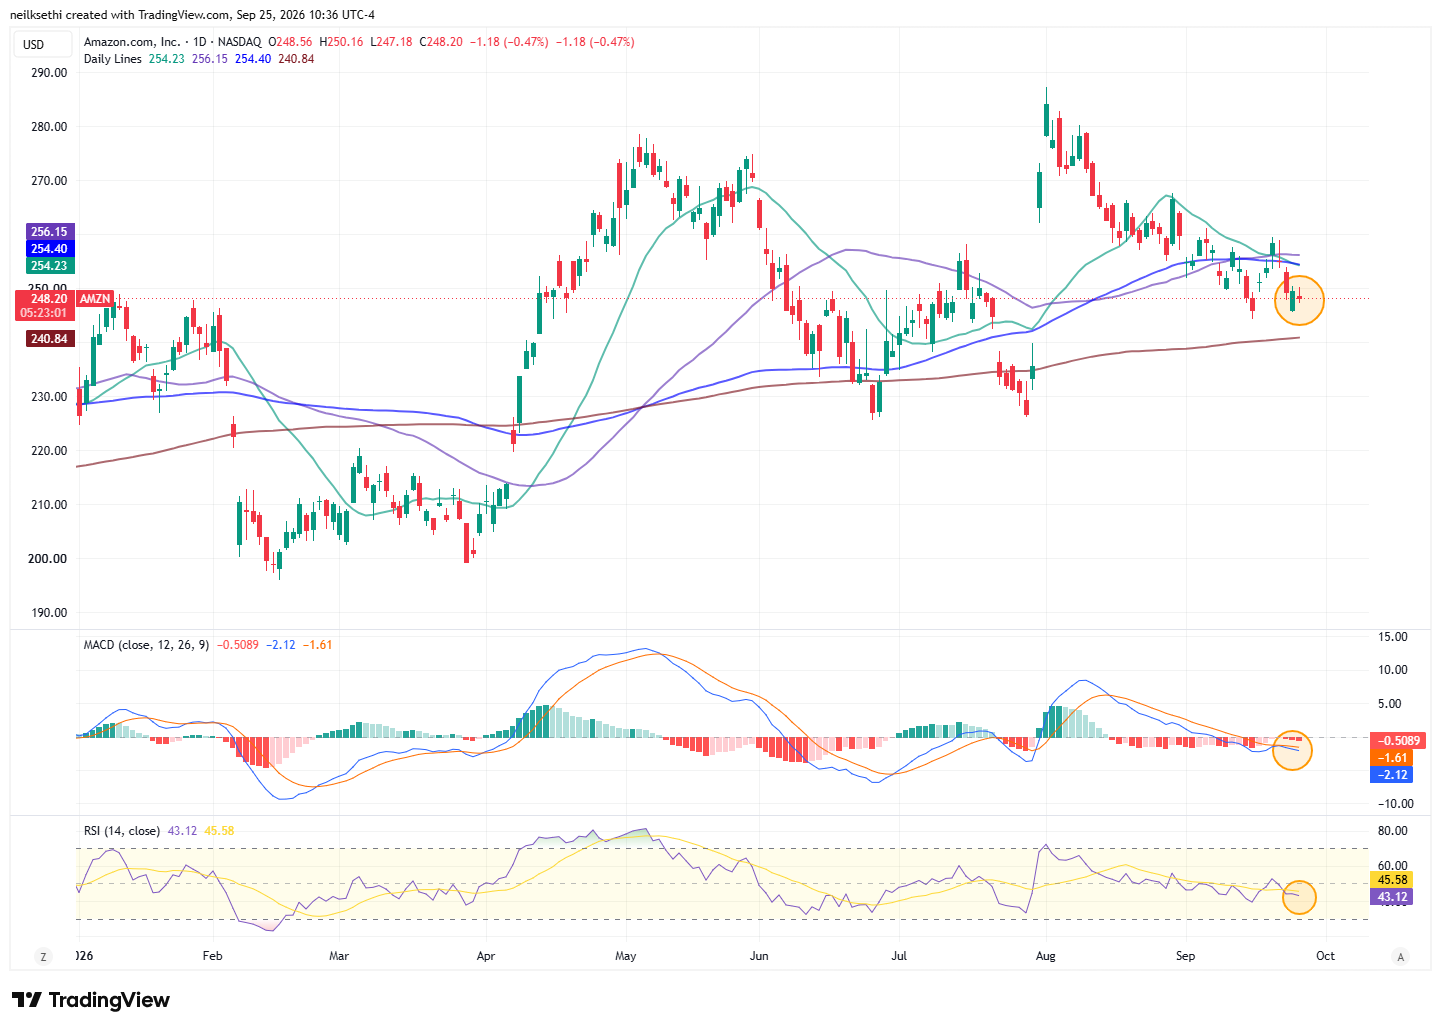
However it is in an intermediate term downtrend, trading below its 20-, 50-, and 100-day moving averages, and both the daily and weekly MACD are negative with RSIs also under 50. I generally avoid buying unless those are the opposite.
I’d mark support around $245, $240, and $220 (below $240 though I would start to cut exposure heavily), with many levels of resistance at $254-56, $260 and off on and to the $287 high.
Daily
Weekly
TheStreet Pro’s take
Amazon is a TheStreet Pro Portfolio holding, rated a Two with a $325 price target and a $225 checkpoint. On the desk, Bob Byrne flagged rising diesel costs — a real input for Amazon’s logistics and its data-center backup generators — but doesn’t see them denting the operations or the stock; he’d rather use weakness to buy, stepping in on a pullback toward the three-year trendline in the $220–225 area. That lines up with both the Portfolio’s checkpoint and my own entry zone.
Takeaway
Amazon is in most respects inexpensive vs history but now includes three wide moat businesses along with continued solid analyst support. The negative free cash flow is the headline hesitation, but as noted it’s not one unfamiliar to Amazon. With the relatively weak technical picture I’m not looking to add, but I would consider doing so if and when that clears up.