Stocks Shrug Off New Highs in Yields as the Advance Broadens
The Nasdaq closed at a record, and the S&P 500 came within a whisker, as the rally broadened for a second straight session, even as 10 and 30-year yields climbed to their highest close since 2002.
You've reached your free article limit
You've read 0 of 1 free Pro articles.

Quick Summary
- Stocks extended Friday’s broader rally to start the week although Tech continued to lead. The Nasdaq closed at a record while the S&P 500 finished just shy of one as participation broadened for a second straight day, even with the 10-year yield climbing to its highest close since 2002.
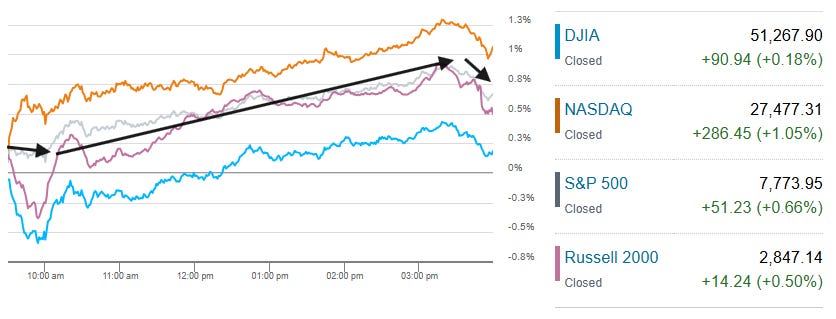
- Indices opened little changed and, after an early dip in non-Tech names, ground steadily higher before easing off the highs in the final half hour. The Nasdaq rose 1.1% to a record close, the S&P 500 gained 0.7% and closed just below its August 13 record, the Russell 2000 was up 0.5% and the Dow Jones Industrial Average added 0.2%.
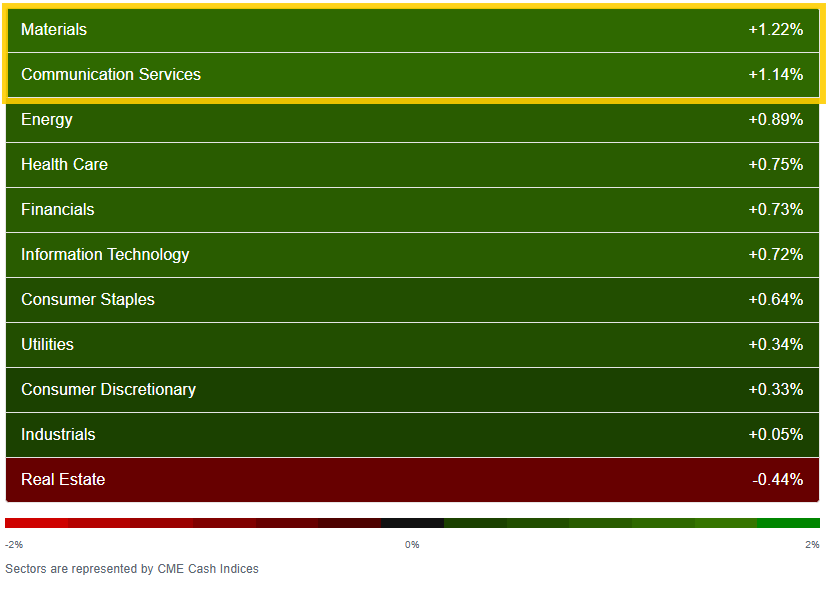
- Ten of 11 sectors were higher for a second straight session, but unlike Friday Communications was the only mega-cap-growth sector in the top five. Real Estate (-0.4%) was the lone decliner. Also unlike Friday where it lagged, the equal-weight S&P 500 (+0.7%) nearly matched the cap-weighted index, looking to end its seven-week losing streak.
- Stocks rose even as the long end rose to new multi-decade highs. The 10-year rose 3 basis points in the cash session to 5.31%, its highest close since April 2002, and the 30-year also was the highest since 2002 at 5.66%, even as WTI slid about 2% to ~$89. Not helping was the ISM services price index hitting the highest level since 2022.
- Tuesday brings us another lighter session on the calendar although with more Fedspeak.
Market Commentary
Equities:
- “Despite a growing list of headwinds (e.g., geopolitics, higher rates), global equities have climbed c12% YTD and are just below all-time highs,” wrote Citi strategist Beata Manthey. “Does this relative calm suggest equity fundamentals will prove resilient to ongoing macro shocks, or will stocks eventually need to correct to more accurately reflect the current risk backdrop? While uncertainty remains high, we still find ourselves in the ‘resilience’ camp for now.”
- “There’s plenty for investors to worry about, but earnings continue to be the counterweight,” said Mark Hackett at Nationwide. “What’s encouraging is that the strength isn’t a fluke. We’re seeing a healthy combination of growth and margin expansion.” Rates are becoming “more punitive” and expectations are high, but companies have outgrown those pressures, he said.
- “Relative equity-market calm amid the bond market’s ‘perfect storm’ is understandable, given accelerating economic growth and the AI boom’s rate insensitivity,” said Lisa Shalett at Morgan Stanley Wealth Management.
- “We believe equities have room to move higher over the next six to 12 months amid resilient economic growth and robust earnings,” said Ulrike Hoffmann-Burchardi at UBS Chief Investment Office. “But the path is unlikely to be smooth.”
- “Bonds are continuing their trend, and so are stocks… If you think the benefits of AI are essentially infinite, so what if you have to pay more to borrow money?” —Steve Sosnick, chief strategist at Interactive Brokers
- Tech is “sort of like the inverse bond trade,” Infrastructure Capital Advisors founder and CEO Jay Hatfield told CNBC. “It’s buy tech, sell everything else, and so it’s kind of an unstoppable juggernaut.” Hatfield added that tech has served as a kind of safe haven since the pandemic, citing the sector’s high earnings-related growth and relatively low sensitivity to interest rates.“It really doesn’t matter what they pay for debt, and the demand for compute is so strong, [so tech is] not really impacted by interest rates,” Hatfield said.
Fed:
- “The hurdle for an October rate hike is now high. Even if the minutes remind markets how hawkish officials were in September, subsequent data have strengthened the case for patience. Sticky services inflation could keep open the option of a December hike — but the Fed will probably need clearer evidence that price pressures have re-emerged before tightening again.” —Bloomberg’s Anna Wong, Andrew Sacher and Eliza Winger.
Stock and Sector Breakdown:
After not seeing 10 of 11 sectors higher for weeks, we got it for a second straight session Monday (after 5 Thursday, 2 Wednesday, 4 Tuesday, 3 a week ago) and in a true broadening just one of the top-five spots was taken by a mega-cap-dominated growth sector in Communications (it and Materials the two sectors up over 1%). Just Real Estate -0.4% closed in the red.
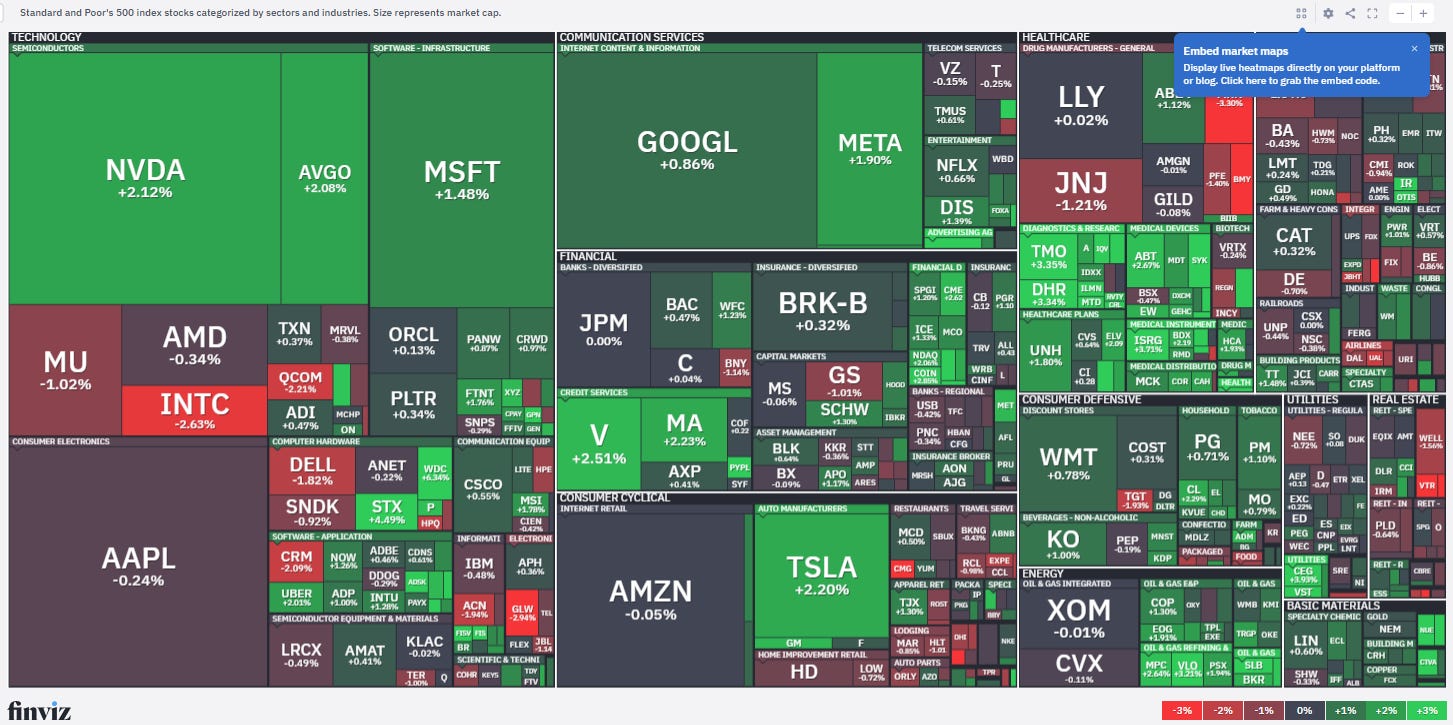
Mega-caps were a notable boost. Top-10 names Nvidia (NVDA) +2.1%, Meta Platforms (META) +1.9%, Broadcom (AVGO) +2.1%, and Tesla (TSLA) +2.2% all finished up around 2%. Software stocks were another source of strength, with the iShares Expanded Tech-Software Sector ETF (IGV) rising 1.2%. SpaceX (SPCX) +7.6% added to Friday’s +7.4% gain with a similar-sized gain to start the week contributing to the outperformance of the Nasdaq 100.
Semiconductor stocks were more mixed, with the PHLX Semiconductor Index (SOX) up 0.3%. Taiwan Semiconductor Manufacturing (TSM) +2.8% hit new 52-week highs after Elon Musk he may utilize the company for Terafab’s Texas chip project. The news though weighed on Intel (INTC) -2.6%.
PTC (PTC) +33.5% was the top gainer on the S&P 500, after Schneider Electric (SBGSY) -10.1% agreed to acquire the company for $205 per share in cash, while Microsoft (MSFT) +1.5% advanced following an upgrade to Buy from Hold at Melius who raised the price target to $665, and Xbox revealed the new games coming out this week.
The industrials sector was weighed down by C.H. Robinson (CHRW) -10.9% after the firm agreed to acquire RXO, Inc. (RXO) +22.5% in a stock-and-cash transaction valued at $5.8 billion. The Minnesota-based company expects to fund 57% of the acquisition in cash and 43% with its shares.
[Note: chart uses futures prices.]
Despite the strong breadth, the number of large SPX winners (up over 3%) remained muted at ~40 from ~30 Friday, ~45 Thursday, while the number of large losers (down over 3%) fell to 8 from 14. As mentioned previously, both of these metrics have remained very (extremely?) subdued since the start of August rarely getting above 50 and only once above 100.
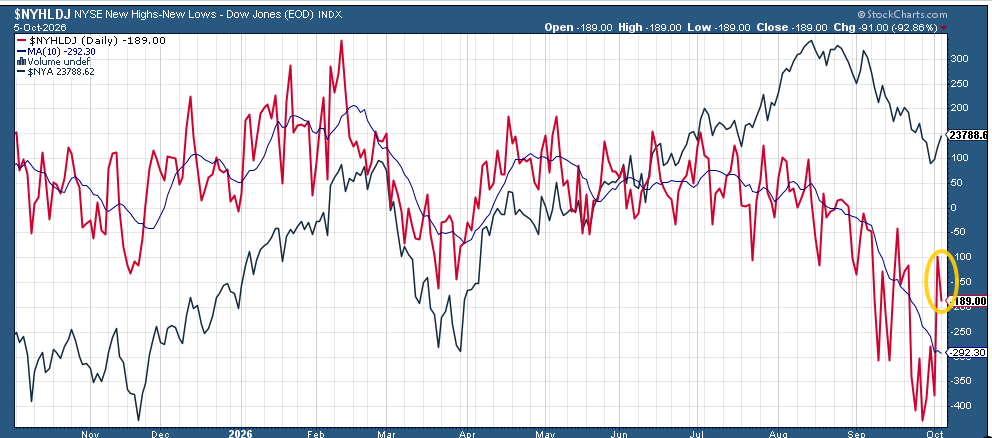
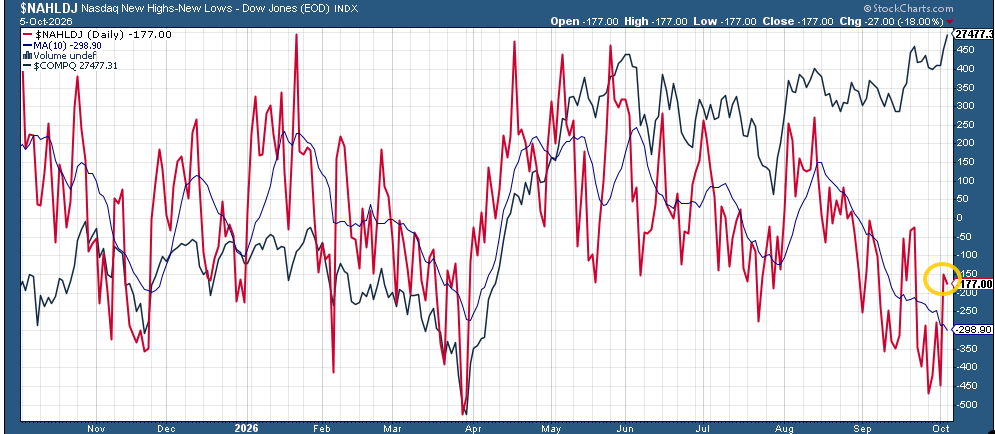
Positive volume was also better for a fifth straight day although marginally on the NYSE and Nasdaq. But new 52-week highs vs. lows fell back to -189 from -99 on the NYSE and to -177 from -157 on the Nasdaq, so that’s disappointing.
So that makes it the 26th straight session that the Nasdaq saw more new 52-week lows than new highs, the longest such streak since the 43-day stretch that ended April 22, 2025. As MarketWatch noted Friday: “The key difference between then and now: On April 22 of last year, the Nasdaq Comp closed 19.2% below its then-record close reached five months earlier.”
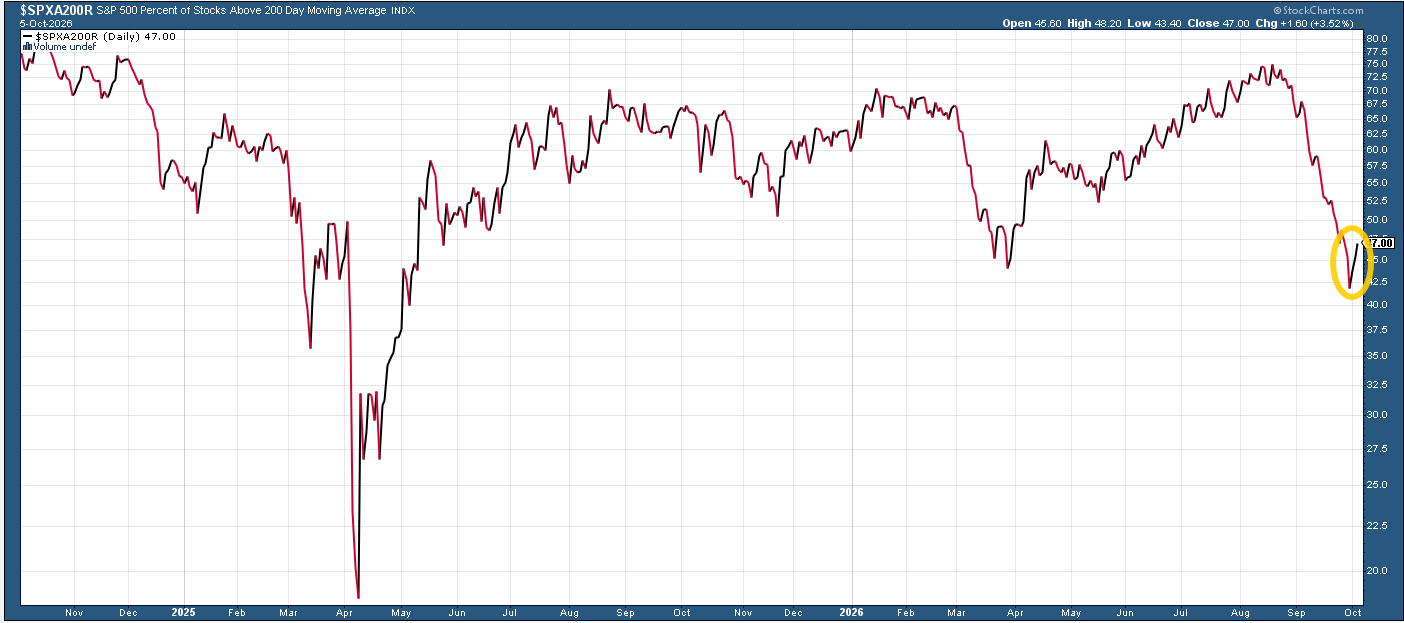
And we did see a continued turn higher in the percent of S&P 500 stocks trading above their 200-day moving average (although still under 50%).
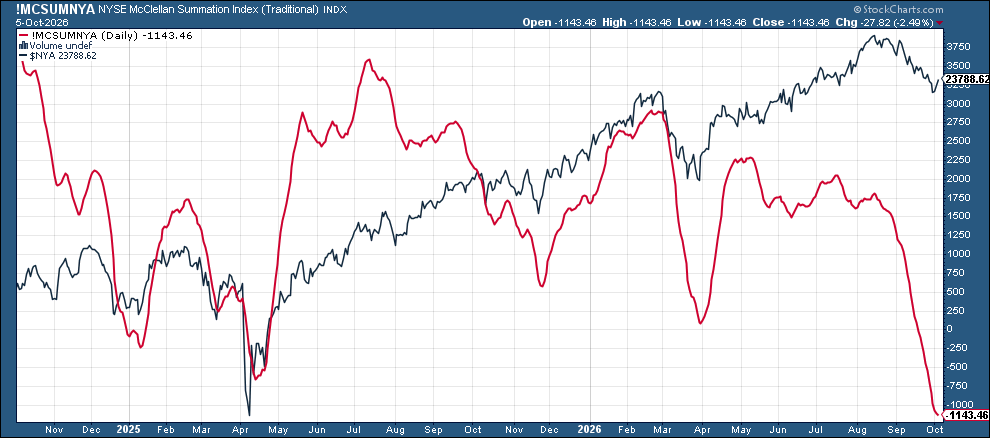
Still though waiting for the McClellan Summation Index (red line, broadly whether the typical stock is doing relatively better or worse than the index) to turn higher.
Some Other Stock-Specific Commentary From TheStreet Pro:
- Bob Lang –
- Chris Versace –
- James “Rev Shark” DePorre – Small Biotech Name Hits Radar With Promising Hair Loss Play
- Bret Jensen – How to Trade This Cash-Rich Biopharma Name
- Bob Byrne – AI Needs Somewhere to Plug In: 7 Stocks That Have the Power
A Look at the Charts
Note on all charts the colored lines are moving averages (the average price over the lookback period — days on the daily charts, weeks on the weekly charts):
20 = green
50 = purple
100 = blue
200 = brownException is monthly charts where blue is 10-month moving average and brown is 20-month moving average.
MACD = Moving average convergence/divergence line, a measure of momentum that compares longer term and shorter term momentum to gauge if a move is strengthening or weakening. This is probably my favorite individual indicator.
RSI = Relative Strength Index (basically what it sounds like) = measures the strength of the move comparing gains to losses over the given lookback window (I use the standard 14 periods).
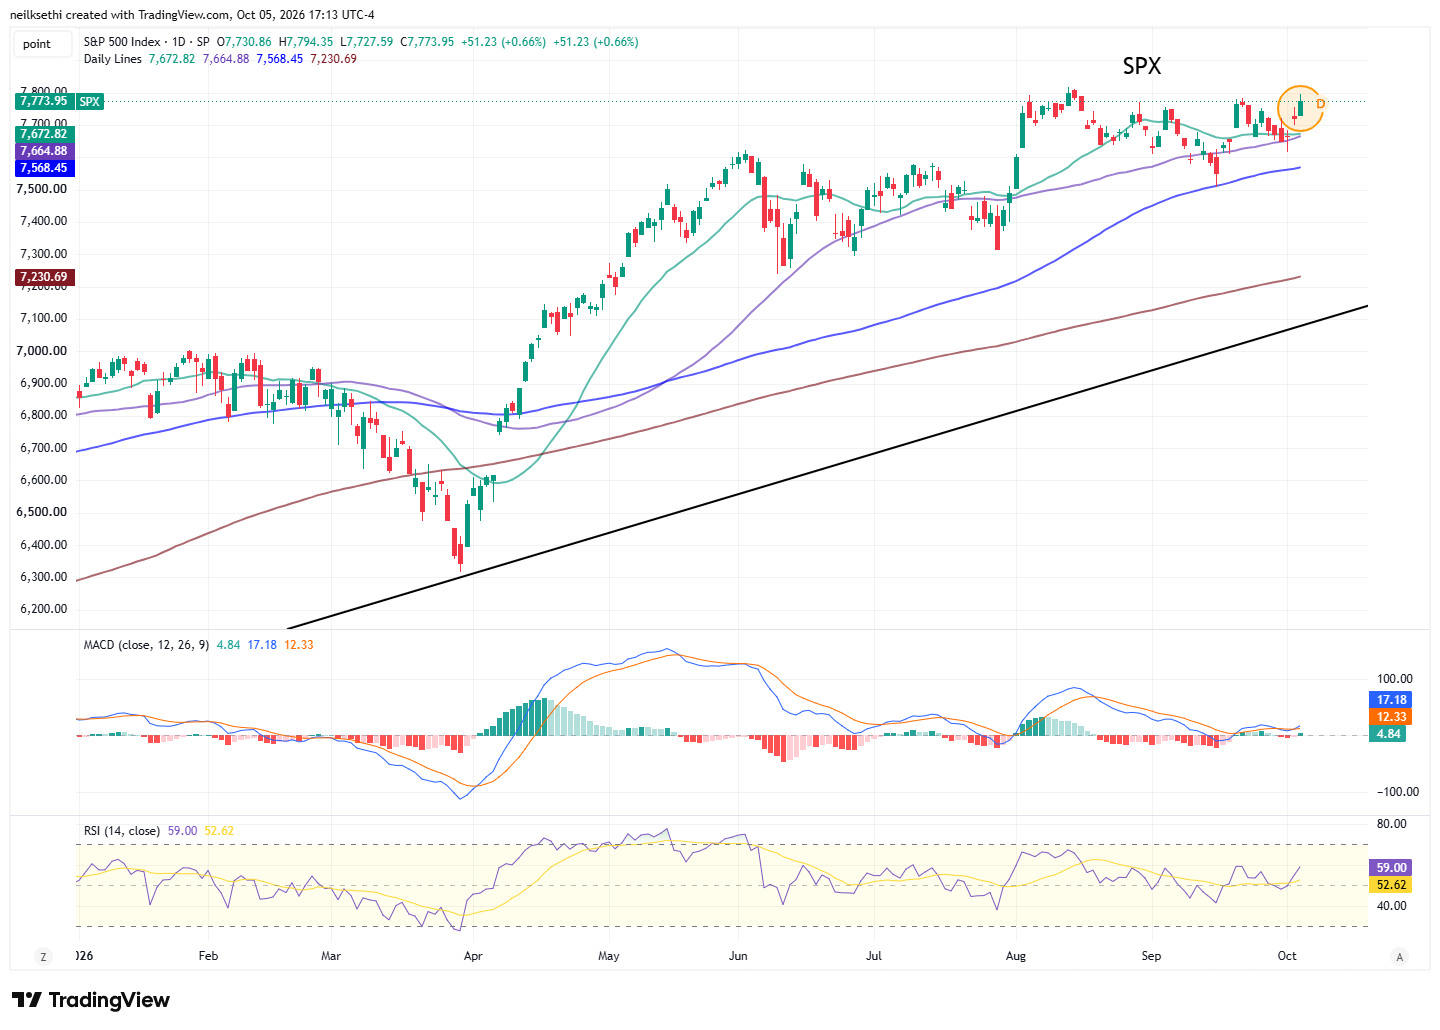
SPX almost back to all-time highs. It also broke the five-day string of red candles (meaning it closed lower than it opened). As mentioned Friday “The daily MACD and RSI have turned back to a positive tilt overall.”
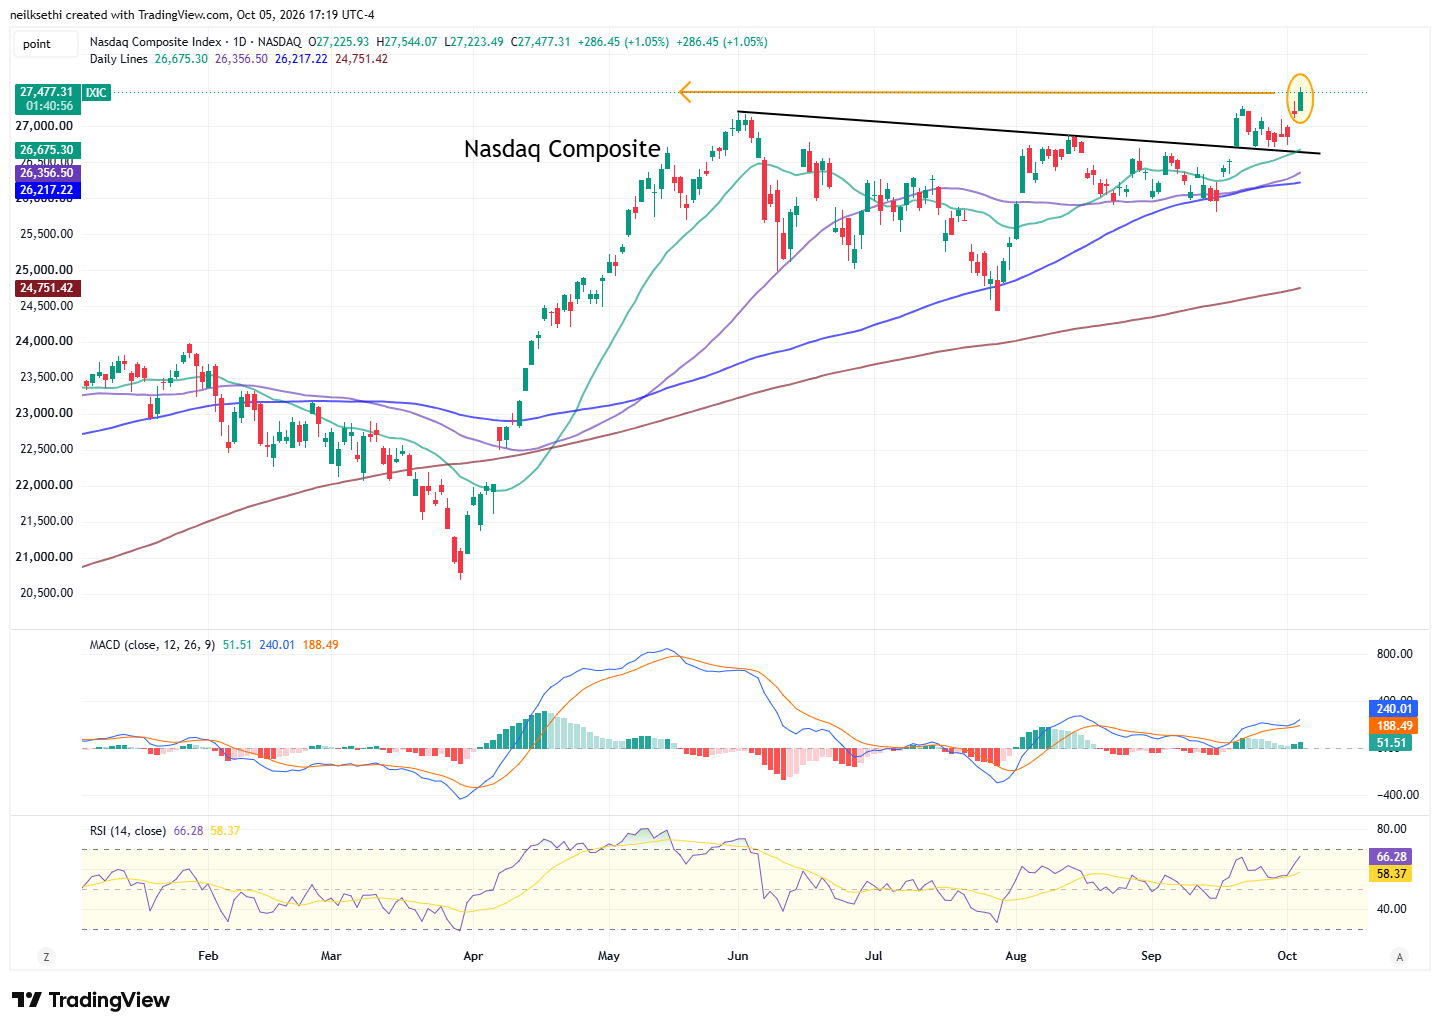
Nasdaq Composite this time held its all-time high. Daily MACD and RSI are even more positive here.
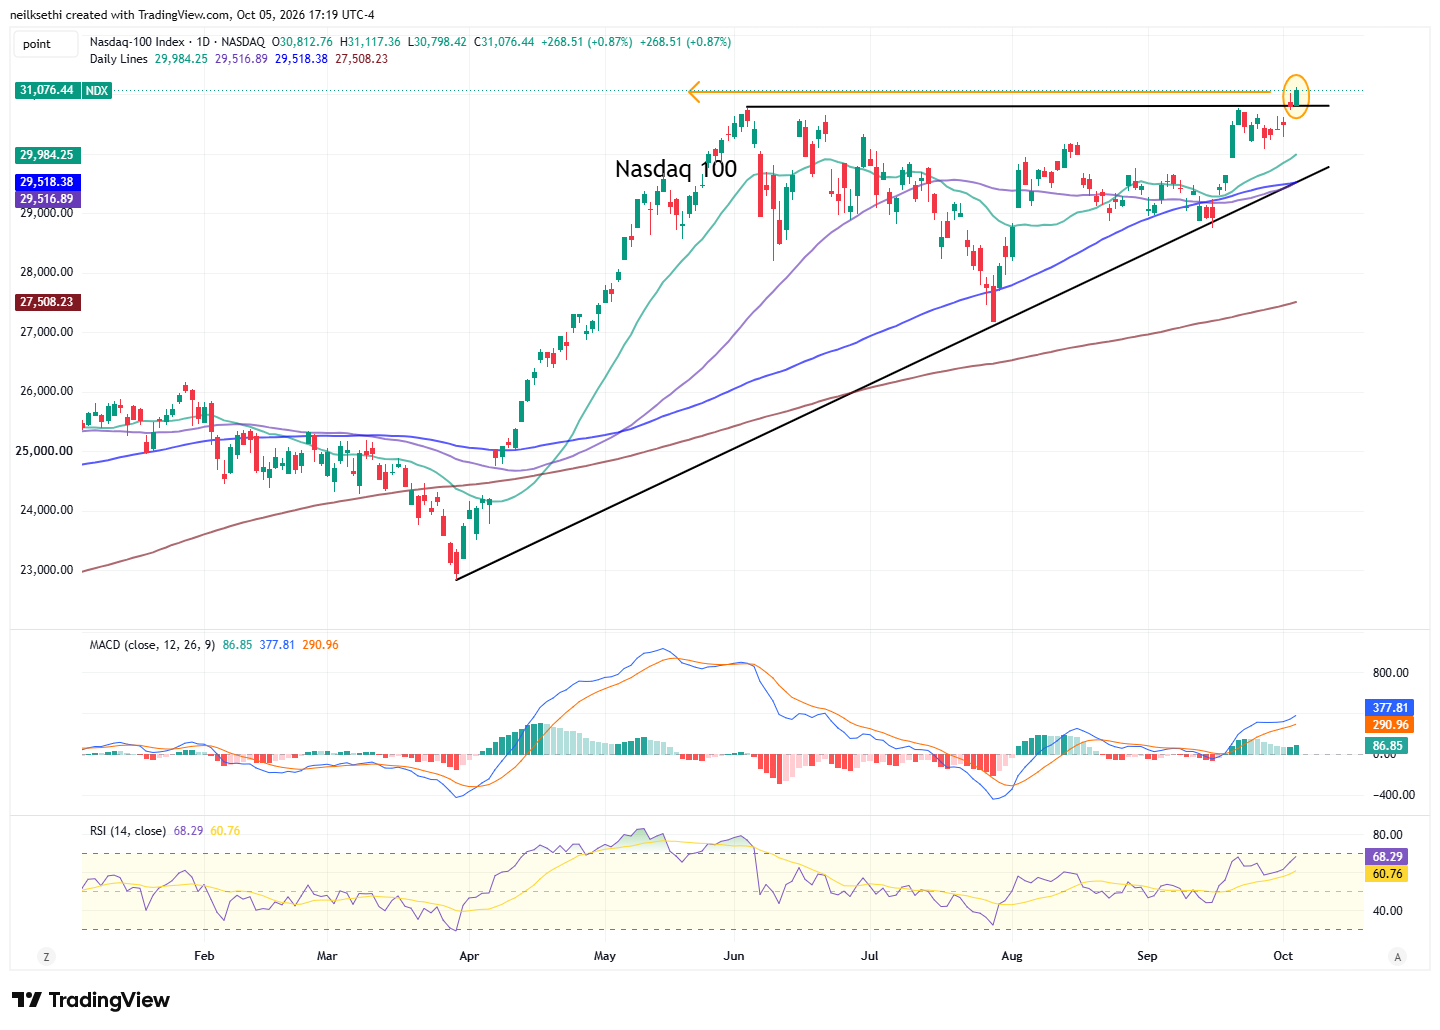
The Nasdaq 100 (QQQ) also an all-time high. Daily MACD and RSI very positive here as well.
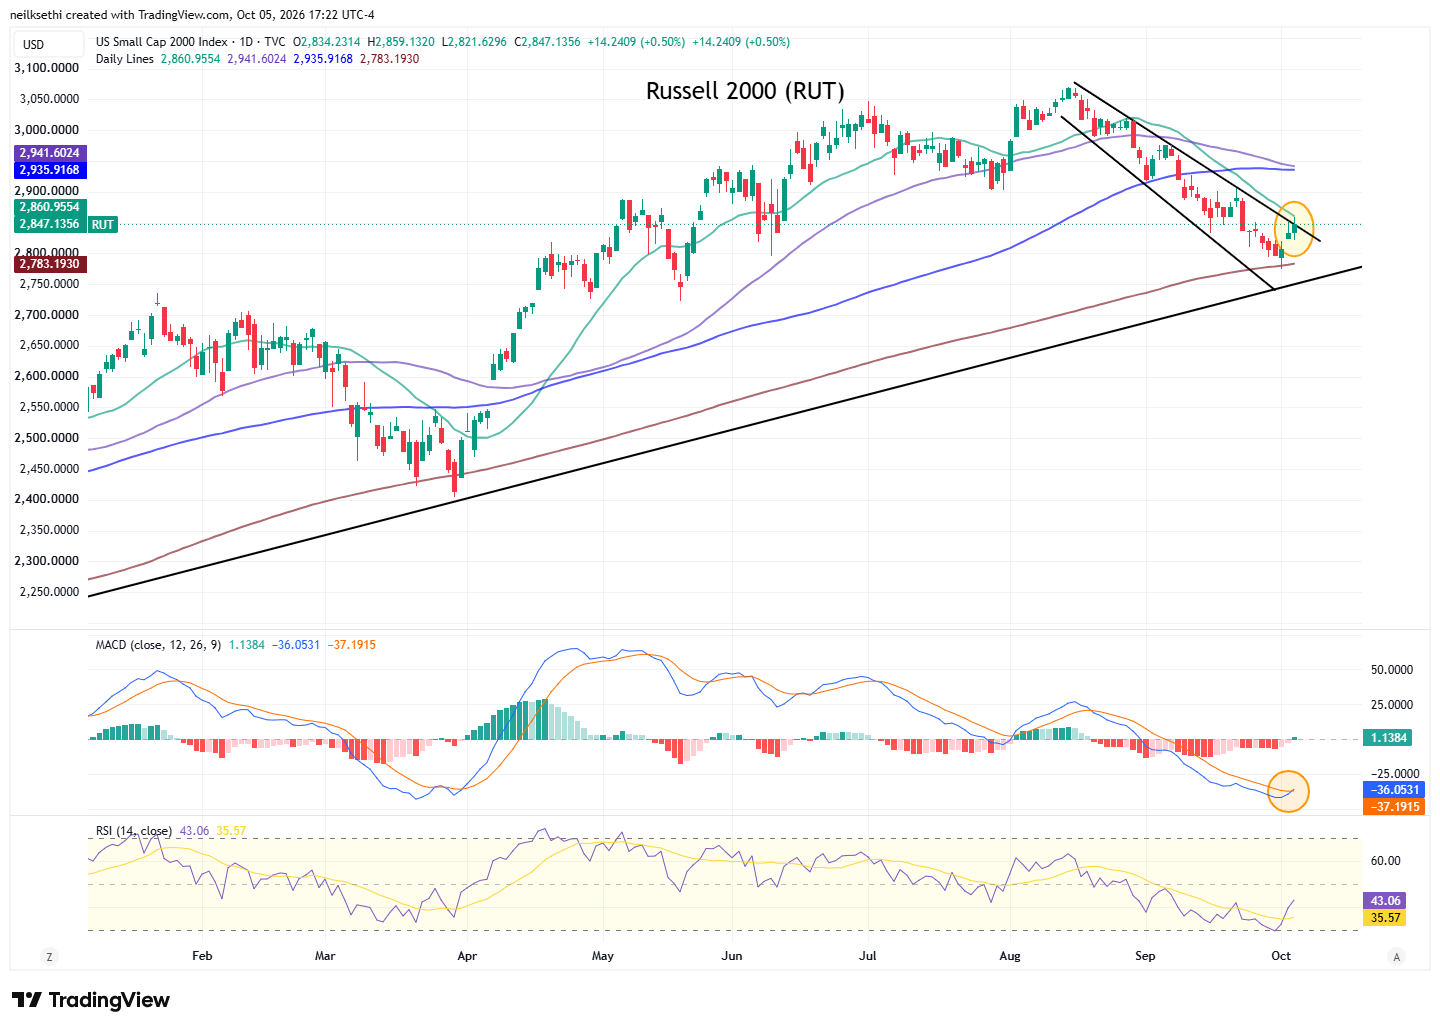
The Russell 2000 (RUT) tried to push through the top of its downtrend channel from its all-time high but was stopped at the downward sloping 20-DMA. So that becomes a key resistance level. If it gets through that it should run to the 100-DMA (blue line).
The daily MACD also got a positive crossover, and the RSI is getting close to 50. A push through the 20-DMA could see it all come together.
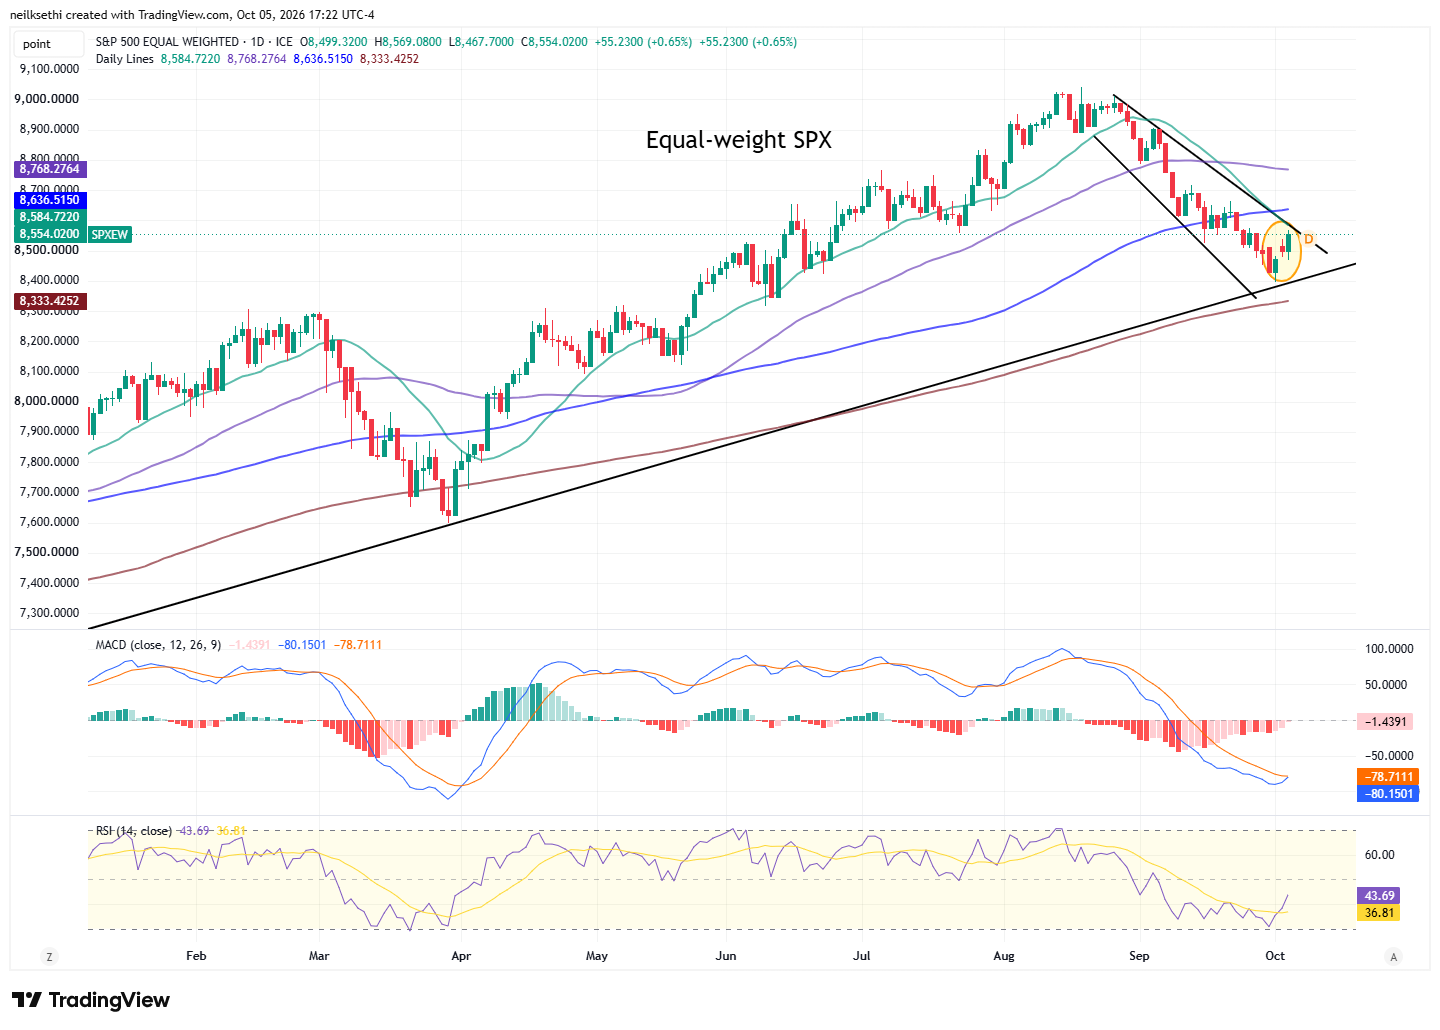
The equal-weighted SPX remains the weakest chart of the bunch. It hasn’t gotten its daily MACD crossover yet. Has a little more room to get to the top of its downtrend channel.
Treasury yields “twisted” across the curve Monday with the short end falling back (after the surprising jump Friday) while the long end rose once again to multi-decade highs:
The 2-year Treasury eased back 2 basis points (including the after-hours).
It is still ~93 basis points above the Effective Fed Funds rate, so still calling for (at least a couple) more rate hikes.
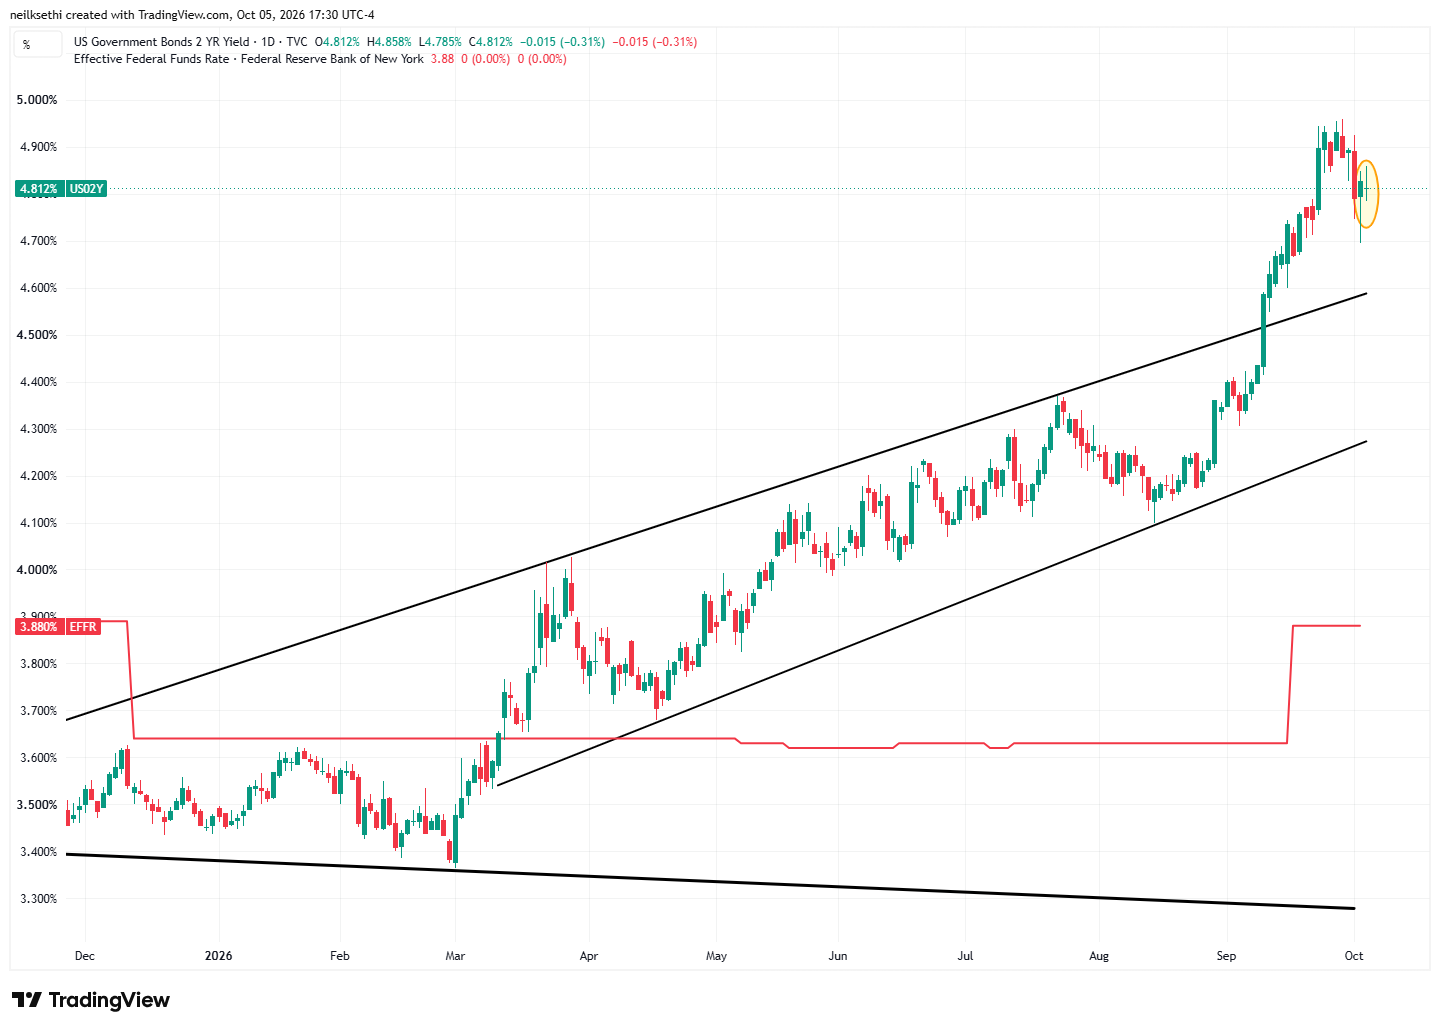
In that regard, Fed rate hike bets were little changed from Friday with October at 22% and an 18% chance of two hikes this year. 2027 sees ~86 basis points of hikes through next December.
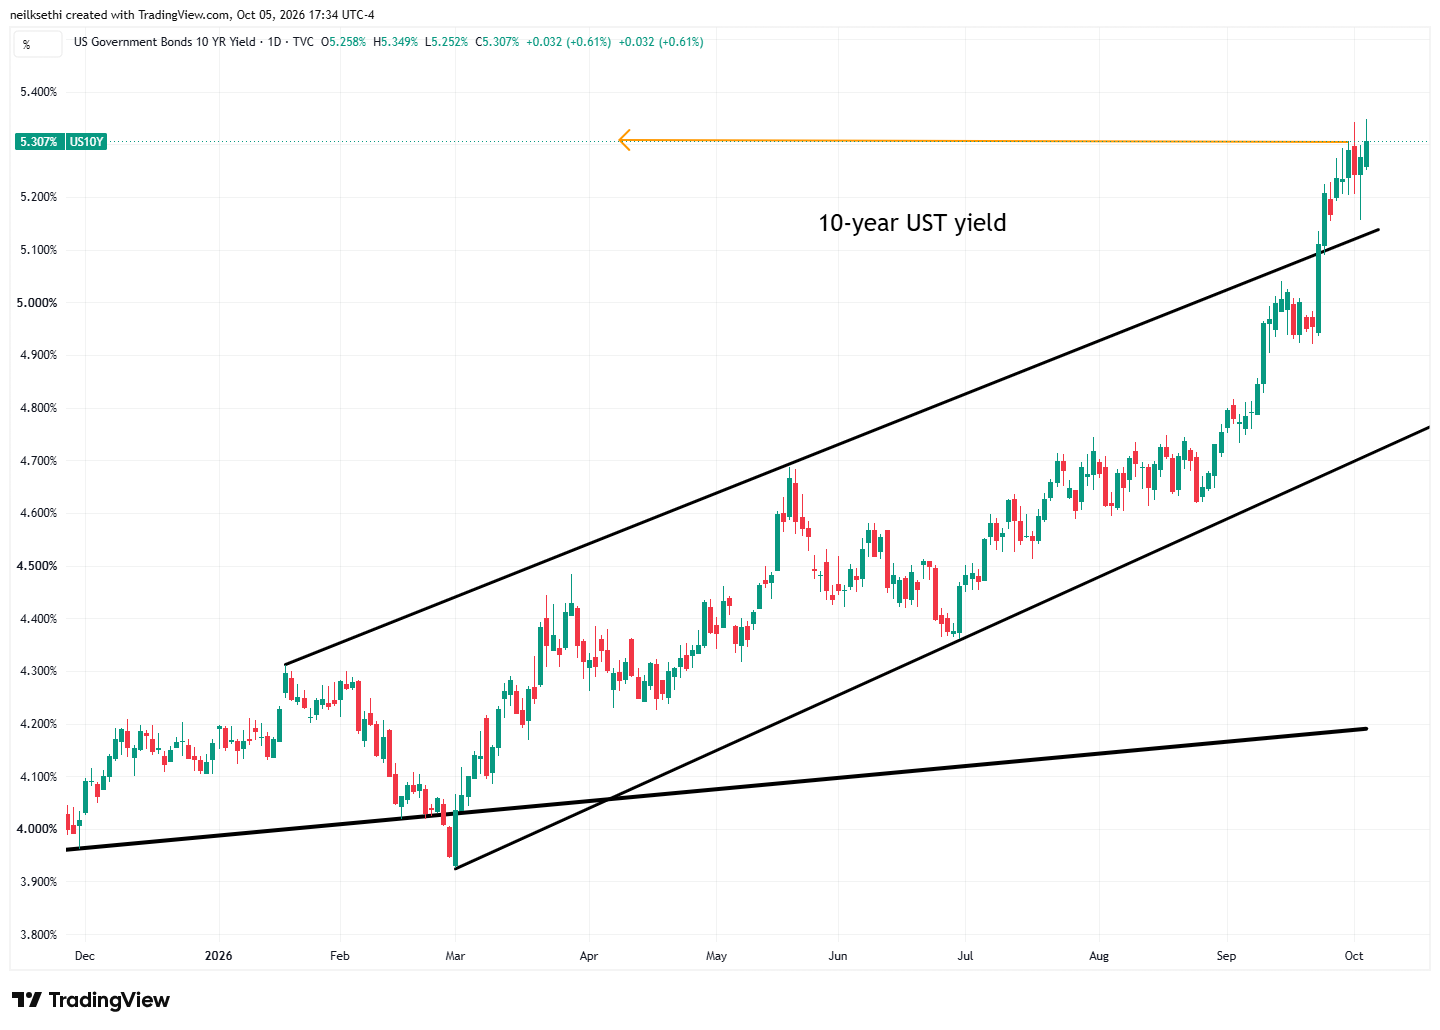
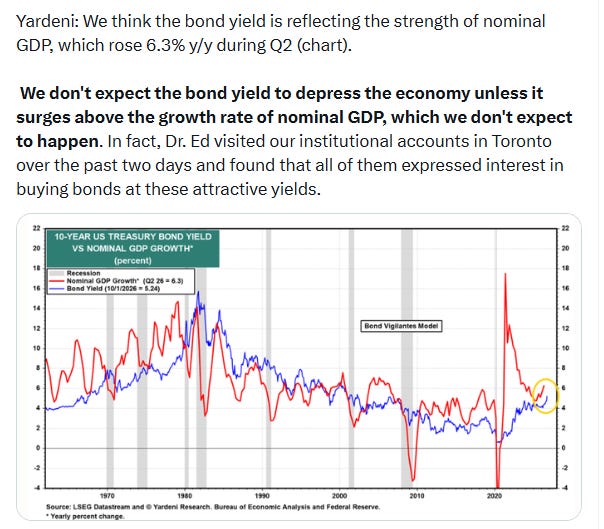
10-year yields were up 4 basis points to 5.31% (including after-hours), a fresh highest close since 2002.
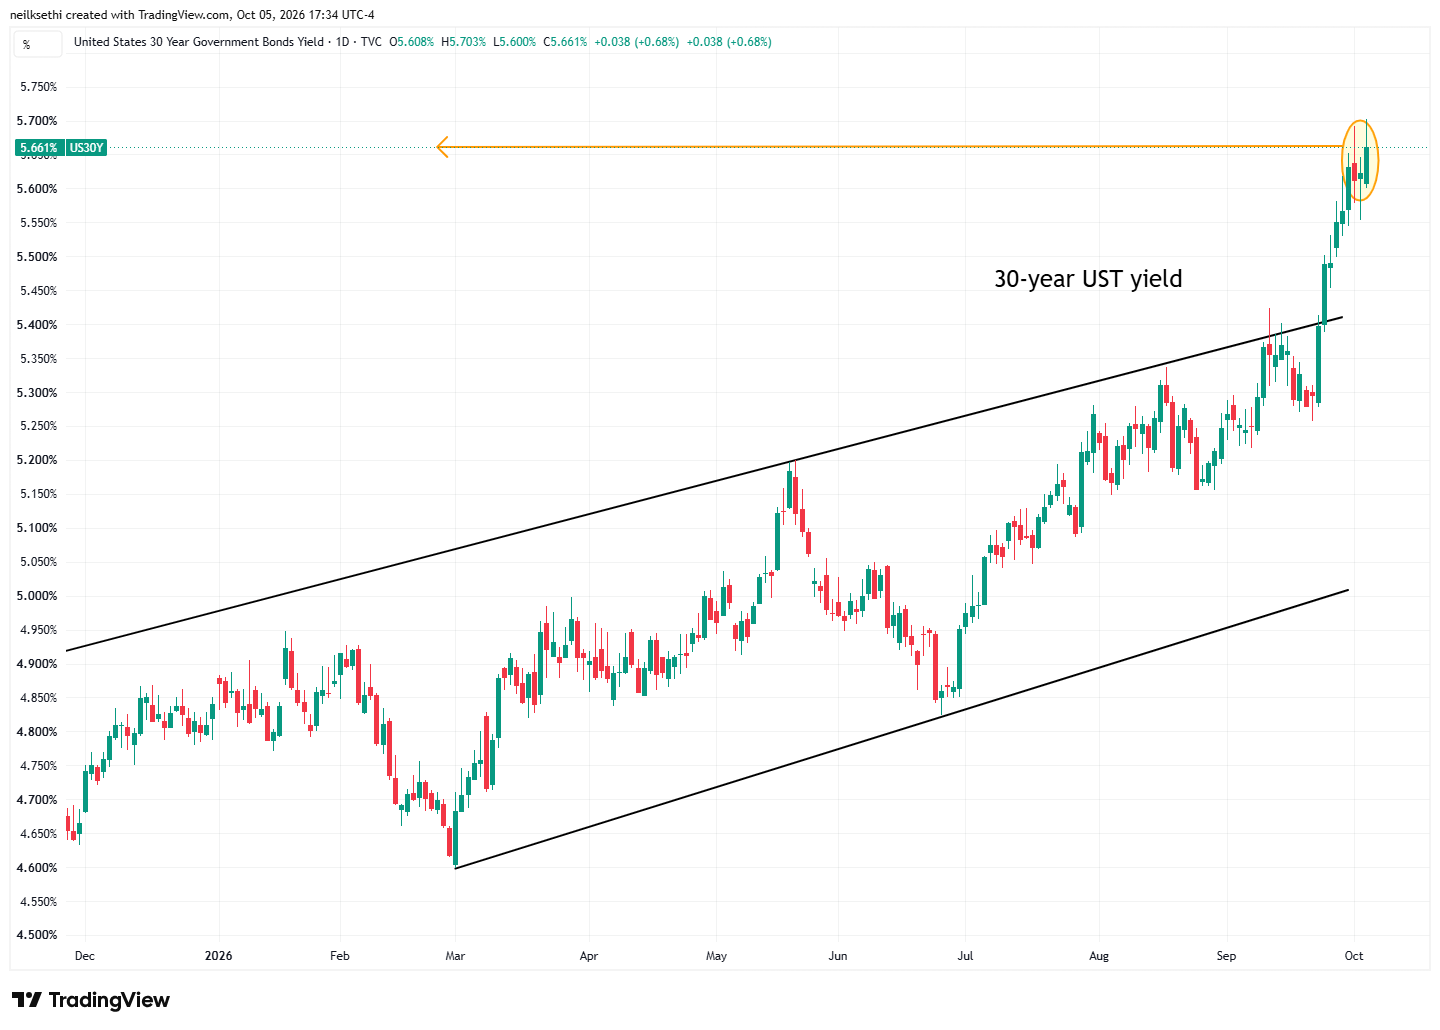
30-year yields also up four basis points to 5.66%. Also a fresh highest close since May 2002.
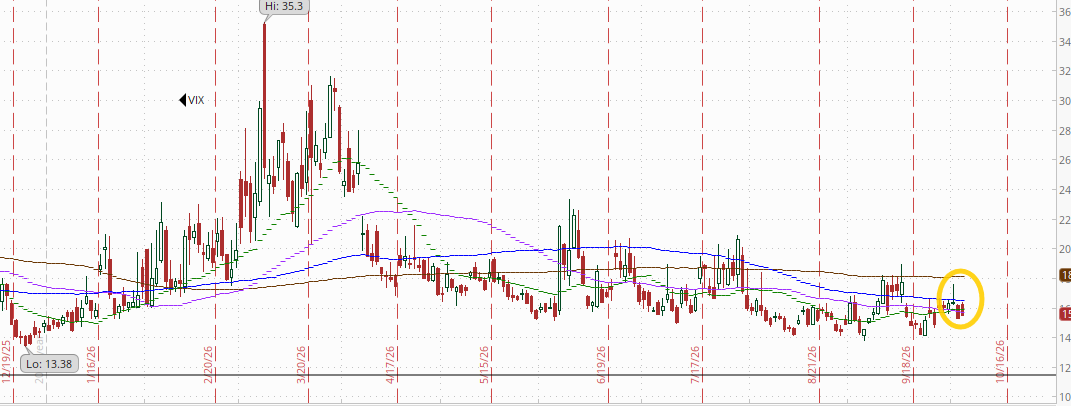
VIX edged up to 15.5 (so a “spot up, vol up” day). That’s consistent with ~0.97% average daily moves in the SPX over the next 30 days.
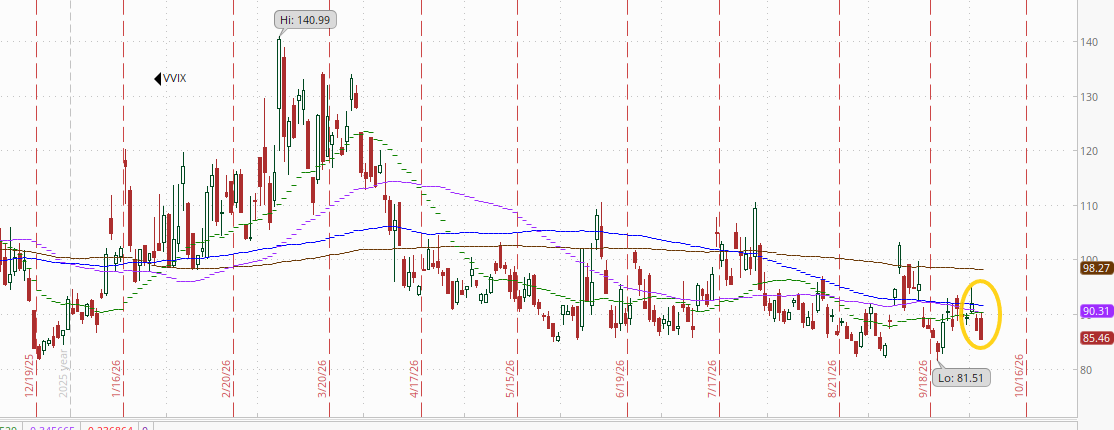
The VVIX (VIX of the VIX) though fell to 85.5, also remaining very subdued.
The current level is consistent with “moderate” daily moves in the VIX over the next 30 days (historically, normal is 80-100). Above 100 is the level flagged by Charlie McElligott as indicating higher stress.
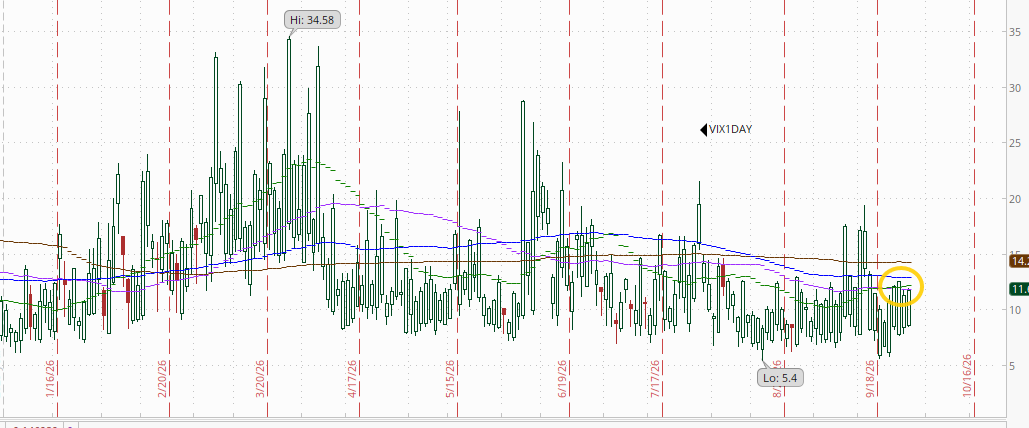
1-day VIX edged back to 10.7, but very little change the past five sessions. The current reading isconsistent with a move of 0.67% in the SPX next session.
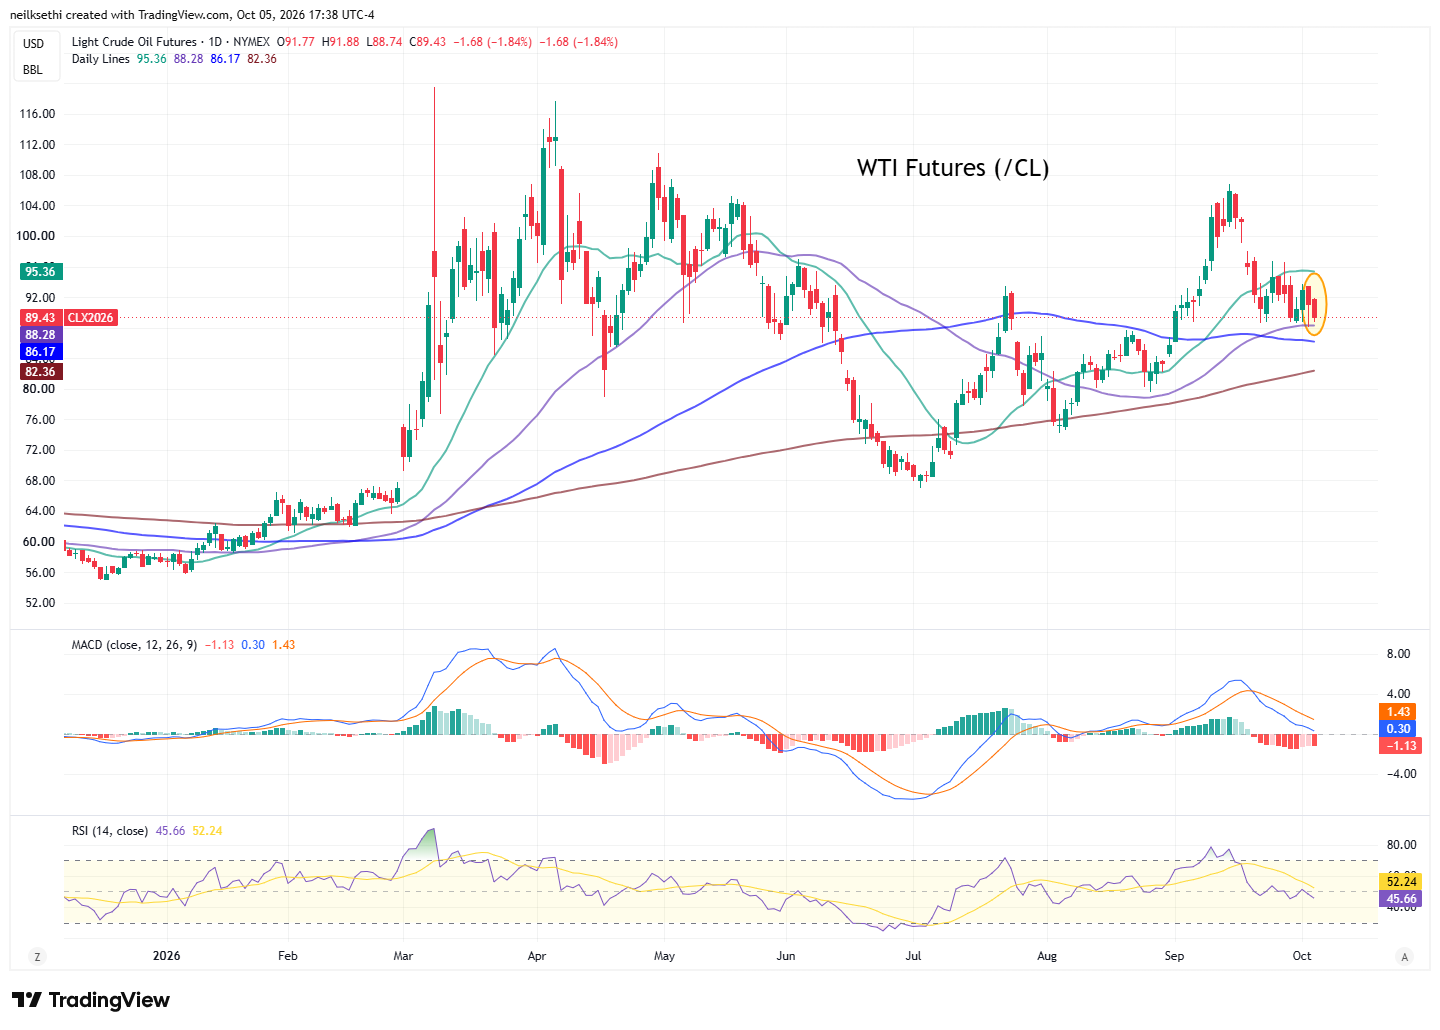
WTI futures (/CL) fell back around 2% again (including after-hours) but continues to find support at the 50-DMA.
The DXY dollar index (which is fixed weighted with a heavy (57%) weighting vs the euro), up to a fresh highest close since April 2025 .
As I mentioned three weeks ago “The daily MACD remains positive and the RSI is above 60 so it continues to have strong technical support.” I mentioned Thursday “This opens up a run higher, although it’s the most overbought since September 2023.”
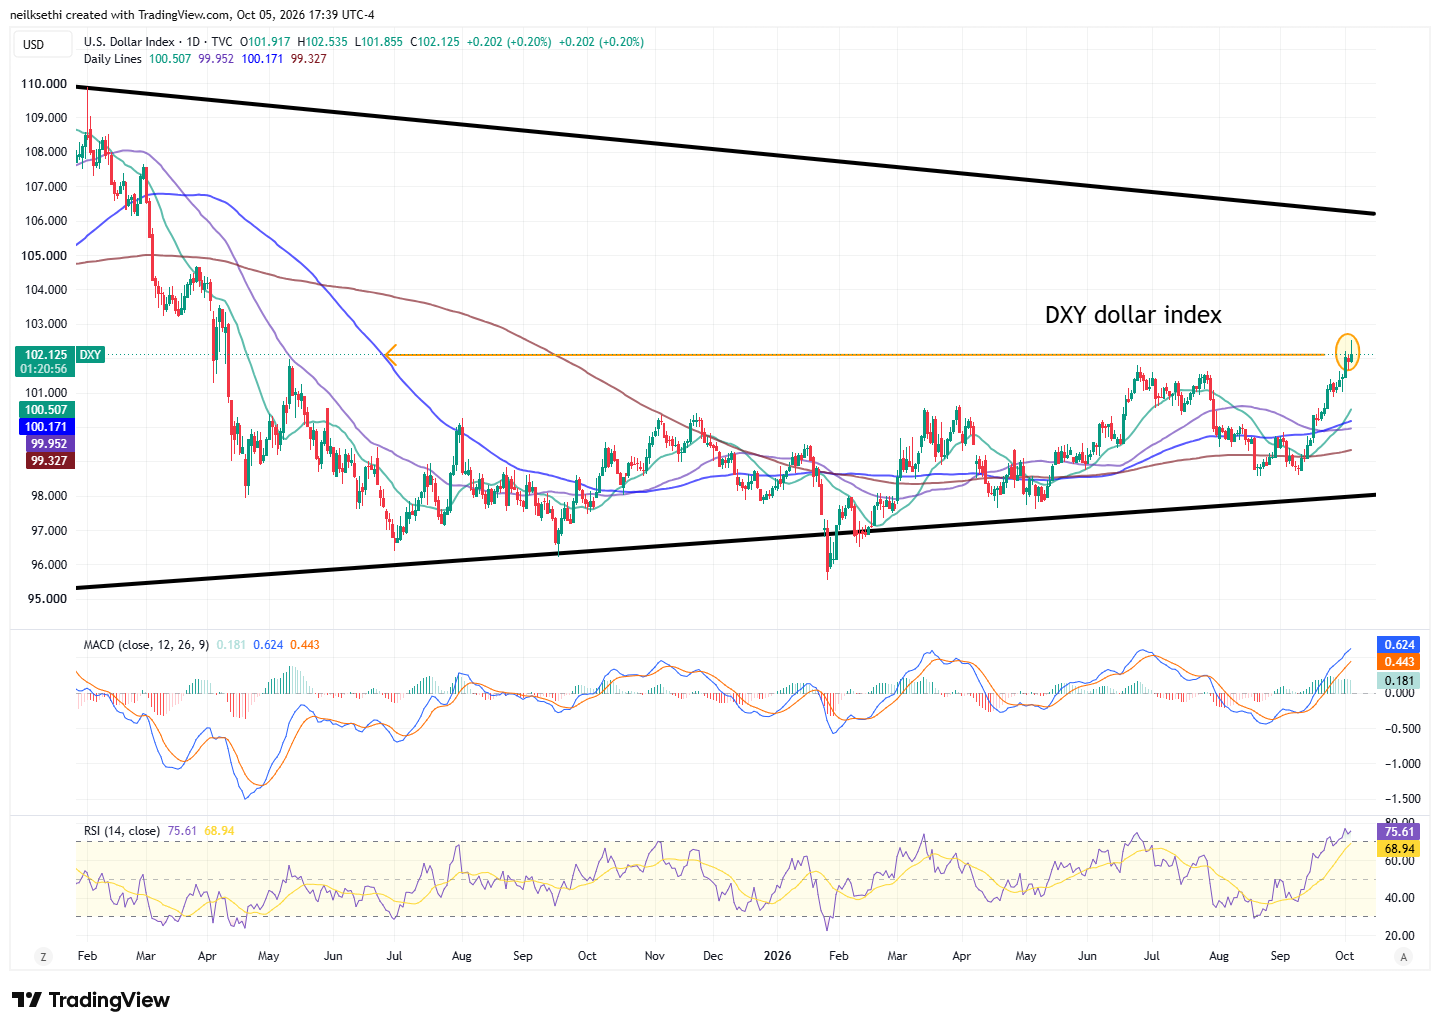
And to show how much the DXY weightings matter, Monday’s gain came despite the dollar losing almost 5% to the Brazilian real after fiscal conservative Flávio Bolsonaro’s better-than-expected first-round showing.
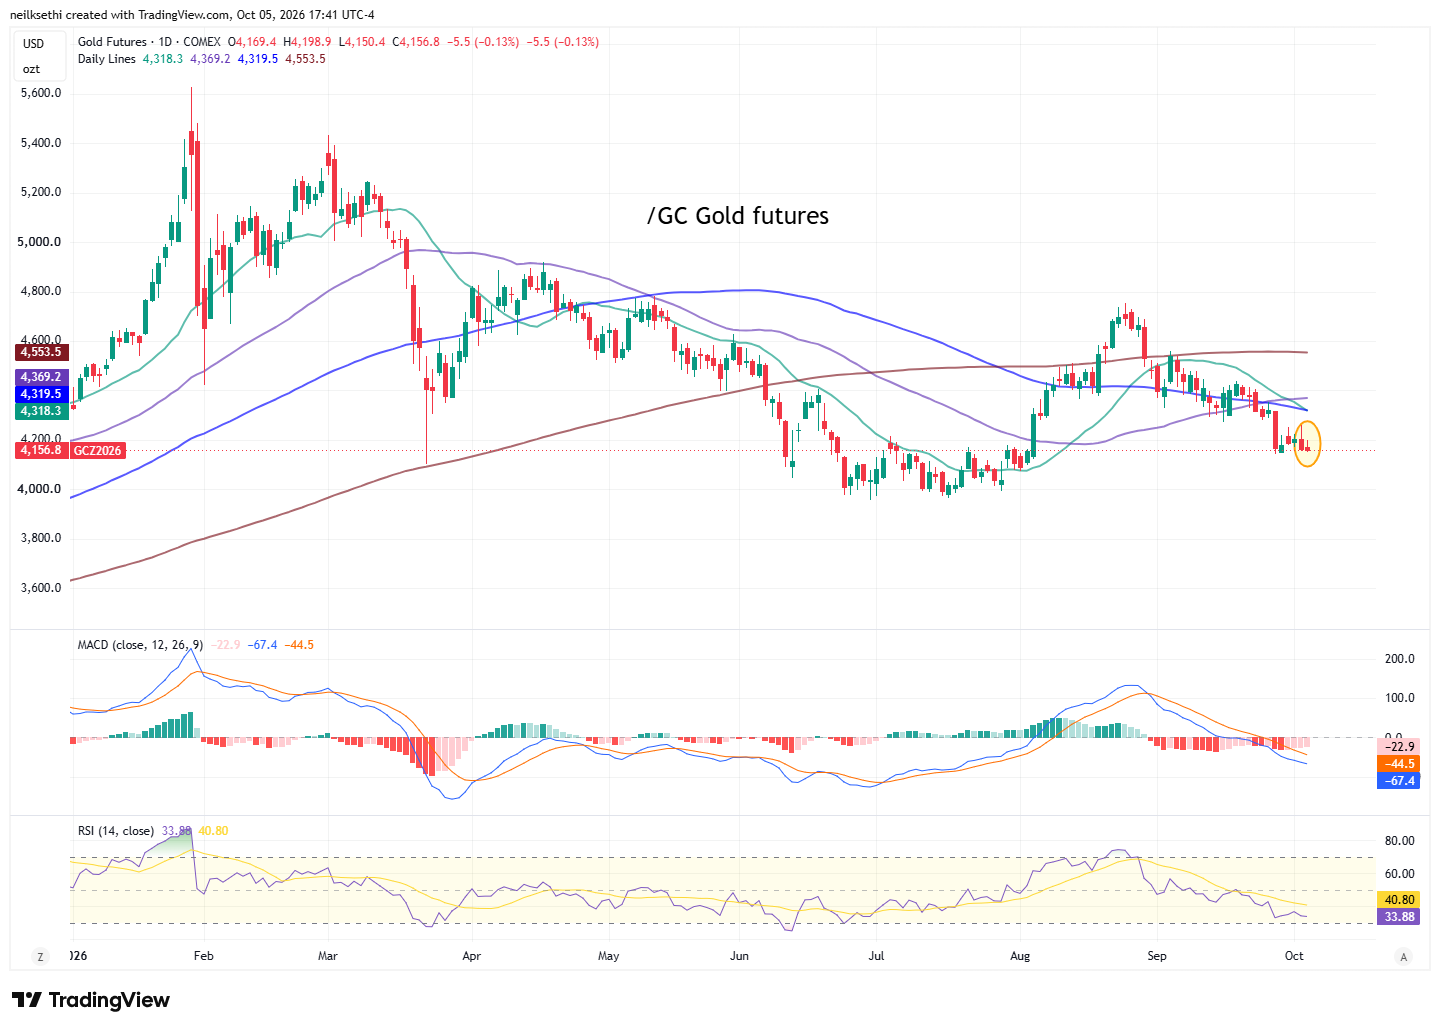
Gold futures (/GC) continue to hang on to support by the slimmest of margins. The daily MACD remains negative and the RSI is under 40, so not a lot of confidence that it holds.
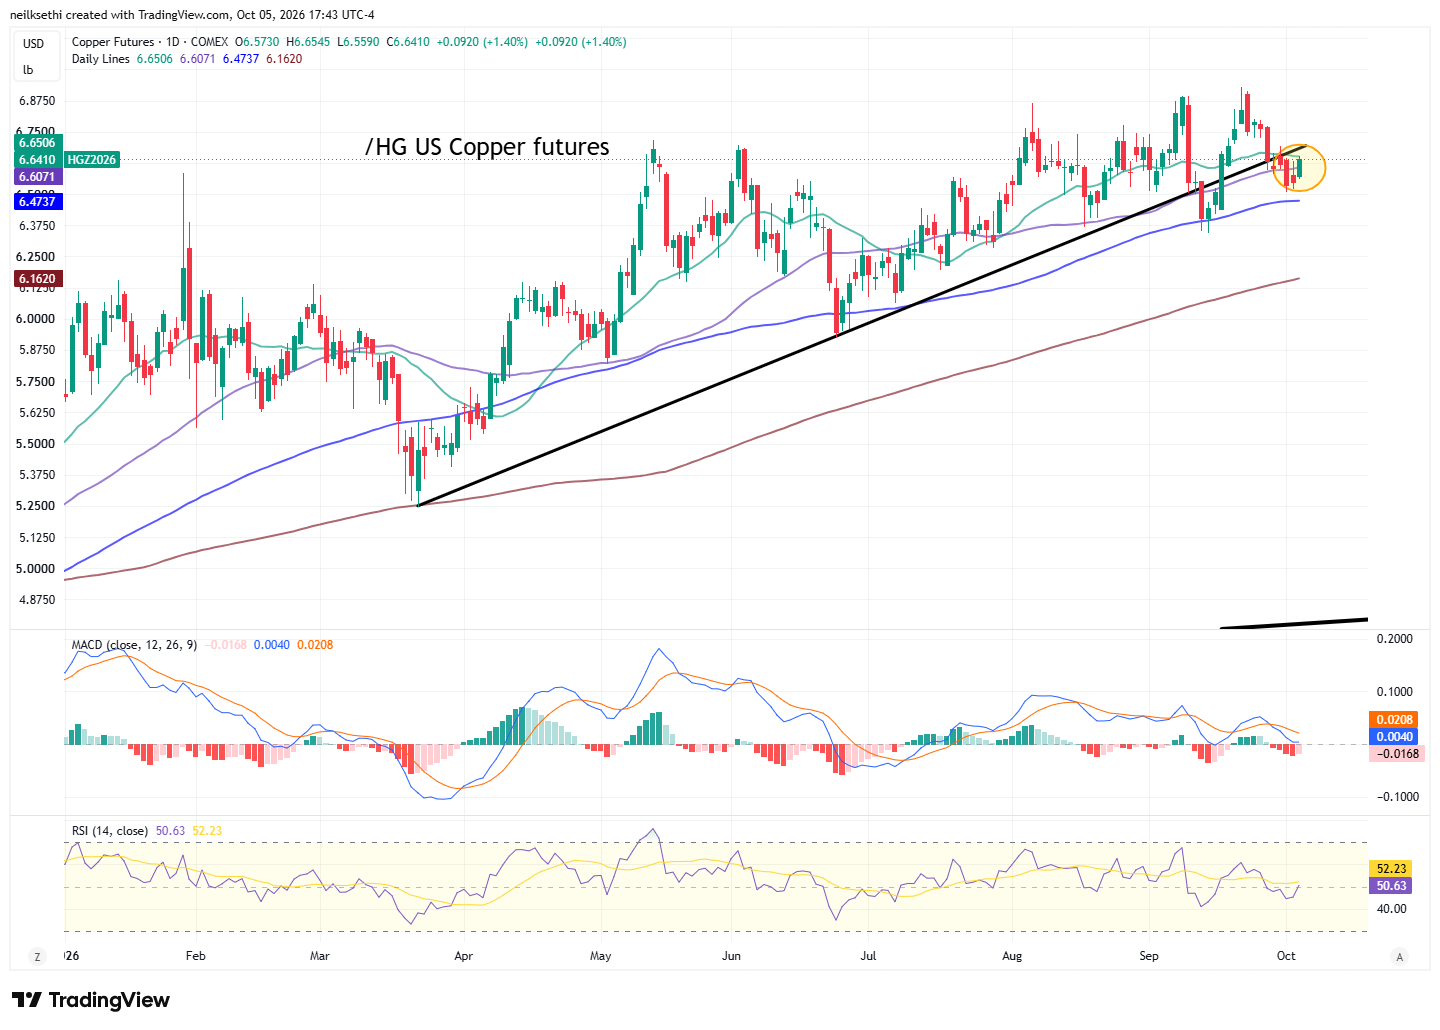
U.S. copper futures (/HG) finally able to make some progress lifting higher but stopped at some resistance. Daily MACD tilts negative while the RSI is neutral.
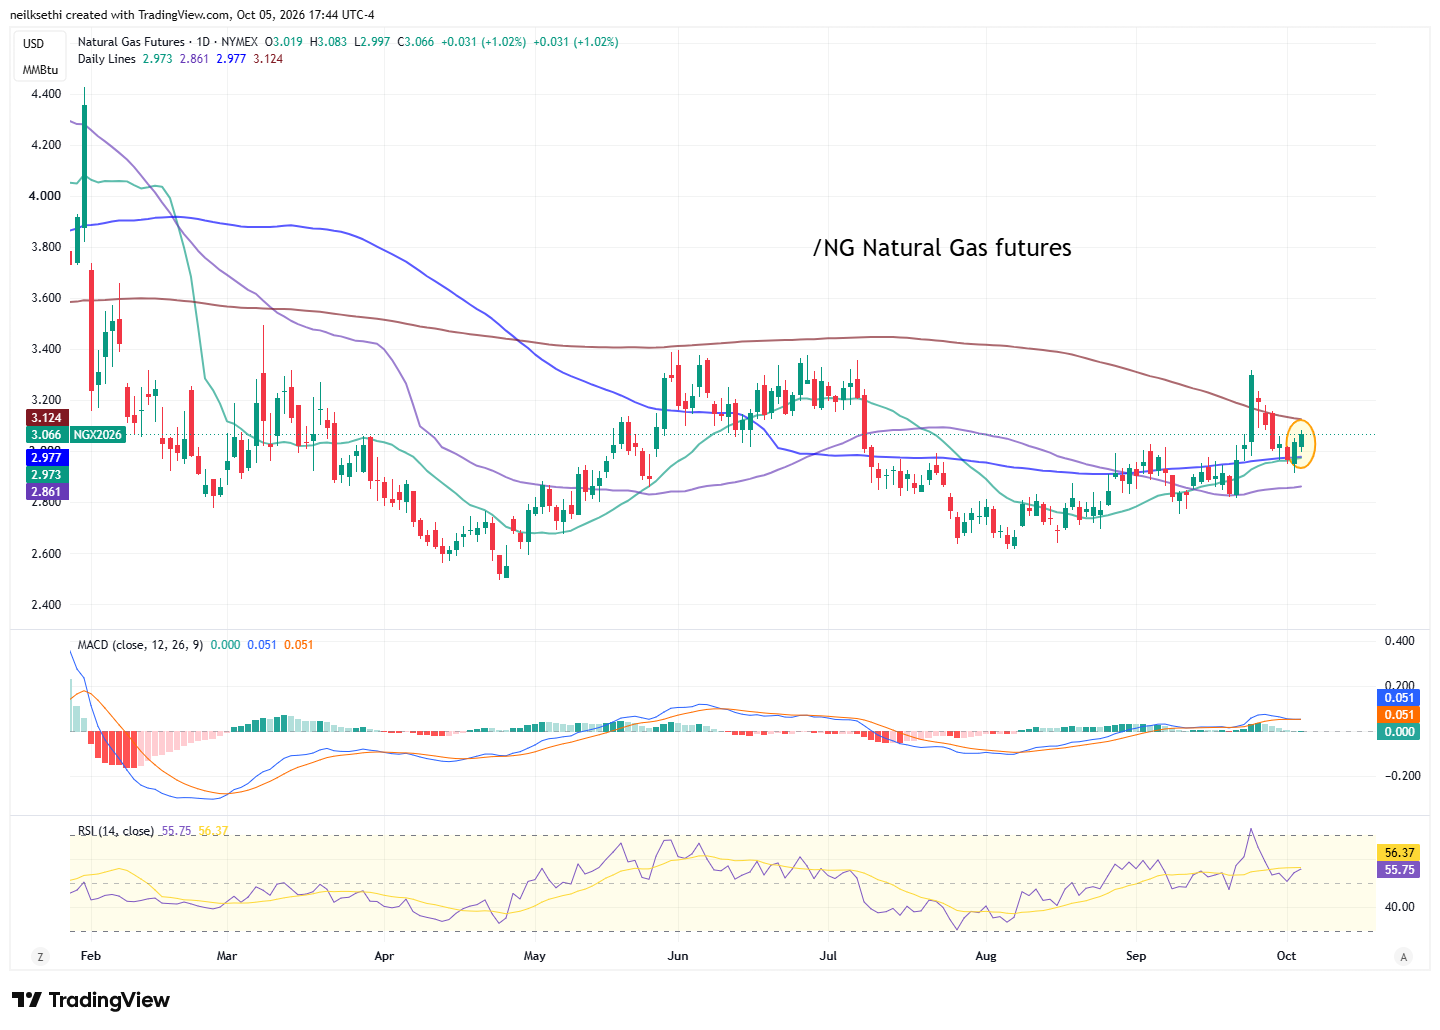
U.S. natural gas futures (/NG) up for a second day but overall in the middle of its trading range stretching back to March.
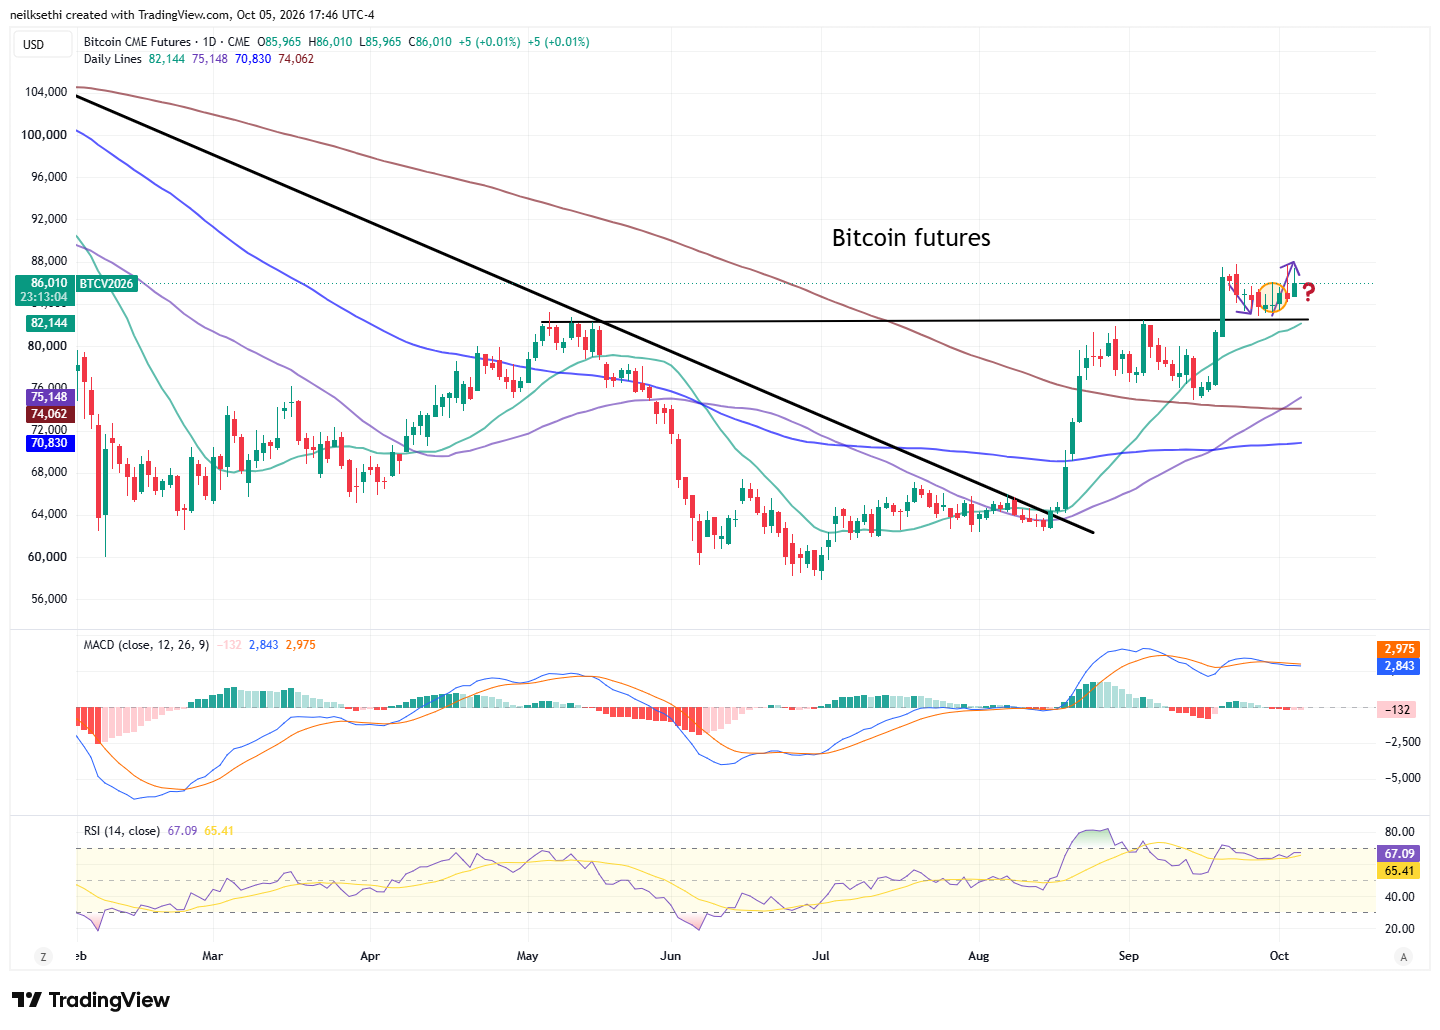
Bitcoin futures were again up over 1%, keeping alive the “potential path” (for bulls) I laid out two weeks ago (in purple). Daily MACD is neutral while the RSI remains solidly positive. Bulls are looking for a close above $88,000.
More From TheStreet Pro:
- Chris Versace –
- James “Rev Shark” DePorre –
- Helene Meisler – Everything You Wanted to Know About Technicals, but Were Afraid to Ask
- Bret Jensen – Way Up at the Top of This Wobbly Market Is One, Huge AI Trade
- Peter Tchir – Rapid Change in Euro Credit Risk Hints at Deeper Problems
And From Me If You Missed It:
- S&P Says Service Sector Is Running at Hottest Since 2021
- Services Keep Expanding, but Prices Climb to Highest Since 2022
Miscellaneous:
Wrap-Up: So Far So Good
I said Sunday
For now the setup remains constructive for the reasons mentioned above, and gamma levels remain high which should dampen volatility. So I’m starting the week eyeing higher levels — with, of course, a plan if indices go the other way.
So far so good, with the Tech trade continuing to power higher and joined by even more of the non-Tech stocks Monday (although breadth metrics remain weak). Technicals are also improving on the indices as we went through earlier. Now, if we could just get that softening in bond yields.
For now, though, not much to complain about. The light week continues Tuesday, so fingers crossed we continue to get another grind higher in equities.
The Day Ahead: The Light Week Continues
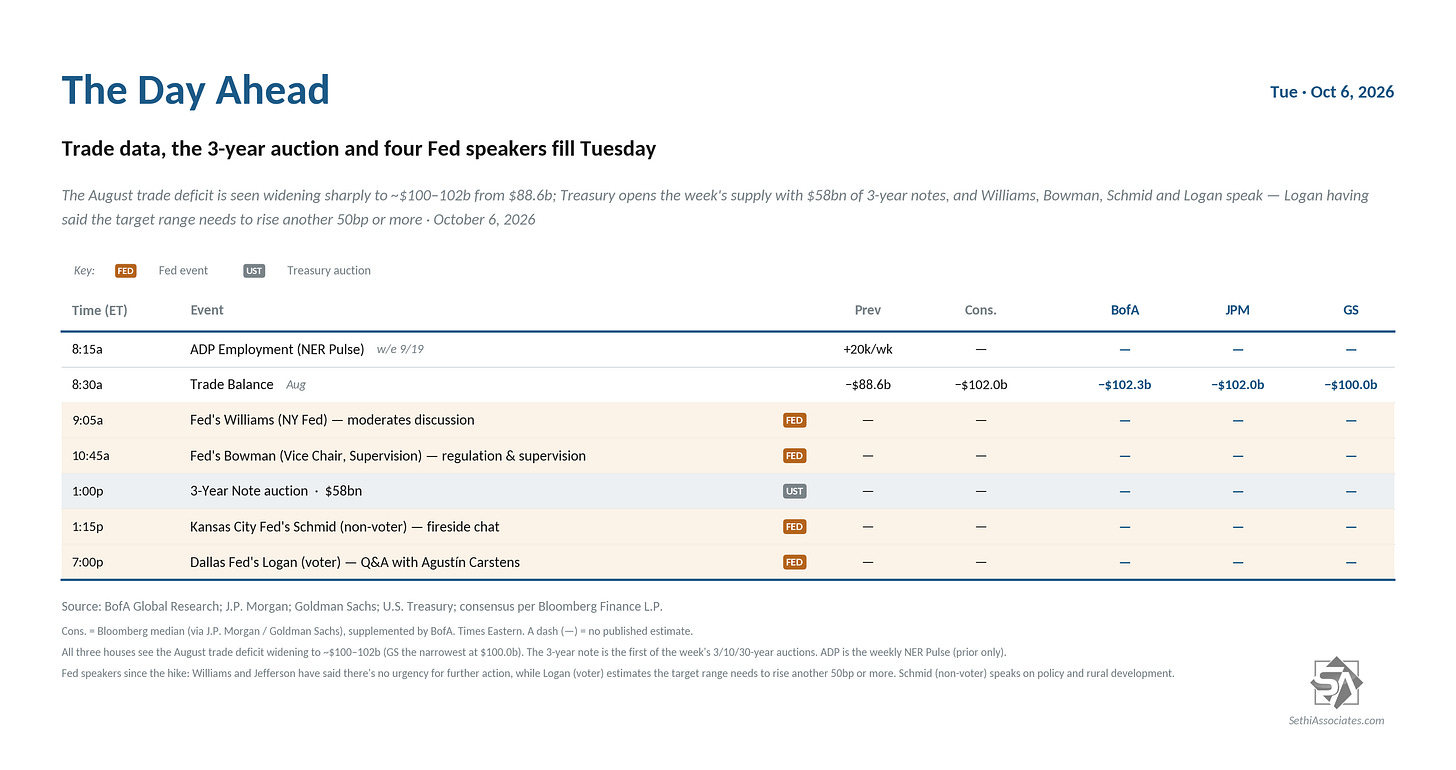
U.S. economic data Tuesday brings us just the August trade balance (as a reminder we already got the preliminary goods balance — around three-quarters of total trade — which was much more negative than expected, so this will have just small changes) and the ADP weekly report.
Fed speakers are heavier though with Governor Bowman and regional Fed presidents Williams, Schmid, and Logan on the calendar, all of whom we heard from recently, although Bowman has not commented on her stance on monetary policy since the September FOMC, so maybe we’ll get something on that.
Non-Bill (>1yr in maturity) U.S. Treasury auctions pick back up with 3-year notes.
Just one SPX component reporting Tuesday in Constellation Brands (STZ). Amazon’s (AMZN) Prime Big Deal Days event begins, kicking off the retailer’s fall holiday shopping push through October 7th.
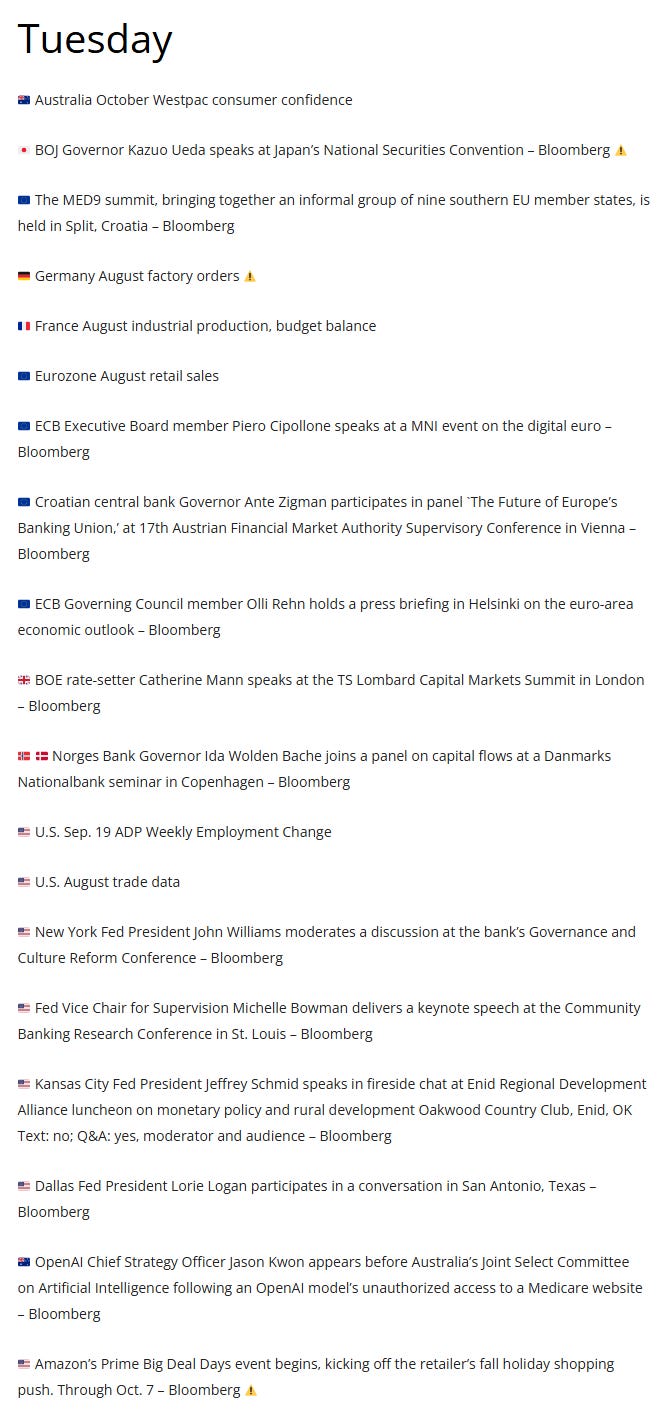
Ex-U.S. highlights include U.K. September construction PMI, Germany August factory orders, September construction PMI, France August industrial production, budget balance, Eurozone August retail sales, Canada August international merchandise trade.
From Christophe Barraud’s international Week Ahead rundown:
At the time of publication, in terms of equities mentioned, Sethi was long NVDA, META, AVGO, SPCX, TSM, MSFT, QQQ, SPY, RSP, IWM, CPER, IBIT, and numerous equities in the energy sector.
As a reminder comments are encouraged. If they are directed at me, please put @NeilSethi in front.



