September Monthly Roundup: 5 Focus Areas as Portfolio Keeps Its YTD Lead
We raised cash early, put some back to work late in the month, locked in gains on Meta and kicked off our quarterly EPS All-Stars reconstitution.
You've reached your free article limit
You've read 0 of 1 free Pro articles.
Coming into September, we flagged it as a month that has historically been challenging for the stock market, and it lived up to its reputation. The S&P 500 slipped 0.4%, while the Dow Jones Industrial Average fell 4.3%. The Nasdaq Composite managed a 1.9% gain, thanks to continued strength in AI-related technology shares, which made information technology the only S&P 500 sector to rise in September. Other sectors, such as financials, materials and REITs each fell roughly 7%. That captures rather well market breadth concerns that emerged as we moved through September.
Generally speaking, what weighed on the market was the combination of rising oil prices, sticky inflation and the climb in Treasury yields. The month kicked off with two oil supertankers struck by projectiles as they tried to exit the Strait of Hormuz, and as the Iran war ground on, oil, gas and diesel prices marched higher. By late September, the average price for a gallon of diesel topped $6.50 compared to $3.70 a year ago, while regular gas neared $4.50 versus $3.16.
On September 15, we discussed our margin-related concerns over the impact of higher diesel prices. Shortly thereafter we heard from J.B. Hunt Transport Services (JBHT) and several airlines about the impact of those higher energy prices. The move in energy prices was also captured in ISM’s September Manufacturing PMI and its Prices index, which jumped to 77.9, and S&P Global’s Flash September PMI pointed to a vibrant economy but also intensifying inflation pressures.
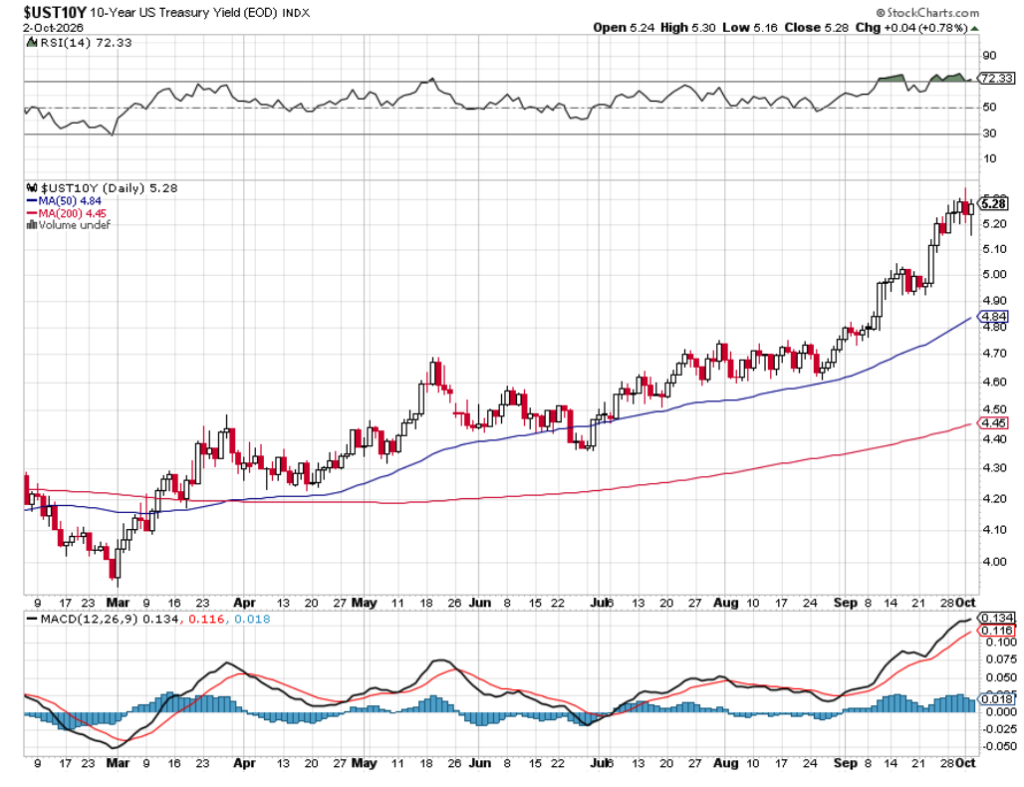
The 10-year Treasury yield climbed from roughly 4.7% at the end of August to 5.29% at the end of September, pushing past its 2007 peak, while the 30-year yield touched 5.60%, within a whisker of its 2002 high. As the risk-free rate climbs, it pulls capital from the market and raises questions about valuations, especially if investors are growing concerned over consensus EPS expectations. Meanwhile, the University of Michigan’s Consumer Sentiment Index fell to 48.1, below the starting point of every recession since the index began in 1978, with year-ahead inflation expectations jumping to 4.6%.
Mid-month, the Fed delivered the widely expected 25-basis-point rate hike, its first since 2023, in a 12-0 vote that lifted the Fed Funds rate to 3.75%-4.00%. More importantly, the updated Summary of Economic Projections (SEP) telegraphed one more hike before year-end, with neither PCE nor core PCE reaching the Fed’s 2% target until 2029. Fed Chair Warsh’s comments, which we found somewhat vague, did little to soothe the market. As we saw in the back half of September, Treasury yields did the rest.
Here’s the thing: Beneath the S&P 500’s modest monthly decline, market breadth was, in a word, horrible. In the last two months, only four of the 11 S&P 500 sectors advanced, and five stocks, Microsoft (MSFT), Meta (META), Apple (AAPL), Alphabet (GOOGL) and Nvidia (NVDA), delivered more than 90% of the index’s gains since late July. Fortunately, all five are Pro Portfolio holdings, as are Arista Networks (ANET), Marvell (MRVL) and Palantir (PLTR), and they helped us maintain our year-to-date lead over the S&P 500.
October has started off on a better foot. Yields pulled back from their highs on October 1 but rebounded to close out the past week. The October 1 fall reflected the softer-than-expected August PCE Price Index, with core PCE up 0.2% versus the 0.3% expected. And while the September Employment Report on October 2 was weaker than expected, reducing the chance of an October rate hike, inflation pressures remain a concern. That explains why even though the CME FedWatch Tool now shows the odds of a rate hike at the Fed’s October 28 meeting at roughly 22%, down from 68% on September 29, the expectation for a December rate hike spiked to ~67% compared to 36% a month ago.
On October 2, crude oil prices edged lower after the Group of Seven nations announced the release of 100 million barrels of diesel and crude oil reserves over the next four months, with a “substantial amount” in the next three weeks. Our thinking is that the G7 release will help cap soaring energy prices, but it will not permanently solve the underlying supply shortage. For that we will continue to see what unfolds between the U.S. and Iran, and implications for traffic through the Strait of Hormuz. Over the weekend, Iran’s position was the Strait will not reopen until seven Iranian conditions set out in a June interim agreement with the U.S. are met.
As we move past the first few days of October, we will focus on a few items. The first will be Marvell’s (MRVL) 2026 Investor Day on October 6. Following the shares’ near-25% September climb, expectations are high, and we’ll be listening for multi-year targets for custom silicon, electro-optics and margins, as well as read-throughs for Broadcom (AVGO), Arista Networks (ANET) and Nvidia (NVDA). Given our comments above about market concentration, Marvell’s forward comments will be closely scrutinized.
Second, the Q3 2026 earnings season will get underway in force following the Columbus Day holiday, and with companies having closed their books for the quarter last week, there is ample time for more negative earnings pre-announcements. As we’ve been saying, higher energy costs and interest rates mixed with sticky inflation strongly suggest some air will be let out of the S&P 500 consensus EPS balloon for H2 2026 and 2027.
Third, the Fed’s October 28 policy meeting, which lands just days before the midterm elections.
Fourth, oil, diesel and gas prices, and the developments between the U.S. and Iran that drive them.
Fifth, the IPO pipeline, including Anthropic’s listing, now expected in November, and the S-1 filing. We’ll be digging through that for insights on its spending plans and those implications for AI and data center-driven companies.
As we tick down that list, we will also be keeping a close watch on the S&P 500’s technical setup.
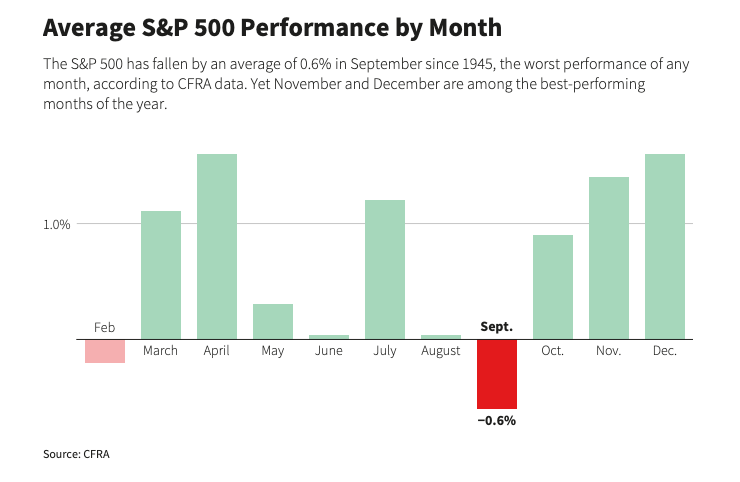
Historically speaking, October tends to be a positive month for the S&P 500 and as you can see below, October has historically marked the start of a seasonally strong move. However, if October brings more of the pressure we saw in September, our aim will be to do what we’ve done before: look for compelling risk-to-reward opportunities in and out of the Portfolio and prudently put capital to work in bite sizes that leave us room to maneuver. With cash still around 9% of the Portfolio’s assets, we have the dry powder to do just that.
Catching Up on the Portfolio
Like the S&P 500, the Portfolio shed some of its prior gains in September, but as mentioned above the composition of our holdings led us to maintain our year-to-date lead over that market benchmark. Exiting September, the Portfolio was up 12.94% year to date compared to 11.77% for the S&P 500. But just because the Portfolio held on to its lead doesn’t mean we’ll lose our focus and discipline, especially given the market’s narrow leadership heading into earnings season.
Notable September performers for the Portfolio included Meta (META), which soared nearly 27% as the market embraced its Muse AI agent, and Marvell (MRVL), which jumped almost 25%. Applied Materials (AMAT) rebounded more than 11%, and Eaton (ETN), Apple (AAPL), Arista Networks (ANET) and Nvidia (NVDA) all outpaced the S&P 500. Those gains were offset by the fall in Axon (AXON), which began with the company’s convertible note offering. Other decliners included Netflix (NFLX), Boeing (BA), American Express (AXP), Waste Management (WM) and Broadcom (AVGO).
September was a month of two halves for us. In the first, we raised cash as oil prices and Treasury yields climbed and the odds of a Fed rate hike rose. On September 1, we exited Builders FirstSource (BLDR), a move that limited further losses as that stock tumbled further during the month. The following week, we cleared out United Rentals (URI) in two tranches. On September 14, after OpenAI pushed its IPO timetable out to 2027 and as Treasury yields move higher, we exited Neostellar Capital (NSLR). On September 22, with Meta shares up more than 38% in a month and deep in overbought territory ahead of Meta Connect, we locked in big gains on a slice of shares and raised our checkpoint to $590.
But we did more than just take chips off the table and lock in gains in September. We added to Boeing (BA) on September 2 ahead of a likely union agreement, to Applied Materials (AMAT) on September 3 after Taiwan Semi said it had nearly doubled its equipment needs, and to Paccar (PCAR) on September 3 as August heavy truck orders soared. Following Axon’s notes offering, we picked up more shares, and we added to Boeing on September 16. We also added to the ROBO Global Robotics & Automation Index ETF (ROBO) and the Health Care Select Sector SPDR Fund (XLV) on September 17 and rounded out our position in TJX Companies (TJX) on September 18.
On September 30, following the softer-than-expected August PCE data, we put more capital to work in four beaten-down holdings: American Express, Axon, Boeing and Waste Management. With those trades, we upgraded Axon to a One rating from Two and reset checkpoints for all four.
Also on September 30, we started our quarterly EPS All-Stars reconstitution, exiting Eldorado Gold (EGO) with a roughly 15% gain for the quarter and Rocket Companies (RKT) with a roughly 23% loss. The Q3 2026 EPS All-Stars basket climbed more than 3% in September but finished the quarter down around 4%.
On October 1, we upsized the six remaining All-Stars constituents, Bloom Energy (BE), Ciena (CIEN), Lumentum (LITE), Micron (MU), SiTime (SITM) and Seagate Technology (STX), to 1% positions each and added Advanced Micro Devices (AMD) and Astera Labs (ALAB), bringing the basket to roughly 8% of the Portfolio’s assets.
Finally, on October 2, we downgraded Netflix to a Three rating and scooped up another slug of Boeing. The move with Boeing came after SPEEA members ratified new contracts and before the FAA determined that the 737 MAX software issue isn’t a safety concern, paving the way for MAX 10 certification.
Following that multitude of moves, the Portfolio’s cash position stands at roughly 8.7% of its assets. We’ve refreshed our shopping list, and should earnings season bring quality companies on sale, we’ll be ready to act. Should we see reasons to take profits in some of the strong September performers, we’re for that as well.
Key Global Economic Readings
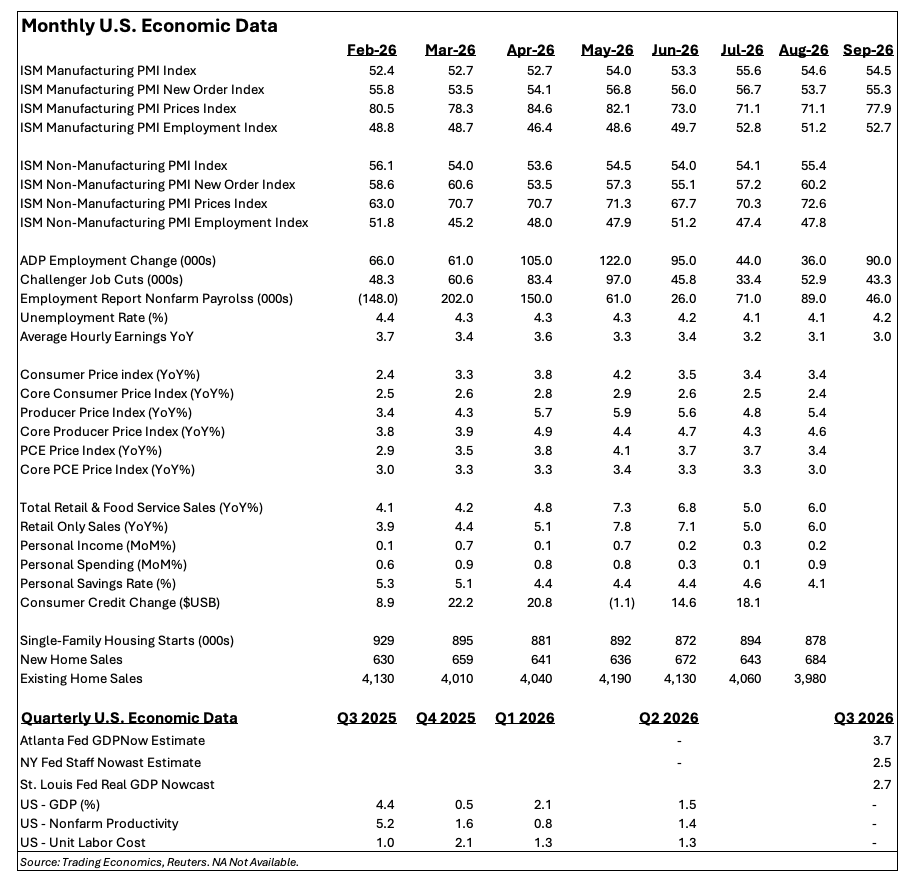
Chart of the Week: S&P 500 – Market Cap vs. Equal Weighted
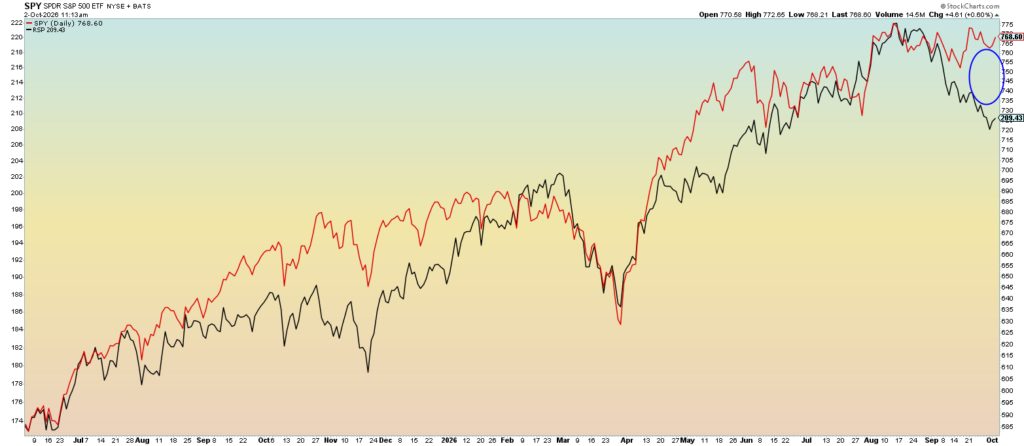
It has been a rough time for the broader market, isolating the weakness of the Invesco S&P 500 Equal Weight ETF (RSP) during the month of September. Recall our last look at State Street SPDR S&P 500 ETF Trust (SPY) vs. RSP there was notable congruence; the two ETFs moved nicely together and were making new highs.
But all the sudden things started to shift. With rates moving higher along with crude oil, investors/traders decided to “hide out” in certain names like the Magnificent Seven. In the short term that can work but longer term it won’t be healthy for the markets.
The decline of the RSP from the highs is around 8%, while the SPY is down a marginal amount. We like to see good breadth and a broadening out of the market to make sure most/all groups are getting some interest. If that is the case, there is a solid foundation underneath the markets and thus the economy.
However, when the SPY rules the day, it means the ETF is driven by a handful of names. As we see in the chart there are instances when this occurs, but the long-lasting effects are not positive. When divergences such as this current one persist, the SPY is the one that moves downward and often rather quickly.
Without being too microscopic on the chart here, we should recognize when these differences occur, be ready for a shift and watch for improvement. For the markets to have a strong and sustainable rally to end the year, we would like to see the RSP catch up to the SPY, broadening out the rally.
Other charts we shared with you this past week were:
Monday, September 28: S&P 500 – Leaving an Ugly September Behind
Monday, September 28: Marvell (MRVL) – Can Marvell Pull Off a Stunner Before Big Day?
Tuesday, September 29: TJX Companies (TJX) – The Basing Period Has Started on TJX
Wednesday, September 30: Toast (TOST) – Watching Toast as the Stock Gets Burned
Thursday, October 1: WTI Crude Oil (WTIC) – WTI Crude Remains in a Violent Uptrend
The Week Ahead
Coming off Friday’s disappointing September Employment Report and the sharp drop in October rate-hike odds, all eyes this week will be on the minutes from the Fed’s September meeting, out Wednesday afternoon. We’ll be reading them for the degree of conviction behind that one-more-hike call in the updated SEP, and we’ll match that against comments from a slew of Fed speakers during the week, including John Williams, Michelle Bowman, Lorie Logan, Alberto Musalem and Susan Collins.
Given the timing of the September Employment Report, we won’t be as focused on what ISM’s September Service PMI has to say about job creation. Instead, we’ll be that much more focused on what the findings say about inflation pressures and new order activity. The other key piece of data we’ll be tracking will be the September LMI Logistics Managers Index and what it reveals about inventory costs. Those data points mean we will be more interested in the comments from Fed officials made after the data are published.
Friday’s preliminary October University of Michigan Consumer Sentiment reading, and its inflation expectations figures, will round out the week.
With the market now expecting that G7 petroleum reserve release, we will also continue to monitor oil, gas, diesel, and related prices as well as developments between the U.S. and Iran.
Here’s a closer look at the economic data coming at us next week:
U.S.
Monday, October 5
S&P Global Final Services PMI (September) – 9:45 AM ET
ISM Services PMI (September) – 10:00 AM ET
Tuesday, October 6
LMI Logistics Managers Index (September) – 6:00 AM ET
ADP Employment Change Report (Weekly) – 8:15 AM ET
Imports/Exports (August) – 8:30 AM ET
Wednesday, October 7
MBA Mortgage Applications Index – Weekly (7:00 AM ET)
Used Car Prices (September) – 9 AM ET
EIA Crude Oil Inventories – Weekly (10:30 AM ET)
Consumer Inflation Expectations (September) – 11 AM ET
FOMC Meeting Minutes – 2 PM ET
Consumer Credit Change (August) – 3 PM ET
Thursday, October 8
Initial & Continuing Jobless Claims – Weekly (8:30 AM ET)
Wholesale Inventories (August) – 10 AM ET
EIA Natural Gas Inventories – Weekly (10:30 AM ET)
Friday, October 9
Michigan Prelim. Consumer Sentiment Index (October) – 10:00 AM ET
International
Monday, October 5
Japan: S&P Global Final Services PMI (September)
Eurozone: S&P Global Final Services PMI (September)
UK: S&P Global Final Services PMI (September)
Eurozone: Producer Price Index (August)
Tuesday, October 6
Germany: Factory Orders (August)
Eurozone: Retail Sales (August)
Wednesday, October 7
Japan: Leading Economic Index (August)
Germany: Industrial Production (August)
Thursday, October
Japan: Eco Watchers Survey Outlook (September)
Friday, October 9
Japan: Machine Tool Orders (September)
For the Portfolio, Tuesday brings Marvell’s (MRVL) Investor Day, and as we touched on above, we will be parsing updated forward comments on its custom silicon, data center and networking chips. We will also be looking out for September revenue reports from Taiwan Semiconductor (TSM) and Foxconn and what those figures mean for Q3 2026 market expectations. We’ll be sure to connect those learnings back to our positions in Broadcom (AVGO), Arista Networks (ANET), Eaton (ETN), and of course Nvidia (NVDA).
Tuesday and Wednesday mark Amazon’s (AMZN) Prime Big Deal Days, increasingly the unofficial start of the holiday shopping season, and we’ll be watching the level of promotional activity across retail. Costco (COST) will report its September sales after the market close on Wednesday, and we’ll once again put those adjusted comp sales figures under the microscope. We’ll also be following the number of open warehouse locations.
Outside the Portfolio, PepsiCo (PEP) on Thursday and Delta Air Lines (DAL) on Friday should offer a read on how diesel and jet fuel costs are hitting margins. In Delta’s comments we’ll be interested in what management says about its relationship with American Express. On the Q2 2026 earnings call, Delta management called out the spending strength for Amex-partnered cards and cited “continued momentum in both new card acquisitions and spend…” If that sentiment is reiterated later this week, that would be a nice shot in the arm for Amex and our shares.
Here’s a closer look at the earnings reports coming at us next week:
Tuesday, October 6
- Open: Apogee Enterprises (APOG), Lamb Weston (LW), RMP Inc. (RPM)
- Close: Constellation Brands (STZ), FedEx Freight (FDXF), Worthington Steel (WS)
Wednesday, October 7
- Close: Applied Digital (APLD), Levi Strauss (LEVI)
Thursday, October 8
- Open: Helen of Troy (HELE), PepsiCo (PEP)
- Open: Delta Air Lines (DAL)
Portfolio Investor Resource Guide
- Economic Data: Here’s a List of Links to the Key Economic Data We Closely Watch
- Investing Terminology: 16 Key Terms Club Members Should Know
- 10-Ks: Want to Know About a Stock? Read the Company’s Reports
- 10-Qs: Unlock the Numbers and Key Information Behind Your Stock With the 10-Q
- Income Statement: Our Cheat Sheet to Understanding This Financial Document
- Balance Sheet, Cash Flow Statements, and Dividends: How to Know If a Company Is Off-Kilter? Read Its Balance Sheet
- Valuation Metrics: Everyone Wants a Value. Here’s How Investors Can Find
- Thematic Investing 101 Webinar
- Like the Benefits of ETFs? Let’s Talk About Models
The Portfolio Ratings System
1 – Buy Now (BN): Stocks that look compelling to buy right now.
2 – Stockpile (SP): Positions we would add to on pullbacks or a successful test of technical support levels.
3 – Holding Pattern (HP): Stocks we are holding as we wait for a fresh catalyst to make our next move.
4 – Sell (S): Positions we intend to exit.
ONES
American Express AXP; $304.10; 760 shares; 3.67%; Sector: Financial Services
UPDATE: Shares of American Express (AXP) fell 7.9% in September and coupled with their moves in July and August finished Q3 2026 down just over 10%. Renewed inflation pressures and higher Treasury yields weighed on the shares, but when Amex management appeared at the Barclays Global Financial Services Conference on September 16, it reminded investors that card fees are up 16% year to date, and that growth is expected to accelerate over the balance of 2026. Billings growth has stepped up to 8%-9% on an FX-adjusted basis, led by travel and entertainment, and management pointed to full-year revenue growth of roughly 10% while holding its EPS guidance. We also like that Gen Z and Millennials now make up 65% of new consumer accounts, with Gen Z delinquency rates running 40% below those of Gen X and Baby Boomers combined. On the macro front, the University of Michigan Consumer Sentiment Index fell to 48.1 in September, but August retail sales rose a better-than-expected 1.2%, and Amex’s well-off card members continue to spend. On September 30, we picked up more AXP shares for the Portfolio at $305.25. We will continue to track the delta between income growth and inflation but remember the key to Amex’s business and its bottom line continues to be trends in average fee per card and the number of cards in force. With the shares closing September above our $275 checkpoint, we’ll look to Amex’s Q3 2026 results on October 23 for confirmation that card fee growth is accelerating as telegraphed. Our $400 price target and One rating remain intact.
September Price Change: -7.9%; Yield: 1.3%
INVESTMENT THESIS: American Express is a globally integrated, membership-driven payments company, providing customers with access to products, insights, and experiences that enrich lives and build business success. The company has four reportable operating segments: U.S. Consumer Services (USCS), Commercial Services (CS), International Card Services (ICS), and Global Merchant and Network Services (GMNS). American Express targets the premium consumer space by continuing to deliver membership benefits that span our customers’ everyday spending, borrowing, travel, and lifestyle needs, expanding its roster of business partners around the globe, and developing a range of experiences that attract high-spending customers. In 2025, the company’s net card fee revenue accounted for 72% of its pre-tax income, which we see as providing a differentiated business model that should continue to grow as Amex wins new card members and drives its average fee per card higher.
Target Price: Reiterate $400; Rating: One
Checkpoint: $275
RISKS: Slowdown in consumer spending, competition, membership growth, merchant acceptance, and lack of new product innovation.
Applied Materials AMAT; $511.38; 451 shares; 3.89%; Sector: Semiconductors
UPDATE: Shares of Applied Materials (AMAT) rebounded 11.6% in September, recapturing a good portion of their sharp July-August pullback and validating our late-August and early September moves to rebuild the position. As we noted in the September trade alert, chip industry capacity is going to remain tight for some time, and that reinforces our view that AMAT will have pricing power. Rising orders and pricing power bode well for fixed-cost absorption and margin expansion. Two other items helped fuel the subsequent move higher in AMAT shares during September. First, at the Citi Global TMT Conference on September 8, CFO Brice Hill shared that the eight-quarter rolling forecast from Applied’s largest DRAM and leading-logic customers has risen every quarter this year. Hill also noted Applied is tracking more than 100 fab projects around the globe and that memory makers are shifting from upgrading existing lines to building new fabs, which require roughly four times the equipment investment. Advanced packaging, a smaller but fast-growing business, is guided to grow more than 70% this year. Second, semi-cap equipment shares rallied as a group on September 18, with Applied’s shares jumping nearly 7% a day after Applied unveiled a roughly $5 billion, decade-long investment plan in India. To us, that India plan is a long-term footprint and supply chain story, not a near-term revenue driver. Connecting the dots to Micron, its September 30 report included higher capital spending plans for fiscal 2027, with management pointing to demand visibility for AI-driven high-bandwidth memory extending through the decade. That is exactly the kind of customer commitment that underpins Applied’s October-quarter revenue guidance of $9.75 billion to $10.75 billion. The one known headwind remains China export controls, which management expects to cost Applied around $600 million in fiscal 2026 revenue. With the shares closing September at $511.38, we see ample upside to our $800 price target. Next up is Semicon West from October 13 to 15, where we’ll be listening for comments on clean room capacity, which management has flagged as the gating factor for equipment demand, and pricing.
September Price Change: 11.6%; Yield: 0.4%
INVESTMENT THESIS: The outlook for semiconductor capital equipment, an industry that delivered ~$133 billion in 2025, remains very bright. SIA sees industry deliveries rising to $145 billion this year and $156 billion in 2027, and others see a continued step function higher through 2030. Underpinning that forecast is continued spending on AI and data centers, and corresponding equipment, as well as other connected devices, including appliances as well as cars and trucks. Applied Materials holds a leading position in the global semiconductor wafer fabrication equipment (WFE) market, with a market share estimated at approximately 19% in 2025. As a broad-portfolio supplier, it dominates in deposition (44% share) and maintains a strong presence in etch, CMP, and ion implantation tools. Major customers include TSMC, Samsung, Intel, SK Hynix, and Micron, along with key partnerships involving Apple and Texas Instruments
Target Price: Reiterate $800; Rating: One
Checkpoint: $425
RISKS: Customer capital spending levels, currency, and economic risk.
Axon Enterprise AXON; $422.52; 460 shares; 3.04%; Sector: Aerospace & Defense
UPDATE: September was a rough month for shares of Axon ($AXON), which fell 25.4% to close at $422.52. The bulk of the pressure came on September 15, when Axon announced plans to float $1 billion in 0% convertible senior notes due 2031, with an over-allotment option of roughly $150 million. The notes priced that evening with a conversion price of $652.06, and the transaction brought an extreme amount of pressure on the shares, which fell almost 10% that day on nearly four times their average daily volume. Here’s the thing: While the offering lifts Axon’s total debt to roughly $2.9 billion from the $1.75 billion in notes it had exiting Q2 2026, coverage ratios measured against the $934.2 million in adjusted EBITDA expected this year and $1.27 billion in 2027 should quell concerns. Add in $15.1 billion in future contracted bookings and $1.6 billion in annual recurring revenue, and the business case remains intact. With that transaction-related pressure poised to ease, we began rebuilding the position we trimmed at just over $600 in early July, adding shares near $443 on September 16 and resetting our checkpoint to $390. As the shares moved lower, we added again near $425 on September 30. Given the compelling risk-to-reward tradeoff relative to our $700 price target, we also upgraded the shares to a One from a Two and reset our checkpoint to $380. One development we’re watching: Flock Safety, which operates an estimated 120,000 to 130,000 automated license plate reader cameras across 49 states, is reportedly weighing a sale amid scrutiny over surveillance and data privacy. Should Axon move to acquire Flock, it would build on its own ALPR efforts, deepen its law enforcement relationships, and enhance its positioning for higher-margin software and services offerings. Next up is the IACP 2026 Annual Conference between October 24-27 that is likely to result in several new Axon product introductions. Axon’s September-quarter report is likely to come in early November. We’ll also be looking for further gains in the company’s future contracted bookings, which should improve visibility for the 2027 and 2028 consensus EPS figures of $10.63 and $13.63 compared to $7.64 this year and $6.85 in 2025. Keeping us long-term bullish on Axon shares, the company’s product and services are estimated to make up roughly 1%–5% of a police department’s budget. Management estimates Axon is about 15% penetrated in its state and local market and puts its total addressable market at about $159–160 billion, which it bills as a conservative figure. Measured against the $3.7 billion in consensus revenue for this year and the $4.79 billion for 2027, that suggests Axon has ample opportunities for market-share gains in the coming quarters.
September Price Change: -25.4%; Yield: 0.0%
INVESTMENT THESIS: Axon Enterprise develops, manufactures, and sells conducted energy devices and cloud-based digital evidence management software designed for use by law enforcement, corrections, military forces, private security personnel, and private individuals for personal defense. The company operates in two segments: Taser (recently renamed Connected Devices) and Software & Sensors (recently renamed Software & Services). Taser develops and sells CEDs used for protecting users and virtual reality training. Software & Sensors manufactures fully integrated hardware and cloud-based software solutions such as body cameras, automated license plate reading, and digital evidence management systems. Axon delivers its products worldwide and gets most of its revenue from the United States. According to Mordor Intelligence, the wearable and body-worn cameras market on its own was valued at $1.62 billion in 2020 and is expected to reach $424.63 billion by 2026. Public safety organizations are increasingly adopting cloud solutions, leading to significant spending in this area. The digital spending in public safety is projected to reach $201 billion by 2027.
Target Price: Reiterate $700; Rating: One
Checkpoint: $380
RISKS: Manufacturing and supply chain, competitive factors, government regulation, and technology change.
Broadcom Inc. AVGO; $351.19; 588 shares; 3.33%; Sector: Technology
UPDATE: Shares of Broadcom (AVGO) slipped 5.2% in September, even though the company kicked off the month with results and a multi-year outlook that, in our view, were compelling. For the July quarter, Broadcom delivered EPS of $3.32, $0.10 ahead of consensus, on revenue that jumped 85.5% to $29.59 billion. AI semiconductor revenue grew 221% year over year and 54% sequentially to $16.7 billion, and orders received in the quarter topped $30 billion. October-quarter guidance calls for revenue of $34.80 billion, a touch ahead of consensus, with AI semiconductor revenue reaching $21.7 billion, up 236% year over year. The bigger story came on the earnings call. CEO Hock Tan raised Broadcom’s fiscal 2027 AI revenue target to about $115 billion from more than $100 billion, set a $230 billion target for fiscal 2028, and shared that Anthropic is expected to become Broadcom’s largest XPU customer in 2027. Management also touted a long-term agreement with Google to supply future generations of TPUs, worth multi-tens of billions of dollars annually, a direct pushback on concerns following Google’s expanded relationship with Marvell. Tan also reiterated the outlook for EPS above $30 in fiscal 2028, which puts the shares at a PEG ratio near 0.2 entering the final quarter of the year. Even if we haircut those figures, it’s hard to argue the shares aren’t cheap, which is why we maintained our One rating and multi-year $525 price target. Late in the month the FT reported that Chinese authorities are surveying the use of Broadcom switches in state-backed data centers. Per Broadcom’s 10-K, China accounted for 17% of 2025 revenue, though a substantially smaller share depends on end customers there. Even so, in today’s market that report raises questions management will need to answer eventually. With the shares comfortably above our $330 checkpoint, upcoming catalysts we’re watching are September revenue reports and quarterly earnings from Taiwan Semi and Foxconn as well as Marvell’s October 6 Investor Day. To that list we can add the public S-1 filing for Anthropic as well as forward-facing comments shared during that upcoming IPO roadshow. We continue to see Broadcom’s custom AI silicon and networking businesses benefiting from rising AI adoption and expanding usage, especially with Nvidia being capacity constrained and Broadcom customers bringing their chip to third-party customers. While we have some room to spare in the Portfolio’s AVGO position size, given the ones we have in Nvidia and Marvell as well as AMD that is now in the EPS All-Stars basket, we’ll be mindful when it comes to the Portfolio’s overall AI and data center chip exposure.
September Price Change: -5.2%; Yield: 0.7%
INVESTMENT THESIS: We became shareholders in Broadcom to participate as the company benefits from the buildout of digital infrastructure, including AI, data center, and custom AI chips, as well as demand for its software and services segment, which includes private cloud, mainframe software, cybersecurity, and enterprise software. Broadcom reports its business in two segments – Semiconductor Solutions (58% of sales and 51% of operating income) and Infrastructure Software (42%, 49%). The Broadcom management team has developed a track record of delivering organic growth and growth by acquisition, with the latter positioning the company to better position itself to meet developing demands. More recent acquisitions include Brocade Communications, CA, Inc., Symantec Enterprise Security, and VMware.
Target Price: $525; Rating: One
Checkpoint: $330
RISKS: Economic, governmental regulations, geopolitical developments, cyclical, and investment risk.
Costco Wholesale COST; $910.34; 230 shares; 3.38%; Sector: Consumer Staples
UPDATE: Despite another round of strong sales data, shares of Costco (COST) slipped 3.6% in September, closing the month at $910.34, just above our $900 checkpoint. Costco kicked off September by reporting that August net sales rose 9.9% to $23.70 billion, with adjusted comparable sales up 5.4% even though a later Labor Day weighed on the month by a little less than 75 basis points. Comparing Costco’s monthly comp sales figures against those for other companies, including Walmart (WMT), Target (TGT) and other retailers that reported, it was pretty evident that Costco is winning share. On September 24, Costco closed out its fiscal year with Q4 2026 net sales up 11.2% to $93.9 billion and EPS of $6.75, which included a $0.15 benefit from tariff refunds. U.S. comps rose 10.7%, or 7.2% excluding gas and FX, and digitally enabled sales climbed 19.5%. The number of paid members rose 3.8% to 84.1 million, but executive members grew 9.4% to 42.3 million, and the U.S./Canada renewal rate held at 92.3%. That mix shift toward executive members bodes well for membership fee income, which rose 7.3% to $1.85 billion, even as the benefit from the 2024 fee increase laps. Odds are the market will stay focused on member growth now that tailwind is fading, which makes the roughly 28 new warehouses planned for fiscal 2027 all the more important. To us, the key to Costco’s business is the relationship between growing the number of warehouse locations, which feeds the membership revenue stream and merchandise volumes. Provided Costco doesn’t make the location-over-saturation mistake we’ve seen from the likes of Starbucks and others, we are inclined to remain owners of the stock to capture further upside and the benefit of future special dividend payments. Meanwhile, the macro backdrop continues to favor Costco. August CPI showed gasoline prices up 27.4% year over year, and year-ahead inflation expectations in the September University of Michigan survey jumped to 4.6% from 4.0%. That reinforces our view that consumers will lean further on Costco’s value proposition, especially with the prospect of inflation pressures continuing as we approach the holiday shopping season and the season’s eatings. With the shares near our $900 checkpoint, we’ll be watching Costco’s September sales report due on October 7 and subject to what that report brings, we may top off our COST exposure.
September Price Change: -3.6%; Yield: 0.6%
INVESTMENT THESIS: We like Costco’s long-term prospects, driven by a club-based operating model that focuses on volumes, not margins, and therefore offers its customers a value proposition of everyday low prices. The strength of this model has created an incredibly loyal customer base with low churn and continued share gains in both brick-and-mortar and e-commerce. This is a global concept, evidenced by the strength of sales both in the U.S. and abroad, which includes an emerging China opportunity. We see the company’s membership model as a key differentiator versus other retailers, and its plans to open additional warehouse locations in the coming quarters should drive retail volumes and the higher-margin membership fee income as well. We also appreciate management’s approach to capital returns and their willingness to return cash.
Target Price: Reiterate $1,150; Rating: One
Checkpoint: $900
RISKS: Inability to pass through higher costs, fuel prices, weaker consumer, and membership churn.
Nvidia Corp. NVDA; $228.38; 970 shares; 3.62%; Sector: Technology
UPDATE: Shares of Nvidia (NVDA) rose 3.4% in September to $228.38 and added to those gains in early October, closing at $233.95 on October 2. The key data point came on September 17, when CEO Jensen Huang said Nvidia expects to double its chip sales next year. That builds on the 70% growth management guided to for the fiscal year ending January 2028, which equates to roughly $673 billion. When Nvidia reported its July quarter, Huang also flagged available chip capacity as a constraint, so his latest comments suggest the company is finding ways around those limits. More importantly, they reinforce our view that despite recent AI-related headlines, rising AI adoption and usage continue to drive data center capacity and chip demand. Supporting data points included record August revenue from Foxconn, up 52% year over year, and a strong August report from Taiwan Semiconductor. Piper Sandler also initiated coverage with an Overweight rating and a $300 price target, which matches our own. Nvidia is flexing its balance sheet once again, with Reuters reporting it could invest up to $10 billion as an anchor investor in Anthropic’s IPO. Anthropic also agreed to lease 460MW of capacity for six years at Nscale’s West Virginia campus, covering Nvidia Vera Rubin chips expected to come online late next year. Given Anthropic’s appetite for compute, these moves should help secure future demand. Elsewhere, GF Securities pointed to a faster-than-expected ramp in Nvidia’s co-packaged optics business. If we have a concern, it’s less about Nvidia’s demand profile and more about the market’s narrow leadership, with five stocks, Nvidia among them, delivering more than 90% of the S&P 500’s gains since late July. In late September, Nvidia’s board approved a $150 billion increase to the company’s share-repurchase program, bringing the total buyback authorization to $235 billion. While certainly sizable, it compares to the company’s near $5.7 trillion market cap. Upcoming catalysts include September monthly sales reports from Taiwan Semi and Foxconn as well as Marvell’s October 6 Investor Day. We will also be scrutinizing hyperscaler and neocloud capital spending comments for H2 2026 and initial ones for 2027 when they report their Q3 2026 results. While we have a relatively full position in NVDA shares, given the positions in Broadcom and Marvell as well as AMD that is now in the EPS All-Stars basket, we’ll be mindful when it comes to the Portfolio’s overall AI and data center chip exposure.
September Price Change: 3.4%; Yield: 0.4%
INVESTMENT THESIS: Nvidia is well-positioned to benefit from ramping AI and data center spending. The company pioneered accelerated computing to help solve the most challenging computational problems. Nvidia is now a full-stack computing infrastructure company with data-center-scale offerings that are reshaping the industry. The company’s full stack includes the foundational CUDA programming model that runs on all Nvidia GPUs, as well as hundreds of domain-specific software libraries, software development kits, or SDKs, and Application Programming Interfaces, or APIs. This deep and broad software stack accelerates the performance and eases the deployment of Nvidia accelerated computing for computationally intensive workloads such as artificial intelligence, model training and inference, data analytics, scientific computing, and 3D graphics, with vertical-specific optimizations to address industries ranging from healthcare and telecom to automotive and manufacturing. Nvidia reports in two business segments: Compute & Networking and Graphics. The Compute & Networking segment (78% of revenue, 85% of operating income) is comprised of Data Center accelerated computing platforms and end-to-end networking platforms, including Quantum for InfiniBand and Spectrum for Ethernet; NVIDIA DRIVE automated-driving platform and automotive development agreements; Jetson robotics and other embedded platforms; Nvidia AI Enterprise and other software; and DGX Cloud software and services. The Graphics segment (22% of revenue, 15% of operating income) includes GeForce GPUs for gaming and PCs, the GeForce NOW game streaming service and related infrastructure; Quadro/NVIDIA RTX GPUs for enterprise workstation graphics; virtual GPU, or vGPU, software for cloud-based visual and virtual computing; automotive platforms for infotainment systems; and Omniverse Enterprise software for building and operating metaverse and 3D internet applications.
Target Price: $300; Rating One
Checkpoint: $175
RISKS: Market and interest rate risk, credit risk, country risk, and operational risk, including cybersecurity.
Paccar Inc. PCAR; $109.81; 1,335 shares; 2.34% Sector: Industrials
UPDATE: The fall that began in August accelerated in September for shares of heavy and medium duty truck company Paccar (PCAR), leaving them down 8.6% for Q3 2026. FTR’s mid-September report showed 2026 Class 8 orders through August up 111% from a year earlier and most model-year 2026 engine build slots without extra surcharges are likely full. September is the first full month of ordering for model-year 2027 trucks. The EPA’s comment period on its proposed revisions closed August 29, and a final rule comes next. The proposal keeps the 2027 NOx standard intact. While we picked up some additional shares for the Portfolio in early September, as diesel prices and Treasury yields rose, we opted to stay on the sidelines with PCAR shares. Exiting September, the shares are in a deeply oversold condition. ISM’s September Manufacturing PMI showed that part of the economy continued to expand during the month and faster level of growth in new order activity bodes well for that continuing. The catalyst we are waiting for with PCAR shares is preliminary September class 8 order figures. Class 8 orders cluster in the September-to-February order season, when OEMs open build slots. While many are focused on the climb in diesel prices, as we pointed out in our September 24 alert, what the less informed are not contemplating is the 2027 EPA mandate, accelerated depreciation under the One Big Beautiful Bill, and the average age of the heavy duty truck market is around 6.3 years per data from ACT Research, on par with the 6.4 figure for 2019, when truck production levels last peaked. There also wasn’t accelerated depreciation back then, and one can make the case that average age is a reason for owners and operators to upgrade to more fuel-efficient models that have close to a 20% reduction in fuel consumption compared to those produced before 2024. The key with PCAR shares is higher truck production levels give way to operating leverage and higher EPS.
September Price Change: -11.5%; Yield: 1.3%
INVESTMENT THESIS: Paccar is a multinational company that reports in three operating segments: Truck (68% of sales), Parts (24%), and Financial Services (8%). Paccar’s heavy-duty and medium-duty trucks are marketed under the Kenworth, Peterbilt, and DAF nameplates. Key factors affecting the Truck segment earnings include the number of new trucks sold in the markets served and the margins realized on the sales. The Portfolio’s play with Paccar shares is the pull forward in truck demand ahead of the EPA 2027 mandate that will result in tougher 2027 NOx engines regulations and add ~$10,000 to the cost of truck. Helping soften that blow, business owners and owner-operators can utilize 100% bonus depreciation (restored by the One Big Beautiful Bill Act) or Section 179 expensing to write off the entire purchase price of a qualifying heavy commercial vehicle, including new Class 8 and Class 5-7 trucks. With data from ACT Research finding the average age of a U.S. Class 8 tractor is 6.3 years, the highest in more than a decade, the ability to fully depreciate a new truck in its first year is likely a factor helping to drive replacement demand. The pull forward in demand should drive favorable operating leverage inside Paccar, and that is what we aim to benefit from by owning the shares.
Target Price: $155; Rating: One
Checkpoint: $110
RISKS: Commercial truck demand, competition and industry pricing, inflation, and interest rate risks.
TJX Companies TJX; $132.31; 1,750 shares; 3.71%; Sector: Financial Services
UPDATE: After their double-digit drop in August, shares of TJX Companies (TJX) stabilized in September, slipping just 1.2% to close the month at $132.31. Mid-month, we added to the Portfolio’s TJX position at $127.86, using an oversold condition to do so. Early in September, Morgan Stanley put an Overweight rating and $178 price target on the shares, framing TJX as a consumer compounder and characterizing the softness at Marmaxx as a temporary self-inflicted issue that has likely moved into the rearview mirror. Management plans to grow its store base toward 7,500 locations remains a multi-year driver. September’s economic data only added to the tailwind we see for off-price retail. August retail sales rose 1.2%, with clothing and accessories stores up 0.7%, while August CPI showed apparel prices up 3.6% year over year. With gasoline up 27.4% year over year, the University of Michigan Consumer Sentiment Index fell to 48.1 in September as consumers grew more worried about high prices and their personal finances. Simply put, cash-strapped consumers looking to stretch their spending dollars, especially as we head into the holiday shopping season, is the backdrop TJX is built for. Between now and TJX’s October-quarter results in November, we’ll be watching for evidence that the Marmaxx fixes are taking hold, as well as data points on holiday spending plans and consumer disposable income levels. While the Portfolio has a relatively full plate of TJX shares, we will continue to identify compelling risk-to-reward levels for members who are underweight TJX shares relative to the Portfolio’s position size.
September Price Change: -1.2%; Yield: 1.5%
INVESTMENT THESIS: The TJX Companies is the leading off-price apparel and home fashions retailer in the United States and worldwide. It has over 5,200 stores and six branded e-commerce sites that offer a rapidly changing assortment of quality, fashionable, brand-name, and designer merchandise at prices generally 20% to 60% below full-price retailers’ regular prices on comparable merchandise. The company operates in four segments: Marmaxx and HomeGoods, both in the U.S.; TJX Canada, and TJX International. TJX looks to capitalize on opportunities to acquire merchandise at substantial discounts that regularly arise from the production and flow of inventory in the apparel and home fashions marketplace. These opportunities include, among others, closeouts from brands, manufacturers, and other retailers; special production direct from brands and factories; order cancellations; and manufacturer overruns. We see that positioning TJX extremely well, as consumers feel the pinch of ongoing inflation pressures and their efforts to stretch the disposable spending dollars they do have, including tapping discounted shopping locations. When TJX reported its January 2026 quarter, management shared plans to grow the company’s footprint. During the May 2026 earnings call, management signaled they are actively evaluating raising their long-term store count target beyond 7,000, pointing to adjacent markets and new ventures. Exiting the April 2026 quarter, TJX’s total store count stood at 5,262 locations.
Target Price: $185; Rating: One
Checkpoint: $110
RISKS: Operational, strategic buying programs, and competitive risks, as well as consumer spending patterns.
Waste Management WM; $203.92; 942 shares; 3.08%; Sector: Industrials
UPDATE: After moving lower in August, shares of Waste Management (WM) fell another 6.9% in September, making them a drag on the Portfolio’s Q3 2026 performance. We attribute much of that move to the cumulative move in diesel prices, which we flagged in an alert to members on September 15. On September 21, the day before diesel prices hit a multi-year record level, we discussed the 2023 switch by Waste to energy surcharges tied to the price of diesel and compressed natural gas that powers most of its collection fleet. The energy surcharge fluctuates up or down based upon changes in the reported prices of diesel fuel and/or natural gas, as reported by the U.S. Department of Energy in its weekly diesel price index and by the Henry Hub spot price index for natural gas. During Waste’s Q2 2026 earnings call, management shared that it saw $175 million in higher energy surcharges for the year, and odds are that, given the climb in diesel prices since then, that number has moved higher as well. At the same time, let’s consider that Waste not only continues to wring out cost synergies with the healthcare business, but it is still converting its residential fleet to automated side loader trucks. At last check, the company was around two-thirds of the way through converting its residential fleet to automated side-loader trucks. As for our thesis, nothing in September changes our view that WM remains a margin-driven story, helped by pricing actions, pruning of less profitable routes, and further integration of the Healthcare Solutions business. With more than 70% of its 2026 free cash flow target of $3.75 billion to $3.85 billion in hand at the halfway mark, we continue to see the potential for that target to move higher. Those factors led us to pick some additional WM shares for the Portfolio on September 30 at $206.43. The next known catalyst will be the company’s quarterly results on October 27.
September Price Change: -6.9%; Yield: 1.9%
INVESTMENT THESIS: Waste Management’s revenue by reportable segment is 61% collection, 21% disposal, 10% healthcare solutions, 6% recycling, and 2% renewable energy. AS you can see, the core business is the inelastic waste removal business for residential, enterprise, and other customers. The company has built its footprint through a series of acquisitions and excelled at wringing costs out of them, driving free cash flow, dividends, and funding incremental acquisition activity. While the residential business is sticky, the commercial business should continue to benefit from non-residential construction activity. Margins should continue to inch higher due to disciplined pricing and increasing use of automation. We are in the early days of WM Healthcare Solutions, but we see the business growing as management integrates and cross-sells against its core business and flexes the ability to integrate nip-and-tuck acquisitions as it has at the core waste business. Here, too, we see room to consolidate a fragmented industry, which makes this a natural fit for Waste Management.
Target Price: $265; Rating: One
Checkpoint: $187
RISKS: Industry and economic risk, competition and competitive pressures, and acquisition risk.
TWOS
Alphabet GOOGL; $344.08; 600 shares; 3.29%; Sector: Communication Services
UPDATE: Shares of Alphabet (GOOGL) edged up more than 1% in September, but that wasn’t enough to offset modest declines earlier in Q3 2026. The shares faded from their September 21 high near $355 and remain within the $335-$350 band of resistance we flagged in August. September brought several data points supporting Google’s position in the AI race. Oppenheimer substantially raised its Google Cloud estimates following a deep dive on TPUs, forecasting about $170 billion in cumulative incremental TPU sales through 2028 that aren’t in Wall Street estimates. That translated to 15% to 30% upside to Street cloud revenue and 4% to 18% upside to consolidated EPS in 2027-2028. A group of 10 banks also provided a $22 billion loan to Crux AI, the Blackstone-Alphabet cloud venture, to fund TPU purchases, another sign TPUs are gaining traction beyond Google’s own data centers. Waymo also expanded to Denver, San Diego and Tampa, bringing its fully autonomous ride service to 14 cities, an early but growing source of data center demand. Oppenheimer’s AI survey found Gemini is the second most used AI behind ChatGPT, and that consumers trust Google about four times more than Meta with their passwords. That’s a meaningful edge as AI agents like Meta’s Muse need access to personal data to work. On September 30, Google unveiled Gemini 4 Argon, and we continue to think that Google remains well positioned across search, YouTube, cloud and AI. We’ll look to Alphabet’s September-quarter results for updates on the cloud backlog and TPU monetization, the catalysts that could break the shares out of the current trading range. Beyond the company’s operating segments, Google is one of the largest institutional holders of SpaceX (SPCX) with 551.2 million shares. Other holdings include 2 million shares of Arm Holdings (ARM), 8.9 million of AST SpaceMobile (ASTS), 35.2 million shares of Planet Labs (PL), and 3.5 million shares of CME Group (CME). To that we will add the expanded relationship with Marvell, which includes a warrant to purchase up to 58.97 million MVRL shares at $206.58 subject to qualifying product purchases. We’ll want to keep these positions in mind as we revisit out GOOGL price target but also assess potential gains or losses below Alphabet’s operating line. It’s also possible that some of those investments, when monetized, could be sources of funding for Google’s capex plans.
September Price Change: 1.4%; Yield: 0.3%
INVESTMENT THESIS: We believe that while search and digital ad dominance are what will carry the shares in the near-to mid-term, longer-term, it is the company’s artificial intelligence “moat” that will provide for new avenues of growth. Alphabet surpassed 350 million paid subscriptions across Google One and YouTube. AI is what has made the company’s search, video, and targeted ad capabilities best-in-class and is the driving force behind the company’s success in voice (Google Home) and autonomous driving (Waymo). Furthermore, we believe it is this AI expertise that will also make the company more prevalent in other industries, including healthcare via its subsidiary Verily, as AI and machine learning continue to disrupt operations across industries. As of mid-2026, Google’s Gemini app had over 900 million monthly active users. Adding to our positive view of the company’s future opportunities, we believe that Alphabet’s free cash flow generation and solid balance sheet set it apart and are what will allow the company to continue taking chances on far-out, ground-breaking, and potentially world-changing projects, as well as fund capital returns to shareholders. We will continue to monitor advertising spend as well as the competitive landscape for the company’s core Search and Advertising business.
Target Price: Reiterate $410; Rating: Two
Checkpoint: $305
RISKS: Regulatory risk (data privacy), competition, and macroeconomic slowdown impacting consumers and therefore ad buyer activity.
Amazon AMZN; $249.15; 801 shares; 3.22%; Sector: Consumer Discretionary
UPDATE: While shares of Amazon (AMZN) fell 4.1% in September, they closed Q3 2026 up more than 4%, double the gain recorded for the S&P 500 over the same period. In September, several items weighed on the shares. First, diesel prices climbed to roughly $6.27 a gallon in mid-September compared to $3.66 a year ago, which could pressure margins in Amazon’s North America and International segments given its sizable and growing delivery fleet. Let’s remember, though, that Amazon Web Services and the fast-growing, high-margin advertising business can limit the impact on the bottom line. Second, on September 25, Anthropic committed $11.6 billion over seven years to Akamai for CPU workloads, a reminder that backing an AI heavyweight doesn’t secure every dollar of its computing budget. That said, AWS exited the June quarter with a $496 billion backlog and a 39% operating margin, and management expects capacity constraints to persist into 2027. Amazon also blocked Meta’s Muse AI agent from shopping on its site, a move that protects its customer relationship and advertising business but highlights the coming battle to control agentic shopping. Turning to the holidays, Prime Big Deal Days return October 6-7, increasingly the unofficial start of the holiday shopping season. We continue to see Amazon and its expanding same-day Prime Service and grocery effort taking share as consumers look to pinch their pennies. Deloitte forecasts holiday retail sales up 4.0% to 4.8%, with e-commerce up 7.5% to 8.4%, while Bain sees nonstore sales up 9%. With gas prices nearing $4.50 a gallon and other inflationary forces hitting disposable incomes, the larger question is the level of promotional activity needed to win shoppers, which will shape margin expectations. In August, we said a move near the 200-day moving average would have us revisiting our Two rating. The shares remain above that level, but we continue to watch that relationship closely, especially as we head into what is the seasonally strongest time of the year for Amazon. When Amazon reports its Q3 2026 results, we will be focusing on AWS adoption, capacity and capital spending as well as incremental investment spending to further expand the reach of the company’s Prime service. Comments about AI adoption and customer silicon demand will also be on our watch list.
September Price Change: -4.1%; Yield: 0.0%
INVESTMENT THESIS: We believe that upside will result from Amazon’s continued e-commerce dominance, AWS’s continued leadership in the public cloud space, and the ongoing growth of the company’s advertising revenue stream, which feeds off Amazon’s e-commerce business. Additionally, we think profitability will continue to improve as AWS and advertising account for a larger portion of total sales, as both these segments sport higher margins than the eCommerce operation. While we believe the increasing share of the revenue from these higher-margin businesses will be key to driving profitability longer-term, we think margins on eCommerce stand to improve as the company’s infrastructure is further built out and economies of scale further kick in. The embedded call option is that management is always looking to enter a new space and generate new revenue streams. Outside of the company’s core businesses, per recent 13F-HR filings, Amazon holds a stake of 158.36 million shares in Rivian, 225,428 shares in Marvell, as well as positions in other companies. It has also committed to a $50 billion investment in OpenAI.
Target Price: Reiterate $325; Rating: Two
Checkpoint: $225
RISKS: High valuation exposes the stock to volatile swings, e-commerce has exposure to slower consumer spending and competition, potential headwinds resulting from new e-commerce regulation in India, and management is not scared to invest aggressively for growth, which can at times cause volatile reactions as near-term concerns arise relating to the impact on margins.
Apple AAPL; $333.02; 750 shares; 4.00%; Sector: Technology
UPDATE: Shares of Apple (AAPL) climbed 5.1% in September, touching a new intraday all-time high of $345.34 on September 22 before closing the month at $333.02. For Q3 2026, AAPL shares rose a hefty 15.1% compared to the S&P 500 gain of 2%. The main catalyst for AAPL shares was Apple’s September 9 event, where it unveiled the iPhone 18 Pro and Pro Max, which went on sale September 18 with base prices $100 above last year’s models. Apple also introduced its foldable iPhone Duo, which opens for pre-orders on October 16 and arrives October 23, along with the Apple Watch Series 12, Apple Watch Ultra 4, and AirPods 5. Just as important to us, iOS 27 was released on September 14, bringing the overhauled Apple Intelligence and Siri features that we see as the key to unlocking an upgrade cycle among the hundreds of millions of iPhones that can’t run them. Early demand data have been encouraging. According to JPMorgan, delivery lead times for the iPhone 18 Pro stretched to 23 days from 7 days in week two, while those for the Pro Max moved to 30 days from 19, both steeper increases than for last year’s iPhone 17 Pro. In week three, those lead times barely eased. We’d caution that lead times reflect supply as well as demand but paired with higher price points across the iPhone lineup, they support our view that the market could be underestimating Apple’s December-quarter revenue. On the flip side, memory and component cost pressures remain something we’re watching for margins. Between now and Apple’s September-quarter results in late October, we’ll be tracking reception to the iPhone Duo and early shipment data. Preorders for the Duo begin on 16 and devices are slated to hit shelves on October 23. Ahead of Apple’s quarterly earnings report, we’ll be digging into September revenue metrics from Taiwan Semiconductor and Foxconn as well as TSM’s Q3 2026 earnings report on October 15. Subject to what we learn, we’ll look to revisit our AAPL price target as needed. We will also be looking to see if, as market chatter suggests, Apple holds an October event focused on overhauling its smart home ecosystem and introduce its new smart home hub.
September Price Change: 5.1%; Yield: 0.3%
INVESTMENT THESIS: While we acknowledge that near-to-mid-term performance remains heavily influenced by iPhone sales, the dynamic is shifting as investors finally place greater emphasis on Services growth. We are bullish on the 5G upgrade cycle and believe longer-term upside will continue to come as Services revenue grows its share of overall sales. Services provide for a recurring revenue stream at higher margins, a factor that serves to reduce earnings volatility while allowing for a higher percentage of sales to fall to the bottom line; as a result, we believe that Services growth and the installed base are much more important than how many devices the company can sell in each 90-day period. In addition to improved profitability, we also believe the transparent nature of this revenue stream will demand an expanded price-to-earnings multiple as segment sales grow. Furthermore, we believe that Apple’s desire to push deeper into the healthcare arena will help make its devices invaluable as more life-changing features are added and the company works to democratize health records.
Target Price: Reiterate $350; Rating: Two
Checkpoint: $280
RISKS: Slowdown in consumer spending, competition, lack of new product innovation, elongated replacement cycles, and failure to execute on Services growth initiatives.
Arista Networks ANET; $203.59; 1,100 shares; 3.64%; Sector: Technology
UPDATE: Shares of Arista Networks (ANET) added to their July and August gains in September, climbing 4.0%, making them a stronger performer for us in Q3 2026. For that three-month period, ANET shares soared just shy of 20%. Several industry developments in September reinforced our view on the company and its shares. EPS All-Stars resident Ciena raised its multi-year outlook, calling for a revenue CAGR of 30% between 2026 and 2029, which bodes well for networking demand. Evercore ISI followed by upgrading Ciena, arguing that connectivity between and inside data centers is becoming a critical gating factor for AI and that optical networking is emerging as a bottleneck in the AI buildout. That’s the same argument underpinning our bullishness on Arista. Nvidia CEO Jensen Huang’s expectation that chip sales will double next year should also translate into more networking ports to connect them. On October 1, Bernstein initiated coverage with an Outperform rating and a $250 price target. As a reminder, following Arista’s Q2 results and upsized guidance, we lifted our price target to $225 from $180, and we will look to revisit that target as we digest Marvell’s October 6 Investor Day, hyperscaler and neocloud earnings and updated capex plans, especially from key customers Microsoft and Meta. To the extent adoption and usage of Meta’s Muse surprises to the upside, Arista would be a likely beneficiary. When Arista reports its Q3 2026 results, backlog levels will be one of the items we track closely and so will what the management team says about component shortage and related capacity constraints.
September Price Change: 4.0%; Yield: 0.0%
INVESTMENT THESIS: Arista Networks engages in the development, marketing, and sale of data-driven, client-to-cloud networking solutions for AI, data center, campus, and routing environments in the Americas, Europe, the Middle East, Africa, and the Asia-Pacific. Its cloud networking solutions consist of Extensible Operating System (EOS), a publish-subscribe state-sharing networking operating system offered in combination with a set of network applications. The company offers data center, cloud, and AI networking, cognitive adjacencies, and cognitive network software and services. It also provides post-contract customer support services, such as technical support, hardware repair, and replacement parts beyond standard warranty, bug fixes, patches, and upgrade services. The company serves a range of industries comprising internet companies, cloud service providers, financial services organizations, government agencies, media and entertainment, healthcare, oil and gas, education, manufacturing, industrial, and others. Two of Arista’s largest customers in the last few years are two Portfolio holdings you’ll quickly recognize — Microsoft and Meta. Per Arista’s 10-K filings, both Meta and Microsoft each account for more than 10% of revenue. Other named customers include Amazon’s AWS, Google Cloud, Anthropic, Canva, SAP, Shopify, Apple, Oracle, Bank of America, and Accenture.
Target Price: $225; Rating: Two
Checkpoint: $145
RISKS: Economic, customer, supply chain, and competition risks.
Bank of America Corp. BAC; $54.43; 3,999 shares; 3.3%; Sector: Financial Services
UPDATE: Shares of Bank of America (BAC) fell just over 12% in September as IPO activity stalled and CEO Brian Moynihan said the bank’s Q3 2026 sales and trading revenue would be flat year over year. During that early September investor conference presentation, Moynihan also shared expectations for BofA’s investment banking fees to decline about 10% year over year. Following the seasonally slow pace of IPO activity in August, we noted that coming into September we would be closely monitoring that activity, looking to see if a seasonal rebound unfolded. Early in the month, OpenAI CEO Sam Altman told Fortune the company won’t make its public market debut in 2026, a decision he tied to making “confident safety decisions” rather than market conditions. As the 10-year Treasury yield climbed through September, we saw market conditions cool IPO prospects. Nuclear power services firm Holtec Nuclear and CVC Capital Partners-backed Bamboo Insurance Services postponed their offerings within days of each other. On September 29, Oura postponed its Nasdaq IPO just eight days after launching it. Meanwhile, BofA’s asset management business offers a stable floor while we wait for the IPO market to re-open. The next likely indicator for that will be the market reception to Anthropic’s IPO, which is speculated to happen before Thanksgiving with marketing for the transaction slated to kick off around November 9. Share gains at BofA’s wealth management business are also a nice positive as are the findings in the most recent Federal Reserve Senior Loan Officer Opinion Survey (SLOOS). That report found stronger demand for commercial and industrial loans from large and middle-market firms but weaker demand for residential real estate loans. The net result should be a positive for BofA’s commercial bank activity, but should the Fed deliver another rate hike later this year, we may see that activity slow. Clearly the level of IPO activity is weighing on BAC shares, and the steep pullback from mid-September has landed them in an oversold condition existing September. We will continue to monitor IPO and other investment banking activity and be mindful of BofA’s focus on productivity and cost reduction when it reports its Q3 2026 results. Potential catalysts we are watching include upcoming earnings results from Citigroup, Goldman Sachs, and JPMorgan on October 13. BofA reports its quarterly results a day later.
September Price Change: -12.1%; Yield: 2.4%
INVESTMENT THESIS: Bank of America is one of the world’s leading financial institutions, serving individual consumers, small- and middle-market businesses, and large corporations with a full range of banking, investing, asset management, and other financial and risk management products and services. The company provides unmatched convenience in the United States, serving approximately 69 million consumers and small business clients with approximately 3,700 retail financial centers, approximately 15,000 ATMs, and award-winning digital banking with approximately 59 million verified digital users. Bank of America is a global leader in wealth management, corporate and investment banking, and trading across a broad range of asset classes, serving corporations, governments, institutions, and individuals around the world. Bank of America offers industry-leading support to approximately 3 million small business households through a suite of innovative, easy-to-use online products and services. The company serves clients through operations across the United States, its territories, and approximately 35 countries. From a reporting perspective, the company’s business breaks down as follows: Net Interest Income breakdown: Consumer Banking 57%, Global Banking 23%, Global Wealth & Investment Management 14%, and Global Markets 6%; Income Before Tax breakdown: Consumer Banking 42%, Global Banking 27%, Global Wealth & Investment Management 16%, and Global Markets 15%.
Target Price: $70; Rating: Two
Checkpoint: $45
RISKS: Financial markets, fiscal, monetary, and regulatory policies, economic conditions, and credit ratings.
The Boeing Company BA; $186.05; 1,069 shares, 3.30%; Sector: Industrials
UPDATE: Q3 2026 was a challenging quarter for Boeing (BA) shares, culminating with a more than 10% fall in September. We used that pressure on BA shares to add to the Portfolio’s holdings on September 16 at $209.60 and again on September 30 at $187.78. Let’s start with the good news. As we expected, Boeing and SPEEA reached a meeting of the minds. The improved offer included a 10% raise upon ratification and 4% annual raises plus up to 2% in performance increases, and on October 1, 68% of the Professional unit and 54% of the Technical unit voted in favor, averting a strike when the contracts expire on October 6. September also brought a wave of orders, including 103 jets from Korean Air, 100 firm 737-8s plus 50 options from Turkish Airlines, 20 737 MAX 10s from Lufthansa, 11 jets from Biman Bangladesh, and 10 freighters from Ethiopian Airlines. Meanwhile, Boeing delivered 51 jets in August, including 42 737s, bringing its year-to-date total to 418. On September 28, the shares fell nearly 7% after the FAA said it was reviewing a software issue Boeing had flagged in certain 737 MAX flight computers, one that could affect some landing procedures. That raised the specter of yet another delay for the 737 MAX 10. On October 2, we used the announced agreement with SPEEA to pick up another slug of BA shares at $192.50. Also influencing our decision are several recent wins for the company’s Defense, Space & Security (BDS) business and September commercial announcements from Korean Air, Lufthansa, Turkish Airlines, Biman Bangladesh Airlines and Ethiopian Airlines for a total of Boeing 244 aircraft. Also on October 2, the FAA’s Corrective Action Review Board determined the 737 MAX 10 software issue is not a safety concern because pilots retain full control of the aircraft and the indications to the flight crew are clear and unambiguous. That paves the way for certification of the MAX 10, the last model in the 737 MAX family, and one that accounts for an estimated 30% of Boeing’s multi-year commercial backlog. With both the labor and software overhangs now removed, our focus shifts to the timing of MAX 10 certification, and its Q3 results on October 27, where free cash flow prospects will be front and center. As we indicated in our October 2 pickup of BA shares, the next catalyst we are waiting for, and it may be one that leads us to upgrade our rating, is Boeing’s September delivery figures, which should be out in mid-October.
September Price Change: -10.5%; Yield: 0.00%
INVESTMENT THESIS: Boeing is an aerospace company that reports its business in three operating segments – Commercial Airplanes (47% of 2025 sales), Defense, Space & Security (30%), and Global Services (23%). Our focus is on Boeing’s Commercial Airplane business, the operational leverage and EPS improvement that should follow increasing production levels. Factors fueling the rise in new aircraft demand, which is reflected in Boeing’s multi-year backlog, include pandemic passenger travel, the need to replace aging, inefficient fleets, and supply chain delays that have artificially tightened aircraft availability. Industry projections indicate that airlines will require over 43,000 new aircraft — primarily single-aisle jets — to meet rising passenger traffic and replace older, less efficient models.
Target Price: $265; Rating: Two
Checkpoint: $175
RISKS: Industry demand, defense spending, supply chain, and competitive risk.
Eaton Corp. ETN; $429.71; 510 shares; 3.55%; Sector: Industrials
UPDATE: Shares of Eaton (ETN) rallied back nearly 7% in September, which made them a modest contributor to the Portfolio’s Q3 2026 performance. That monthly gain came despite a mid-month wobble, when Eaton traded lower with Arista, Marvell, Broadcom and others in the AI and data center ecosystem as Treasury yields climbed. The bigger news came on September 24, when Eaton agreed to acquire Italy-based COL Group for €810 million. COL makes medium-voltage electrical distribution equipment, including SF6-free switchgear and grid automation technology, and is expected to deliver about €250 million in revenue in 2027. The deal, slated to close in Q1 2027, expands Eaton’s manufacturing capacity in Europe, the Middle East and Africa for data center and utility customers. Near the end of the month, UBS upgraded the shares to Buy and lifted its price target to $515 from $450, citing stronger sales growth, improving margins and better execution, with data center orders up 85% year over year and Eaton’s global electrical backlog more than doubling. Eaton was also a presenting customer at Palantir’s AIPCon event on September 10, a reminder the company is putting AI to work in its own operations. U.S. energy utility capital expenditures are projected to reach approximately $1.3 trillion to $1.4 trillion through 2030, marking a roughly 21% to 29% increase over prior multi-year cycles. Globally, energy investment is expected to hit $3.4 trillion, with nearly 60% dedicated to the electric power sector for grids and renewables. Those multiyear forecasts suggest a rising demand environment for ~85% of Eaton’s business. Meanwhile, rising production levels at Boeing and Airbus bode well for the other 15% of Eaton’s revenue stream, its Aerospace segment. With strong multi-year tailwinds across Eaton’s businesses, we aim to capture that benefit to the company’s revenue, profits and EPS through its shares. When Eaton reports its Q3 2026 results, backlog levels for its business segments will be a focal point but so will updated capital spending comments from hyperscalers, neoclouds, and electric utilities.
September Price Change: 6.9%; Yield: 1.0%
INVESTMENT THESIS: Eaton is an intelligent power management company that makes products for data center, utilities, industrial, commercial, machine building, residential, aerospace, and mobility markets. That business is positioned to capitalize on the mega trends of electrification, energy transition, and digitalization. We see Eaton helping address the power pain point created by data center, EV charging infrastructure, and other drivers of electricity demand. Research estimates that data center power demand will grow 160% by 2030, accounting for 3% to 4% of global power, up from 1% to 2% today. Data centers will use 8% of U.S. power by 2030, compared with 3% in 2022.
Target Price: Reiterate $500; Rating: Two
Checkpoint: $370
RISKS: Raw material costs, labor costs, end market volatility, and government legislation.
First Trust Nasdaq Cybersecurity ETF CIBR; $103.09; 2,435 shares; 4.07%; Sector: Cybersecurity
UPDATE: Shares of the First Trust Nasdaq Cybersecurity ETF (CIBR) built on their August gains, rising another 2.9% in September leaving them up just under 15% for Q3 2026. Like most other months, we continued to learn of fresh cyberattacks that not only keep us bullish on cybersecurity demand and spending, but also that AI adoption is expanding the vector and velocity of cyberattacks. Early in the month, home medical equipment provider AdaptHealth confirmed that a cyberattack exposed the personal and health information of 4,115,802 people, an incident reportedly linked to the ShinyHunters extortion group. The Pentagon then confirmed a breach of a Defense Manpower Data Center system that exposed sensitive personal information on more than three million people, with victim notification letters dated September 18. On September 22, Astrana Health disclosed in an 8-K filing that attackers spoofed its corporate phone number and impersonated staff to gain system access, warning the incident could affect its operations, financial condition, and reputation. On September 24, crypto exchange Bitget disclosed that hackers stole $387.5 million from its hot and warm wallets, prompting a temporary halt to withdrawals. The month closed with a September 26 ransomware attack on Japanese railway operator Keio that disrupted its hospitality business, including payment systems at the Keio Plaza Hotel Tokyo. These events mixed with others that showcase bad actors leveraging AI to expand cyberattacks reaffirms our bullish stance on cybersecurity spending. It also bolsters our view that cybersecurity should be a part of every investor’s portfolio. We continue to favor the diverse exposure offered by CIBR shares. After adding further to our CIBR position on July 30, the Portfolio’s CIBR plate is rather full, however, we will continue to examine favorable entry points for newer Pro members and those underweight the shares relative to the Portfolio. As we move through the Q3 2026 earnings season, we will be mindful of updates by key holdings in the CIBR ETF and revisit our CIBR target as needed.
September Price Change: 2.9%; Yield: 0.3%
INVESTMENT THESIS: The First Trust Nasdaq Cybersecurity ETF seeks investment results that correspond generally to the price and yield (before the fund’s fees and expenses) of an equity index called the Nasdaq CTA Cybersecurity Index. The Nasdaq CTA Cybersecurity Index is designed to track the performance of companies engaged in the cybersecurity segment of the technology and industrial sectors. It includes companies primarily involved in the building, implementation, and management of security protocols applied to private and public networks, computers, and mobile devices to protect the integrity of data and network operations. To be included in the index, a security must be listed on an index-eligible global stock exchange and classified as a cybersecurity company as determined by the Consumer Technology Association. Each security must have a worldwide market capitalization of $250 million, have a minimum three-month average daily dollar trading volume of $1 million, and have a minimum free float of 20%.
Target Price: Reiterate $105; Rating: Two
Checkpoint: $75
RISKS: Cybersecurity spending, technology and product development, the timing of the product sales cycle, new products, and services in response to rapid technological changes and market developments, as well as evolving security threats.
Marvell Technology MRVL; $264.21; 865 shares; 3.76%; Sector: Technology
UPDATE: Shares of Marvell (MRVL) soared roughly 25% in September, and while that wasn’t enough to offset the drag they were for the full Q3 2026, the shares finished the month up 200% on year-to-date basis. Several developments fueled that September move. Piper Sandler initiated coverage with an Overweight rating and a $270 target, naming Marvell a long-term winner alongside Nvidia and Broadcom. That followed Marvell’s late-August move to lift its outlook for data center growth this year to 60% from 50%, with that business expected to grow more than 60% next year. The $22 billion loan backing Crux AI’s purchase of Google TPUs is a positive given Google is a Marvell custom silicon customer. Ciena’s upsized multi-year outlook and Evercore’s view that optical networking is emerging as a bottleneck in the AI buildout mesh well with our bullish case for Marvell’s networking business. And Nvidia CEO Jensen Huang’s expectation that chip sales will double next year adds further support to overall AI and data center demand. On September 29, Citi reiterated its Buy rating ahead of Marvell’s upcoming Investor Day, noting management has already raised its fiscal 2027 and 2028 revenue guidance, with fiscal 2028 calling for roughly 50% growth. Here’s the thing: after bouncing back hard in August and this September climb, expectations heading into the October 6 investor day are high. We will be listening for multi-year targets for custom silicon and electro-optics revenue, as well as margin targets. But we’re also mindful that a lot of good news is now in the shares, which leaves room for disappointment if management doesn’t deliver a compelling multi-year outlook. With strong support for the shares between $226-$234, a pullback to that degree may lead us to top off our MRVL exposure and upgrade our Two rating.
September Price Change: 24.8%; Yield: 0.1%
INVESTMENT THESIS: Marvell is a fabless supplier of high-performance standard and semi-custom infrastructure semiconductor solutions. These solutions power the data economy, enabling the data center, carrier infrastructure, enterprise networking, consumer, and automotive/industrial end markets. With roughly 75% to 80% of Marvell’s revenue stream tied to digital infrastructure, we see it continuing to benefit from rising content consumption and creation. Pointing to that rising demand that necessitates network densification and the build of digital infrastructure, Ericsson sees global monthly average usage per smartphone reach 46 gigabytes (GB) by the end of 2028, versus 19 GB in 2023 and 15 GB in 2022.
Target Price: Reiterate $340; Rating: Two
Checkpoint: $140
RISKS: Technology risk, customer risk, competition risk, reliance on manufacturing partners, and supply chain constraints.
Meta Platforms META; $725.18; 297 shares; 3.45%; Sector: Communication Services
UPDATE: Shares of Meta (META) were a big winner for the Portfolio in September, as the market embraced Muse, the personal AI agent Meta launched on September 8. Meta shares finished the month up more than 25% and nearly 29% for Q3 2026. Muse quickly climbed to the top of Apple’s U.S. app store, ahead of ChatGPT, and surpassed 500,000 total users and 250,000 daily active users in its first week. Partnerships with Shopify and PayPal followed, and a slew of price target increases from Wells Fargo, Cantor Fitzgerald and KeyBanc pushed the shares deeper into overbought territory. With the shares up more than 38% in a month and their relative strength index above 78 ahead of Meta Connect, expectations had been ratcheted up considerably. That led us to prudently ring the register on some META shares at $749.20 on September 22, using their overbought condition to do so. At Connect, CEO Mark Zuckerberg made Muse the centerpiece of Meta’s vision, added Walmart, Best Buy and Gap as retail partners, and said Meta will take a fee on transactions executed through Muse. Basic Muse is free, with subscriptions at $20 and $100 a month. Days later, Meta expanded Muse to small businesses, where it is well positioned given estimates that small advertisers account for up to 38% of its social media advertising. As we see it, free downloads don’t translate one for one into paid subscriptions, and privacy and trust remain the key hurdles, with an Oppenheimer survey finding just 8% of U.S. consumers would trust Meta with their passwords. Amazon blocking Muse from its retail site and OpenAI reportedly mulling a rival assistant are further reminders of the competition ahead. When it comes to Muse, our focus will remain on paid subscription growth and transaction volumes for which Meta may earn a revenue slice. When Meta reports its Q3 2026 results, we will be mindful of margins, backlogs and other factors but one of our focal points will be on the all-important Family Average Revenue per Person (ARPP) metric reported by the company. With the U.S. mid-term election heating up and advertising spending for that expected to be a new record, we see Meta and its advertising revenue-based platforms well positioned.
September Price Change: 26.7%; Yield: 0.3%
INVESTMENT THESIS: Meta segments its business between Family of App Products, which includes Facebook, Instagram, Messenger, Threads, and WhatsApp, and Reality Labs Products, which includes its metaverse and investments and future product R&D. Family of Apps accounts for about 99% of the company’s revenue and 100% of the company’s operating profits. Substantially all of Meta’s revenue is currently generated from advertising on Facebook and Instagram. Family daily active people (DAP) were ~3.6 billion on average for the June 2026 quarter. Meta forecasts its expenses to run between $165 billion-$169 billion this year while also spending $130 billion-$145 billon on capex, a significant increase year over year with a large step up in H2 2026 compared to H1 2026. Meta is positioned to benefit from the ongoing shift toward digital advertising and the adoption of AI across its entire product offering. We recognize Meta is ramping up capital spending as part of the current AI arms race, but we see that as an investment that has the potential to drive greater productivity and monetization as it expands its core advertising business further across all its platforms. As the company shifts into harvesting that investment, we could see a step up in margins, much like we saw in 2023.
Target Price: $850; Rating: Two
Checkpoint: $590
RISKS: Ability to add and retain users and user engagement; marketing spend; new products or changes to existing ones; competitive risk, geopolitical risk.
Microsoft Corp. MSFT; $512.90; 310 shares; 2.56%; Sector: Technology
UPDATE: Shares of Microsoft (MSFT) inched up 1.1% in September, which pushed their Q3 2026 gain to more than 37%. That made the shares the Portfolio’s second-best performer for that three-month period. On September 25, Microsoft revamped Copilot with new coding capabilities and a persistent AI agent, moves aimed at broadening adoption and premium monetization. Two days earlier, Stifel upgraded the shares to Buy from Hold with a $575 price target, expecting Microsoft to keep delivering mid- to upper-teens revenue growth while demonstrating operating expense efficiency. Earlier in the month, Microsoft re-segmented its reporting into two segments, Agents and Infra and Devices and Consumer, and will disclose Azure revenue for the first time. Agents and Infra accounted for 81% of revenue over the last 12 months and 88% of operating income, which reinforces the transformation from software company to cloud infrastructure that we’ve discussed with you. As we shared during one of our September Portfolio Office Hours sessions, we are leaning toward moving our $500 price target higher. The degree of that increase will hinge on what Microsoft has to say about converting its cloud backlog into booked revenue and segment margins as it balances that revenue against capacity additions, including capital spending of roughly $115 billion this year. Microsoft was also one of the five stocks that delivered more than 90% of the S&P 500’s gains since late July, which speaks to its leadership but also to how narrow the market’s advance has been. Recall that in August we locked in triple-digit gains at $502.37, bookending our June purchase at $371.20, and that discipline served us well as the shares spent much of September in a tight range between $490 and $510. On the dividend front, mid-September Microsoft announced an 8% increase to its quarterly dividend, placing the next per share payment to shareholders at $0.98. That new dividend is payable Dec. 10, 2026, to shareholders of record on Nov. 19, 2026. Microsoft has yet to share when it will report its September-quarter results.
September Price Change: 1.1%; Yield: 0.8%
INVESTMENT THESIS: We believe the cloud to be a secular growth trend and that the upside to the shares will result from Microsoft’s hybrid cloud leadership as the company grabs market share in this expanding industry. While companies may look to build out multi-cloud environments, Microsoft’s Azure offering will be a prime choice thanks to its decision to provide the same “stack” used in the public cloud to companies for their on-premises data centers. Additionally, we would note that hybrid environments are currently the preference for most companies because they allow them to maintain critical data in-house while taking advantage of the agility and scalability provided by public clouds. Outside of the cloud opportunity, we maintain a positive view on the company’s growing gaming business, which we believe is becoming an increasingly prominent factor in the Microsoft growth story as gaming becomes more mainstream, management works to convert its gaming revenue from a one-time license purchase to a recurring subscription model, and as technologies like augmented/virtual reality evolve. Finally, as it relates to LinkedIn and other subscription-based services such as O365 and various Dynamics products, we continue to value them highly for their recurring revenue streams, which, we remind members, provide for greater transparency of future earnings.
Target Price: $500; Rating: Two
Checkpoint: $345
RISKS: Slowdown in IT spending, competition, and cannibalization of on-premises business by the cloud.
Morgan Stanley MS; $188.08; 1,150 shares; 3.49%; Sector: Financial Services
UPDATE: After rising steadily over the last several months, the slowdown in IPO activity weighed on the shares of Morgan Stanley (MS) in September. The low-double digit fall wiped out July and August gains, leaving the shares down 10.0% for Q3 2026. Following the seasonally slow pace of IPO activity in August, we shared that coming into September we would be closely monitoring that activity, looking to see if a seasonal rebound unfolded. Early in the month, OpenAI CEO Sam Altman told Fortune the company won’t make its public market debut in 2026, a decision he tied to making “confident safety decisions” rather than market conditions. As the 10-year Treasury yield climbed through September, we saw market conditions cool IPO prospects. Nuclear power services firm Holtec Nuclear and CVC Capital Partners-backed Bamboo Insurance Services postponed their offerings within days of each other. On September 29, Oura postponed its Nasdaq IPO just eight days after launching it. However, equity trading volumes have remained favorable as have M&A transactions and advisory work. Meanwhile, Morgan’s asset management business offers a stable floor while we wait for the IPO market to re-open. The next likely catalyst for that will be the market reception to Anthropic’s IPO, which is speculated to happen before Thanksgiving with marketing for the transaction slated to kick off around November 9. Given the September slump in MS shares, we suspect the company is using its near $20 billion multi-year common equity share repurchase. That same slump has MS shares in an oversold condition, and that has them on our potential shopping list. Potential catalysts we are watching include upcoming earnings from Citigroup, Goldman Sachs, and JPMorgan on October 13. Morgan Stanley reports its quarterly results a day later.
September Price Change: -11.8%; Yield: 2.4%
INVESTMENT THESIS: Morgan Stanley reports in three business segments: Institutional Securities (42% of trailing 12-month revenue, 38% of trailing 12-month Income Before Tax), Wealth Management (48%, 55%), and Investment Management (10%, 6%). While the IPO window has yet to reopen, the potential IPO class for 2025 continues to build with recent additions including Klarna and StubHub. That would be a boon to private equity firms and others that have been nursing IPO candidates during the dark period and a positive for Morgan Stanley’s investment banking business. Expected deregulation under the Trump administration is a potential catalyst for Morgan’s M&A business. Meanwhile, folks continuing to be behind in retirement savings bodes well for Morgan Stanley’s wealth management business in the coming quarters, while continued market volatility bodes well for its equity trading business.
Target Price: $225; Rating: Two
Checkpoint: $180
RISKS: Market and interest rate risk, credit risk, country risk, and operational risk, including cybersecurity.
Palantir Technologies PLTR; $187.05; 1,130 shares; 3.41%; Sector: Financial Services
UPDATE: Shares of Palantir (PLTR) were essentially flat in September, but that also means the shares closed Q3 2026 up more than 60%, making them a significant contributor to the Portfolio’s performance for that three-month period. Despite that microscopic net move in the shares during September, company news during the month was rather upbeat. At its AIPCon 11 event on September 10, Palantir unveiled a deeper integration with Google Cloud, linking BigQuery with Foundry, and announced new or expanded deals with McCarthy Building Companies, Mexican insurer GNP Seguros and Kirkland & Ellis. Other presenting customers included Cisco, Eaton, Nvidia, L3Harris, Novartis and the FAA. Palantir and Method Security also announced the Cardinal Program, which will provide select municipalities, utilities and critical infrastructure operators with continuous autonomous security assessments at no cost. Later in the month, the shares jumped more than 4% on September 23 as the FAA’s broader push into AI for air traffic management stirred hopes for additional opportunities, even though no new Palantir contract was announced. For the current quarter, Palantir sees its topline coming in between $2.16 billion to $2.164 billion, up double-digits sequentially and more than 80% compared to the year-ago quarter. Doing some basic math, we can deduce Palantir current sees its Q4 2026 revenue around $2.4 billion. What this tells us in the company’s H2 2026 revenue should grow more than 28% compared to H1 2026. As AI adoption and usage widens further, there is reason to think Palantir’s outlook for H2 2026 skews conservative. What we like even more than that revenue outlook is the continuing step-up in the company’s margin profile, which has been rising steadily in recent quarters and based in inferred guidance for Q4 2026 looks to remain relatively steady despite that revenue jump to close out the year. This also tells us that free cash flow should be stronger in the coming quarters, adding further to the company $9.4 billion in net cash on the balance sheet.
September Price Change: 0.4%; Yield: 0.0%
INVESTMENT THESIS: Palantir Technologies specializes in big data analytics and builds software platforms that help organizations integrate, analyze, and make sense of vast amounts of data for both commercial and government clients. While much has been made about the company’s exposure to the federal government, its software is used across 90 industries, and the larger global government sector accounted for 55% of revenue last year. The balance was from the commercial sector. Exiting 2025, Palantir’s U.S. Commercial remaining deal value (RDV) stood at $4.38 billion, up 145% year over year, and its Total Contract Value (TCV) stood at $10.8 billion, up 128% year over year. We will continue to monitor Palantir’s RDV and deferred revenue metrics. Key items to watch include continued diversification of its customer base across industries and increasing revenue per customer. Because we are still in the relatively early innings of AI adoption, we are inclined to be long-term owners of PLTR shares.
Target Price: $220; Rating: Two
Checkpoint: $120
RISKS: Economic and IT budget spending risk, technology risk, competition and competitive pressures, and customer acquisition risk.
Robo Global Robotics and Automation ETF ROBO; $80.46; 965 shares; 1.28%; Sector: Technology
UPDATE: Shares of the Robo Global Robotics and Automation ETF (ROBO) were unchanged in September. Our play with the shares is to capture the growing adoption of robotics and automation as companies focus on driving productivity while confronting demographic realities. Grandview Research sees the global industrial robotics market growing to $78.9 billion by 2033, up from $41.9 billion in this year and $37.8 billion in 2025. The improving manufacturing economy captured by ISM’s monthly PMI new order data, accelerated depreciation, capital spending and productivity targets bode well for ROBO’s constituents. We aim to grow the Portfolio’s exposure over time and in keeping with our Two rating, we used the slump in the share price in the first half of September to scoop up more shares at $78.81 on September 17. We are monitoring the shares to see if market pressures give us a nice opportunity near the next layer of support at $78, which is the 200-day moving average.
September Price Change: 0.0%; Yield: 0.0%
INVESTMENT THESIS: The ROBO Global Robotics & Automation Index ETF invests in global companies that are driving transformative innovations in robotics, automation, and artificial intelligence (RAAI), including companies that create technology to enable truly intelligent systems that can sense, process, and act, and companies that apply those technologies to deliver RAAI-enabled products — including robots — to businesses and consumers. The ETF’s underlying basket is broken down into two categories — Application (55%) and Technologies (45%). Application includes to manufacturers and industrial automation (21%), logistics automation (10%), autonomous systems (7%), healthcare (7%), food & agriculture (6%), business process automation (3%), and 3D printing (1%). Technologies includes actuation (14%), computing and AI (14%), sensing (10%), and integration (7%).
Target Price: Reiterate $95; Rating: Two
Checkpoint: $68.
RISKS: Economic and business cycle risk; capital spending and geographic risk, technology risk.
State Street Health Care Select Sector SPDR ETF XLV; $168.42; 580 shares; 1.54%; Sector: Health Care
UPDATE: Following their more than 4% climb in August, shares of the State Street Health Care Select Sector SPDR ETF (XLV) shed just over 1% in September. On September 17, we picked up more shares at $168.26, and we continue to evaluate opportunities to further increase our position size. Healthcare spending in the U.S. is expected to grow at an average rate of around 5.4% annually between 2025 and 2034, reaching nearly $9 trillion and accounting for more than 20% of GDP. Part of that trajectory reflects our aging-of-the-population theme. We’ve opted for the broad exposure offered by the ETF’s structure, which gives us exposure to pharmaceuticals, biotechnology, health care providers & services, health care equipment, life sciences & tools and health care technology. Entering October, XLV shares are battling their 50-day moving average, and a successful test could lead us to pick up additional shares. If not, the next layer of support clocks in near $161, which is the 100-day moving average. A pullback to that support level would lead us to revisit our current Two rating.
September Price Change: -1.2%; Yield: 1.5%
INVESTMENT THESIS: The State Street Health Care Select Sector SPDR ETF provides exposure to companies in the pharmaceuticals; health care equipment and supplies; healthcare providers and services; biotechnology; life sciences tools and services; and healthcare technology industries. Top holdings exiting September 2026 included Eli Lilly (15.1%), Johnson & Johnson (10.4%), AbbVie (7.55%), Merck & Co. (5.86%), United Health (5.38%), and Thermo Fisher Scientific (4.08%).
Target Price: Reiterate $180; Rating: Two
Checkpoint: $147
RISKS: Drug approval, pricing pressure, funding changes, R&D spending, patent expiration, and litigation risk.
Welltower Inc. WELL; $230.24; 640 shares; 2.33%; Sector: Real Estate
UPDATE: Shares of Welltower (WELL) slipped 2.5% in September, closing at $230.24, just below the support near $232 that we flagged as a potential pick-up point. In our view, that move had more to do with the rise in Treasury yields and investor demand for REITs than the company itself or the demand for senior housing. Following the Fed’s 25-basis-point rate hike on September 16, its first since 2023, the 10-year Treasury yield climbed to 5.29% at month-end, its highest level since 2007. That pressured rate-sensitive sectors, including REITs. Company news in September was light. Welltower continued to add to its senior housing portfolio, including a new Los Angeles acquisition, and set October 26 as the date for its Q3 results. Our thesis remains centered on the demographic tailwind of an aging population meeting a shortage of senior housing inventory, which should keep occupancy rising and pricing power building. Management’s guidance for same-store net operating income growth of 18.0% to 21.5% this year, along with the 15% dividend increase to $0.85 per quarter in June, reflects that. When Welltower reports, we’ll be watching occupancy trends, labor availability for caregivers, and any change to its acquisition pace given higher borrowing costs. While we wait for that earnings report, we are watching the shares relative to their 100-day moving average near $228. Should the shares break below that support, the next level to watch for support is near $213, one that would give us reason to contemplate revising our Two rating.
September Price Change: -2.5%; Yield: 1.5%
INVESTMENT THESIS: Welltower, a real estate investment trust (REIT), owns interests in properties concentrated in major, high-growth markets in the United States, Canada, and the United Kingdom, consisting of senior housing, post-acute communities, and outpatient medical properties. We see the company benefiting from the intersection of the demographic shift that is the aging population and the looming pain point that is the shortage of inventory for senior housing, which fell below 1% in Q2 2025, according to the National Investment Center for Seniors Housing & Care. Over the next five years, more than 4 million boomers will hit age 80, and that’s in addition to the roughly 4% of the U.S. population that was 80-plus years old in 2024. As this demographic shift unfolds, we should see a relatively steady growth rate in Welltower’s revenue, NOI, and FFO, which, in turn, given its REIT status, should drive its payable dividend stream higher. Because of the favorable demographic tailwind and lower interest rate path telegraphed by the Federal Reserve, which should reduce construction costs over time, as well as bring REIT stocks back into favor, we intend to be long-term holders of WELL shares. Our plan is to build the position size methodically, increasing the Portfolio’s dividend stream along the way.
Target Price: $265; Rating: Two
Checkpoint: $190
RISKS: Operational risk, operator and tenant risk, competitive risks, and acquisition risk.
THREES
Netflix Inc. NFLX $69.58; 2,505 shares; 2.68%; Sector: Communication Services
UPDATE: September was a tough month for shares of Netflix (NFLX), which fell 14.2% to close at $69.58, slipping below our $70 checkpoint. Much of the pressure came on September 18, when Wells Fargo made a rare downgrade of the shares to Underweight with a $57 price target, citing a weaker originals slate in the second half of 2026 and engagement risk. As we pointed out at the time, that softer slate is hardly news given the comparison to the final season of Stranger Things. Wells’ EPS cuts for 2027 and 2028 were modest relative to consensus, and Nielsen’s July Gauge data had Netflix’s streaming share holding steady near 8%. Nor did every firm turn negative, with Evercore lifting its price target to $110 and Deutsche Bank upgrading the shares to Buy on September 29. Even so, the shares kept sliding, and after CEO Ted Sarandos commented that the company isn’t growing as fast as he would like, the position became increasingly difficult to defend. That comment suggests consensus expectations could be reset lower when Netflix reports on October 20. There are other headwinds to consider: tax-loss selling as investors offset gains booked elsewhere in Tech, investors raising cash to participate in the upcoming Anthropic IPO, and YouTube’s interest in bespoke live sports rights, which could lift content costs in an area that accounts for about 5% of Netflix’s roughly $20 billion content budget. With our cost basis at $86.30 and a three-pronged layer of technical resistance overhead, it will take a pronounced development to get the shares back on a positive trajectory. Possible, but the odds are waning, and there are more compelling places to put capital to work. As we’ve long said, hopium is not a suitable strategy for investors. That confluence of factors led us to downgrade Netflix shares to a Three rating on October 2 and suspend our price target as well as checkpoint level for the shares. Why not go straight to a Four rating? With the shares re-entering oversold territory and more than 94 million shares sold short as of September 15, equal to almost 3.6 days to cover, any positive development could spark a bounce. Rather than sell into weakness, we’ll look to use strength to begin unwinding the position. Should we find a more compelling opportunity or see signs the market is poised to soften, Netflix shares will be a likely source of funds.
September Price Change: -14.2%; Yield: 0.0%
INVESTMENT THESIS: Netflix is one of the world’s leading entertainment services offering TV series, films, games and live programming across a wide variety of genres and languages. With over 325 million paid memberships, Netflix serves a global audience approaching one billion people. In the second half of 2025, Netflix members watched 96 billion hours on Netflix, up 2% (+1.5 billion hours) year over year vs. a 1% increase in the first half of the year. We attribute that to the company’s growing slate of proprietary content, live events, including sports, and a growing market for games. The company’s revenue is ~45% from the U.S., 31% EMEA, 12% Latin America, and 11% Asia-Pacific. We see Netflix and its growing content slate well positioned to benefit from the ongoing shift to streaming from broadcast and box office content, with margins poised to benefit from a combination of pricing actions and growing exposure to the higher margin advertising revenue.
Target Price: NM, Rating: Three
Checkpoint: NM
RISKS: Consumer spending and economic risk, content development and content licensing risks and competitive risks.
Not Rated
EPS All-Stars Model; 8.0%; Sector: N/M
UPDATE: On July 1, we reconstituted the strategy’s basket for Q3 2026, and in keeping with the higher starting position size at the start of Q3 2026, we upsized the Portfolio’s positions in Ciena (CIEN), Eldorado Gold (EGO), Lumentum Holdings (LITE) and Rocket Companies (RKT). We also started new positions in SiTime Corp. (SITM) and Seagate Technology (STX). In September the strategy returned 3.1%, leaving it down 4.1% for Q3 2026. Keeping it simple, and not factoring in any dividends paid or received, if you invested $1,000 in the EPS All-Stars model when we initiated the strategy, exiting Q3 2026 it would be worth $1,769.41 compared to $1,130.85 if that same $1,000 was invested in the S&P 500. In other words, a cumulative gain of 76.9% for the All-Stars strategy vs. 13.1% for the S&P 500. On September 30 as part of the quarterly reconstitution process, we closed out the positions in Eldorado Gold and Rocket Companies. On October 1, we upsized the basket’s position in Bloom Energy (BE), Ciena, Lumentum, Micron (MU), SiTime, and Seagate Technology to 1.0% of the Portfolio’s assets each. We also started new positions for the basket at a similar size in Advanced Micro Devices (AMD), and Astera Labs (ALAB). Given the nature of the model, the only time we may adjust its composition during the quarter is if a company is acquired. Otherwise, the model is set until the next reconstitution. There are no price targets or ratings for each of the positions that make up the basket. That same selection process will be repeated quarterly, which means housekeeping for the model should be minimal. It also means you can expect minimal activity to occur at quarter-end and the start of the new quarter. The next reconstitution cycle for the EPS All-Stars model will be December 31 and January 2. At that time, we may consider further increasing the Portfolio’s exposure to the basket.
September Price Change: +3.1%
INVESTMENT THESIS: EPS All-Stars is a basket of large-cap companies that offer the fastest rate of EPS growth over a multi-year period. That basket is screened regardless of industry sector or sub-sector, which means the down-selected list of companies can span a wide array of sectors. The focus is on earnings growth because earnings growth is often seen as a signal of a company’s competitive strength, operational efficiencies, and future growth potential. Shares of companies that provide historically consistent earnings growth faster than the stock market receive premium valuations compared to those awarded to the S&P 500. And as we’ve often discussed with you, multiple expansion paired with earnings growth tends to drive outperformance relative to the market, better known as alpha. The basket of eight stocks is reconstituted on a quarterly basis to reflect updated EPS expectations for the current year and the following one.
Target Price: N/M
Checkpoint: N/M
RISKS: Macro and end-market risk, individual company risk, and consensus EPS expectations.