Weekly Roundup: Big Tech Selloff Accelerates
During a rough week for the market, and especially large-cap tech, we initiated a new position, added to two others, and started the process of unwinding another.
You've reached your free article limit
You've read 0 of 1 free Pro articles.
A confluence of factors hit the market this week resulting in multiple down days for the S&P 500 and the Nasdaq Composite. Despite what could be a possible near-term de-escalation between Israel and Iran, the market pressure grew on Friday as the selloff in Big Tech stocks accelerated. That amplified the increasing nervous mood in the market captured by the continued shift in the Fear & Greed Index to lower levels of "Fear" from "Neutral" this time last week. The redemption of $21.1 billion from stock funds over the last two weeks and the S&P 500 pushing below its 50-day moving average (5118.19) this week didn’t help. Neither did Taiwan Semiconductor (TSM) trimming its 2024 outlook for semiconductor sales nor did Netflix’s (NFLX) guidance.
As we discussed in Friday’s Daily Rundown, we see the current pullback in the market as a healthy event. Our thinking is that while not exactly pleasant in the short-term, it is likely to bring us more opportunities to put capital in companies positioned to deliver superior earnings growth at better prices than we’ve seen in many weeks. This will have us watching technical levels, such as key support and RSI readings, for the market as well as individual positions as we digest the coming wave of earnings reports. The aim will be to put our capital to work in well-positioned companies poised to deliver superior earnings growth at favorable prices.
Through that lens, we see this week’s selloff bringing us more opportunities for our portfolio shopping list not to mention some in larger existing positions, such as Marvell (MRVL). The way we’re thinking about it is the current market setback will eventually bring us favorable setups for the portfolio. We will not blindly charge in but continue to use the disciplined and methodical approach that allowed us to build very profitable positions in names such as United Rentals (URI), Qualcomm (QCOM), Axon (AXON), and others. Our focus will remain on medium to longer-term valuation creation for the portfolio and you.
Catching Up on the Portfolio This Week
The market’s continued move lower this week, and especially for Big Tech stocks, was felt by the portfolio, weighing on our positions in Apple (AAPL), Microsoft (MSFT), Amazon, (AMZN), Nvidia (NVDA), Marvell (MRVL), Universal Display (OLED), and Qualcomm (QCOM). But if we focused solely on that then we would miss the continued gains in our SPDR Gold (GLD) shares as well as the positive moves this week in Bank of America (BAC), Coty (COTY), Elevance Health (ELV), and our inverse ETFs.
Amid the market’s retrenchment, we made a few moves this week, including twin additions to our position in Universal Display (OLED), picking up more Nvidia (NVDA) shares, and calling up Labcorp (LH) from the Bullpen. We also downgraded McDonald’s (MCD) to a Three rating and started to unwind that position given several concerns we have for March-quarter guidance.
Regarding our inverse ETFs, we recognize the relative strength indexes for the S&P 500 and the Nasdaq Composite are nearing readings of 30. A reading below 30 is a classic signal for being oversold, which means we are that much closer to using those inverse ETFs as a source of funds. Because of the meaningful increase in the number of companies reporting next week and the nervous mood of the market, the smart play may be to hold onto those inverse ETFs a bit longer.
This Week's Videos and Podcasts
We cover a lot of ground during the week in our Daily Rundowns and the Portfolio Podcast. If you happened to miss one or more of them, here are some helpful links:
Monday, April 15: Here's Our Take on March Retail Sales
Tuesday, April 16: Morgan Stanley and Bank of America Get Different Reactions on Wall Street
Wednesday, April 17: These Are the Stocks We'd Be Interested in Buying as Earnings Season Unfolds
Thursday, April 18: Let's Discuss the Newest Addition to the Portfolio
Thursday, April 18: Lindsey Bell on the Economy, Jobs, Housing, and Earnings Season Volatility
Friday, April 19: A Huge Week of Earnings Is on Tap for the Market and Portfolio
Key Global Economic Readings
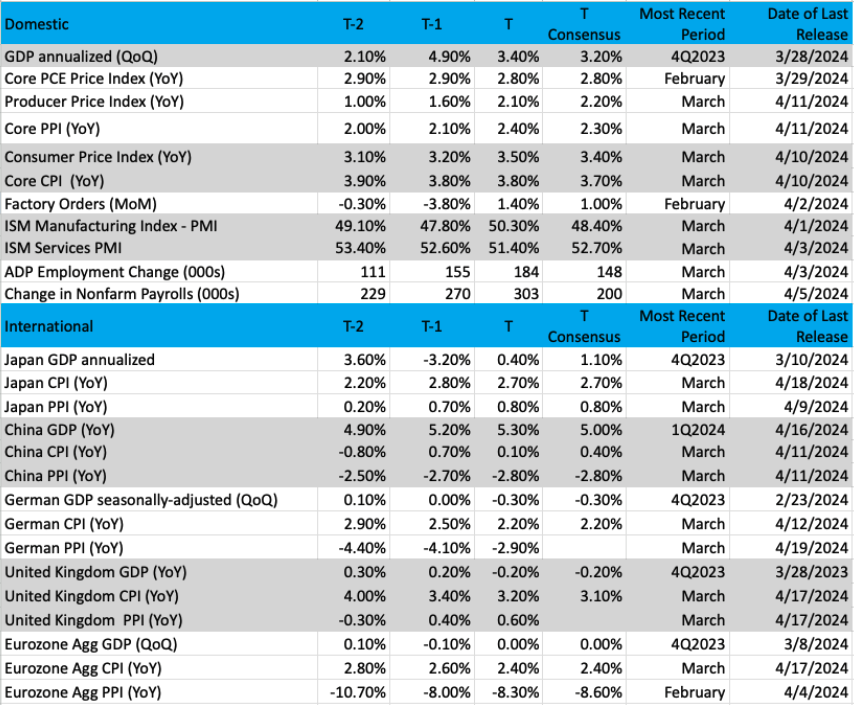
(Note: T is the most recent period, T-1 is the prior period's reading and T-2 is two periods back, the intent being to illustrate any trends)
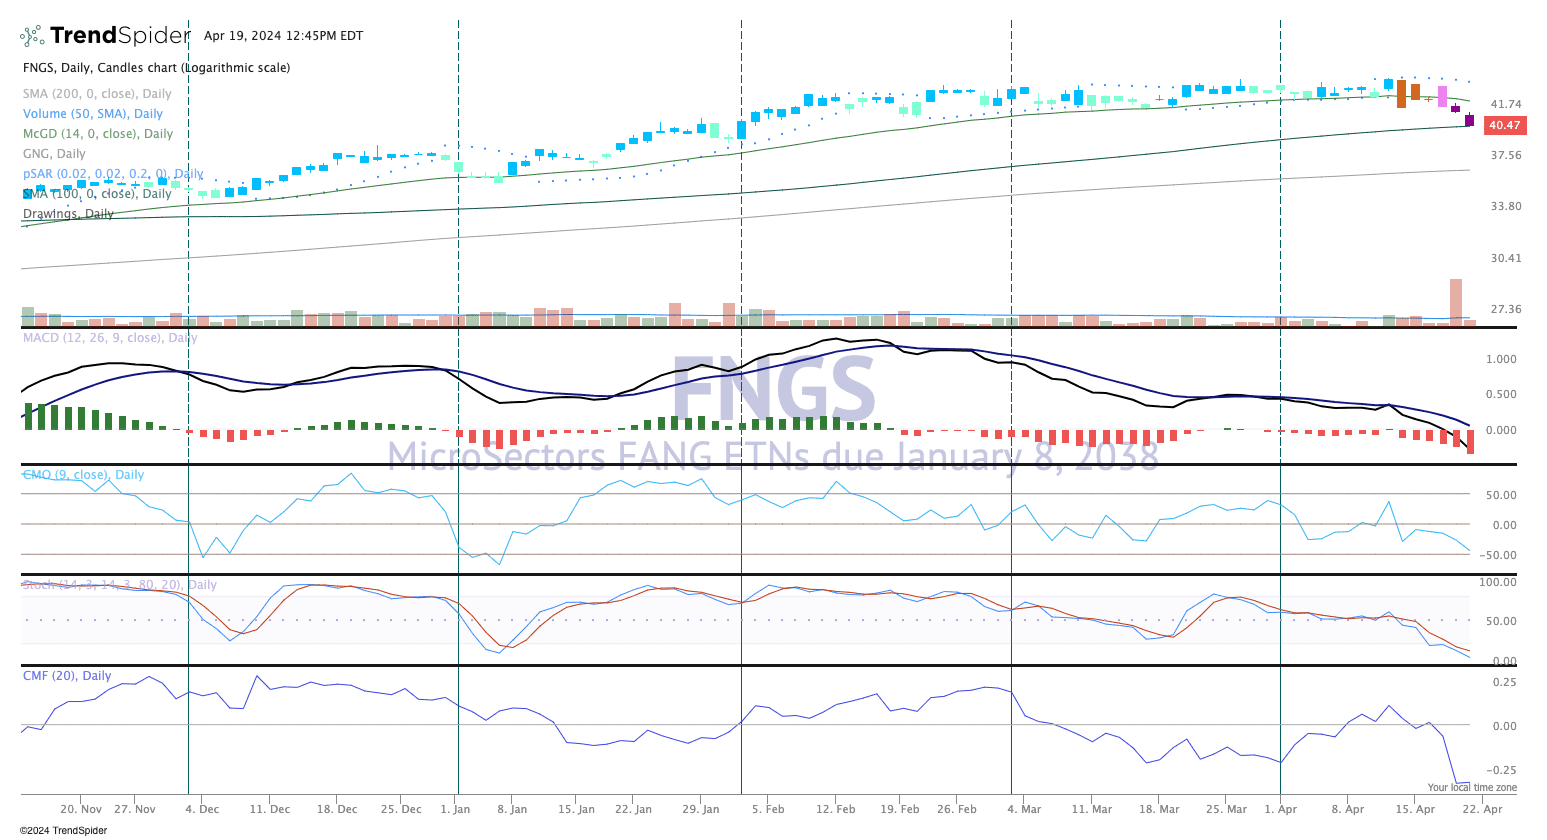
Chart of the Week: MicroSectors FANG+ ETN (FNGS)
While the newest name to describe a group of stocks is the so-called "Magnificent Seven" we should remember this all started with the "FANG" stocks, representing Facebook (META), Amazon (AMZN), Netflix (NFLX), and Alphabet/Google (GOOGL). This collection of names has far outperformed the indexes since its naming in February 2013. As some of these stocks have been replaced to create the Mag 7 (TSLA, NVDA, MSFT, AAPL) and a more robust representation of growth, the original four FANG names are still the envy of the market.
The performance of FANG was so strong that indexes and ETFs were created as a composite to mimic the collective performance. One of those is the MicroSectors FANG ETN (FNGS), which carries several names including those from the Mag 7. This is a nice proxy for growth stocks that are mostly housed in the Nasdaq. Since its inception in November 2019, the FNGS has been up 233%, or an average monthly gain of 5.5%.
The FNGS chart (see below) is clearly in correction territory. The recent pullback has been on good-sized turnover, so institutional selling is a daily occurrence. Money flow is poor (bottom pane), The price action has also been poor, and the FNGS has now settled on the 100-day moving average, but notice the candles are purple. That is a bearish sign using the GoNoGo composite of indicators.
Moving Average Convergence Divergence (MACD) is solidly on a sell signal. While a large majority of the FNGS names will report earnings over the next couple of weeks, this recent pullback could be seen as a precursor to these stocks’ performance. We’ll be watching this group carefully for leadership.
For a larger view of this chart, please click here.
Other charts we shared with you this week were:
Monday, April 15: S&P 500 - We Call Your Attention to an Important Change
Monday, April 15: Trade Desk (TTD) - We Have a Close Eye on Bullpen Name Trade Desk
Tuesday, April 16: Qualcomm (QCOM) - A Not So Bullish Qualcomm
Wednesday, April 17: United Rentals (URI) - United Rentals' Big Move Up Is Over
Thursday, April 18: McDonald’s (MCD) - Nothing Bullish About McDonald's
The Coming Week
In Friday’s Daily Rundown video, we shared how we’re getting ready for the coming week, one that brings more than 900 companies issuing their latest quarterly results and guidance reports and nearly one-third of the portfolio’s holding reporting as well. As we digest those portfolio reports we’ll be revisiting not only the investment thesis that landed those companies in the portfolio but also their respective price targets. We’ll also connect the dots across the portfolio, but we will also be scouring reports from their competitors, customers, and suppliers. The goal is to get a proper view of the landscape, growth prospects, and where the recent market pullback has overly punished shares.
In terms of economic data, we’ve communicated our focus will be on the April Flash PMI report from S&P Global. This next iteration will inform us about the speed of the economy and inflation, but it will also be the first piece of meaningful data for the current quarter. Shortly after that report is in hand, we’ll get our first look at GDP for Q1 2024, and as we fade into the weekend, the GDPNow Model from the Atlanta Fed still stands at 2.9% for that quarter.
As we close out next week, we’re going to see the topic of inflation and rate cuts come back into focus because of the March PCE Price Index data. Current expectations see the core PCE Price Index falling to 2.7% on a year-over-year basis from 2.8% in March. If that’s the print we get, we could see some renewed excitement for rate cuts. Our thinking, however, continues to be that the Fed will look for progress toward its 2% target in a variety of metrics, not just one. We’ll see what the April Flash PMI data says but based on what we’ve seen thus far in 2024, the odds of fewer rate cuts are far higher than more.
Here's a closer look at the economic data coming at us next week:
U.S.
Tuesday, April 23
- S&P Global Manufacturing and Services PMI reports – April (9:45 AM ET)
- New Home Sales – March (10:00 AM ET)
Wednesday, April 24
- Weekly MBA Mortgage Applications (7:00 AM ET)
- Durable Orders – March (8:30 AM ET)
- Weekly EIA Crude Oil Inventories (10:30 AM ET)
Thursday, April 25
- Weekly Initial & Continuing Jobless Claims (8:30 AM ET)
- GDP (Advanced Look) – 1Q 2024 (8:30 AM ET)
- Pending Home Sales – March (10:00 AM ET)
- Weekly EIA Natural Gas Inventories (10:30 AM ET)
Friday, April 26
- Personal Income & Spending, PCE Price Index – March (8:30 AM ET)
- The University of Michigan Consumer Sentiment Index (Final) – April (10:00 AM ET)
International
Monday, April 22
- Eurozone: Consumer Confidence Flash - April
Tuesday, April 23
- Japan: Jibun Manufacturing and Services PMI reports - April
- Eurozone: HCOB Manufacturing and Services PMI reports – April
- UK: S&P Global Manufacturing and Services PMI reports – April
Wednesday, April 24
- Germany: Ifo Business Climate, Current Conditions, and Expectations - April
Thursday, April 25
- Germany: GfK Consumer Confidence - May
Friday, April 26
- Japan: Bank of Japan Interest Rate Decision, Bank of Japan Quarterly Outlook
Here's a closer look at the earnings reports coming at us next week:
Monday, April 22
- Open: Albertsons (ACI), SAP SE (SAP), Verizon (VZ)
- Close: Ameriprise Financial (AMP), Nucor (NUE)
Tuesday, April 23
- Open: General Motors (GM), JetBlue Airways (JBLU) Kimberly-Clark (KMB), Lockheed Martin (LMT), Logitech International (LOGI), PepsiCo (PEP), PulteGroup (PHM), UPS (UPS).
- Close: Steel Dynamics (STLD), Tesla (TSLA), Texas Instruments (TXN), Visa (V)
Wednesday, April 24
- Open: Boeing (BA), General Dynamics (GD), Helen of Troy (HELE), Hilton (HLT), Masco (MAS), Silicon Labs (SLAB),
- Close: Ford Motor (F), IBM (IBM), Lam Research (LRCX), Meritage (MTH), Meta Platforms (META), ServiceNow (NOW), United Rentals (URI), Waste Management (WM)
Thursday, April 25
- Open: ADT (ADT), American Airlines (AAL), Caterpillar (CAT), Comcast (CMCSA), Keurig Dr. Pepper (KDP), Labcorp (LH), Lazard (LAZ),
- Close: Alphabet (GOOGL), Intel (INTC), Juniper Networks (JNPR), KLA Corp (KLAC), Microsoft (MSFT), Snap (SNAP), Terex (TEX)
Friday, April 26
- Open: Abbvie (ABBV), Charter Communications (CHTR), Chevron (CVX), Colgate Palmolive (CL), Exxon Mobil (XOM), Piper Sandler (PIPR),
Portfolio Investor Resource Guide
· Economic Data: Here's a List of Links to the Key Economic Data We Closely Watch
· Investing Terminology: 16 Key Terms Club Members Should Know
· 10-Ks: Want to Know About a Stock? Read the Company's Reports
· 10-Qs: Unlock the Numbers and Key Information Behind Your Stock With the 10-Q
· Income Statement -Our Cheat Sheet to Understanding This Financial Document
· Balance sheet, Cash Flow Statements, and Dividends - How to Know If a Company Is Off-Kilter? Read Its Balance Sheet
· Valuation Metrics - Everyone Wants a Value. Here's How Investors Can Find
Portfolio Ratings System
1 - Buy Now (BN): Stocks that look compelling to buy right now.
2 - Stockpile (SP): Positions we would add to on pullbacks or a successful test of technical support levels.
3 - Holding Pattern (HP): Stocks we are holding as we wait for a fresh catalyst to make our next move.
4 - Sell (S): Positions we intend to exit.
ONES
Alphabet GOOGL; $154.09; 1,035 shares; 3.90%; Sector: Communication Services
WEEKLY UPDATE: Shares of Alphabet (GOOGL) joined other Big Tech stocks in moving lower this week despite several price target increases in the last few weeks. While some may focus on that pain, as investors we’ll be looking for opportunities to pick up more shares as the company benefits from AI adoption across its businesses. There is support for the stock near $146, but we see a gap in the chart near the 100-day average ($143). When the company reports next week, the focus will be on its advertising revenue-driven businesses, revenue gains at Google Cloud, and its margin outlook for the coming quarters. With margins in mind, this week Google made cuts to "several teams" in its real estate and finance departments. We see both its Search and YouTube businesses benefitting from the continuing shift to digital advertising, but those businesses should benefit in 2024 as digital advertising tied to the 2024 presidential election heats up.
1-Wk. Price Change: -3.3%; Yield: 0.00%
INVESTMENT THESIS: We believe that while search and digital ad dominance are what will carry shares in the near- to mid-term, longer-term it is the company's artificial intelligence "moat" that will provide for new avenues of growth. AI is what has made the company's search, video, and targeted ad capabilities best-in-class and is the driving force behind the company's success in voice (Google Home) and autonomous driving (Waymo). Furthermore, we believe it is this AI expertise that will also make the company more prevalent in other industries, including healthcare via its subsidiary Verily, as AI and machine learning continue to disrupt operations across industries. Lastly, adding to our positive view of the company's future opportunities, we believe that Alphabet's free cash flow generation and solid balance sheet set it apart and are what will allow the company to continue taking chances on far-out ground-breaking and potentially world-changing projects. The company is also preparing to roll out Gemini Subscription with enterprise plans for workspace, according to a report. All good news for Alphabet.
Target Price: Reiterate $165; Rating: One
Panic Point: $125
RISKS: Regulatory risk (data privacy), competition, and macroeconomic slowdown impacting consumers and therefore ad buyer activity.
Amazon AMZN; $174.63; 835 shares; 3.57%; Sector: Consumer Discretionary
WEEKLY UPDATE: Like other Big Tech stocks, after powering ahead for most of the last six and half months, AMZN shares continued to trade off this week. That occurred in the face of the March Retail Sales report that confirmed digital shopping rebounded sharply amid Amazon’s Big Spring Sale event. That event likely helped boost the company’s Prime subscription business as Consumer Intelligence Research Partners found it hit a new high of 180 million U.S. shoppers exiting March, up 8% year over year. We see that helping set up the company’s March-quarter earnings report next week. With CEO Andy Jassy recently sharing there is more room to reign in costs, margins will be something we focus on for both the company's March quarter and its outlook for the current one. We could see the shares come under pressure should growth metrics at AWS appear to be slow more than expected, In our experience, however, the better insight comes from the context gained by comparing cloud growth metrics across Amazon, Google, and Microsoft. During the company’s earnings call, we’ll be listening for when 2024 Prime Day will fall as it has been known to land in the current quarter, but sometimes early in the September quarter like it was last year. This week AMZN shares were named to Goldman’s Return on Equity growth basket of 50 stocks. Also, this week Truist reiterated its "Buy" rating on the shares with a new $216 price target while Maxim Securities initiated coverage with a $218 target. Like several other Big Tech positions, we have room to add more shares. While we will look to be opportunistic, we will remain disciplined.
1-Wk. Price Change: -6.2%; Yield: 0.0%
INVESTMENT THESIS: We believe upside will result from Amazon's continued eCommerce dominance, AWS's continued leadership in the public cloud space, and ongoing growth of the company's advertising revenue stream, which feeds off Amazon's eCommerce business. Additionally, we believe profitability will continue to improve as AWS and advertising account for a larger portion of total sales as both these segments sport higher margins than the eCommerce operation. While we believe the increasing share of the revenue from these higher margin businesses will be key to driving profitability longer-term, we think margins on eCommerce stand to improve as the company's infrastructure is further built out and economies of scale further kick in. The embedded call option is that management is always looking to enter a new space and generate new revenue streams.
Target Price: Reiterate $200; Rating: One
Panic Point: $155
RISKS: High valuation exposes the stock to volatile swings, eCommerce has exposure to slower consumer spending and competition, management is not afraid to invest heavily, potential headwinds resulting from new eCommerce regulation in India, and management is not scared to invest aggressively for growth, which can at times cause volatile reactions as near-term concerns arise relating to the impact on margins.
Coty Inc. COTY ; $11.15; 14,480 shares; 3.93%; Sector: Consumer Discretionary
WEEKLY UPDATE: Following the thesis-confirming results in quarterly earnings from luxury goods company LVMH (LVMUY), we added to our position in COTY on Wednesday. LVMH’s Perfumes & Cosmetics business was one of the standouts, with revenue for the March quarter up 3% (+7% on a currency-neutral basis). Save for LVMH’s Selective Retailing segment, which is predominantly Sephora, which posted a 5% revenue gain during the quarter, all of LVMH’s other segments saw revenue declines year over year. We see that strength in Sephora explaining the competitive environment cited by Ulta (ULTA) when it reported its quarterly results. But we also see Sephora’s gains confirming the favorable demand environment for Coty’s products. To that end, on its earnings call, LVMH shared it does not see any slowdown in the U.S. beauty market and remarked its prestige business is doing well. On Thursday, L'Oréal reported its March-quarter sales rose 8.3% to 11.24 billion euros and were up 9.4% on a like-for-like basis.
1-Wk. Price Change: 6.1%; Yield: 0.0%
INVESTMENT THESIS: Founded in Paris in 1904, Coty is one of the world's largest beauty companies with a portfolio of iconic brands across fragrance, color cosmetics, and skin and body care. Coty serves consumers around the world, selling luxury and mass-market products in more than 130 countries and territories. The company derives almost 45% of its revenue from the Americas, 44% from Europe, the Middle East, and Africa, and the balance from Asia Pacific. By revenue category, Prestige drives 62% of Coty's revenue but more than 80% of its operating income with the balance derived from its Consumer Beauty segment. Management intends to further grow the Prestige business, expanding its prestige fragrance brands, through the ongoing expansion into prestige cosmetics, and the building of a comprehensive skincare portfolio leveraging existing brands. Management is also targeting margin improvement at its Consumer Beauty brands as well as expanding its presence in China across both of its reporting segments. China's beauty and personal care market is expected to grow at a quicker pace of 5.4% per annum through 2027, putting it at $70 billion-$75 billion by 2027.
Target Price: $14; Rating: One
Panic Point: $9.50
RISKS: Industry competition and consolidation, product efficacy and safety, currency, and brand licensing.
Marvell Technology MRVL; $62.13; 2,370 shares; 3.63%; Sector: Technology
WEEKLY UPDATE: Following Marvell’s MRVL “Accelerated Infrastructure for the AI Era” event last week we reiterated our One rating and $95 price target. Entering this week, Evercore initiated coverage on MRVL shares with an "Outperform" rating but warned of a mid-cycle correction like we are currently seeing unfold in the shares as well as others like Nvidia. On Thursday, Taiwan Semiconductor reported a beat-and-raise March quarter that included stronger year-over gains for its High-Performance Computing segment. We see that confirming Marvell’s H1 2024 guidance for its data center business and we continue to see ramping AI demand as well as the AI-on-device upgrade cycle benefitting all of Marvell’s businesses in the coming quarters. Given the pullback in MRVL shares, the next layer of support is at the 200-day moving average near $61. Should the shares approach that level, we would look to round out the portfolio’s position size. Because of Marvell’s AI chip relationships with Alphabet, Amazon, and now Microsoft, March-quarter comments about their AI and data center businesses are potential catalysts for MRVL.
1-Wk. Price Change: -11.4%; Yield: 0.4%
INVESTMENT THESIS: Marvell is a fabless supplier of high-performance standard and semi-custom infrastructure semiconductor solutions. These solutions power the data economy, enabling the data center, carrier infrastructure, enterprise networking, consumer, and automotive/industrial end markets. With roughly 75%-80% of Marvell's revenue stream tied to digital infrastructure, we see it continuing to benefit from rising content consumption and creation. Pointing to that rising demand that necessitates network densification and the build of digital infrastructure, Ericsson sees global monthly average usage per smartphone reach 46 gigabytes (GB) by the end of 2028 vs. 19 GB in 2023 and 15 GB in 2022.
Target Price: Reiterate $95; Rating: One
Panic Point: $59
RISKS: Technology risk, customer risk, competition risk, reliance on manufacturing partners, and supply chain constraints.
Vulcan Materials Company VMC ; $252.06 ; 613 shares; 3.79%; Sector: Building Materials
WEEKLY UPDATE: Shares of VMC have fallen recently and are in the middle of a corrective period. With a series of lower highs and lower lows, the stock just recently fell below the 50-day moving average and confirmed the move, hence the downtrend is in place. Some potential downside targets include a gap fill from February near $241, the 100-day moving average also lives there but is rising daily. This week, Jefferies reiterated a "buy" rating on Vulcan and raised its price target to $319 from $298. Goldman also raised its target to $320 while Morgan Stanley upped theirs to $290 from $245. Heading into the company’s quarterly earnings report on May 2, our price target sits at $310. When Caterpillar (CAT) and Terex (TEX) report next week, their comments on domestic construction activity could be a catalyst for VMC shares.
1-Wk. Price Change: -4.1%; Yield: 0.7%
INVESTMENT THESIS: Vulcan Materials operates primarily in the U.S. and is the nation's largest supplier of construction aggregates (primarily crushed stone, sand, and gravel), a major producer of asphalt mix and ready-mixed concrete, and a supplier of construction paving services. Its products are the indispensable materials used in building homes, offices, places of worship, schools, hospitals, and factories, as well as vital infrastructure including highways, bridges, roads, ports and harbors, water systems, campuses, dams, airports, and rail networks. Ramping spending associated with the Biden Infrastructure Law should drive demand for Vulcan's products over the coming years. Vulcan has historically complemented its organic growth prospects by acquiring businesses to expand its geographic reach and product scope. Since 2014, the company has acquired more than two dozen companies, including the 2021 acquisition of U.S. Concrete. That combination has allowed the company to deliver steady top and bottom-line growth over the last decade, with only a modest decline when the pandemic hit in 2020.
Target Price: Reiterate $310; Rating: One
Panic Point: $225
RISKS: General economic and business conditions; dependence on the construction industry; timing of federal, state, and local funding for infrastructure; changes in the level of spending for private residential and private nonresidential construction.
TWOS
Apple AAPL ; $165.00; 790 shares; 3.20%; Sector: Technology
WEEKLY UPDATE: It was a challenging week for Apple AAPL shares following Q1 2024 smartphone findings from IDC that showed iPhone shipments fell just over 9% in the quarter. That report and concerns for Apple’s business in China led Needham to cut its Apple estimates for the March quarter. Yet Needham maintained its $220 price target on AAPL, and its "Buy" rating, which tells us it is likely thinking, much like us, Apple’s iPhone, Mac, and iPad business are poised to benefit from the upcoming AI-on-device upgrade cycle. While we don’t think Apple will “kitchen sink” it when it reports its quarterly results on May 2, its outlook for the current quarter could underwhelm the market. If the market’s reaction to that report drags the shares lower, as we’ve discussed, we would be interested in picking up additional AAPL stock before the AI upgrade cycle begins. Ahead of Apple’s earnings report, we will be flagging those for key smartphone suppliers, including Qualcomm, Skyworks (SWKS), Qorvo (QRVO) and Samsung’s (SSNLF).
1-Wk. Price Change: -6.5%; Yield: 0.6%
INVESTMENT THESIS: While we acknowledge that near-to-midterm performance remains heavily influenced by iPhone sales, the dynamic is shifting as investors finally place greater emphasis on Services growth. We are bullish on the 5G upgrade cycle and believe longer-term upside will continue to come as Services revenue grows its share of overall sales. Services provide for a recurring revenue stream at higher margins, a factor that serves to reduce earnings volatility while allowing for a higher percentage of sales to fall to the bottom line; as a result, we believe that Services growth and the installed base, are much more important than how many devices the company can sell in each 90-day period. In addition to improved profitability, we also believe the transparent nature of this revenue stream will demand an expanded price-to-earnings multiple as segment sales grow. Furthermore, we believe that Apple's desire to push deeper into the healthcare arena will help make its devices invaluable as more life-changing features are added and the company works to democratize health records. Lastly, also see upside resulting from increased adoption of wearables (think the Apple Watch) and potential new product announcements such as an AR/VR headset or an update on Project Titan, the company's secretive autonomous driving program.
Target Price: Reiterate $205; Rating: Two
Panic Point: Reiterate $150
RISKS: Slowdown in consumer spending, competition, lack of new product innovation, elongated replacement cycles, failure to execute on Services growth initiative.
Applied Materials Inc. AMAT ; $189.77; 275 shares; 1.28%; Sector: Semiconductor Manufacturing
WEEKLY UPDATE: After moving sideways for most of March and the start of April, AMAT shares were under pressure this week following weaker-than-expected guidance from lithography company ASML (ASML) and Taiwan Semiconductor (TSM) reducing its outlook for the semiconductor market this year. That suggests the incremental demand for chip equipment could be slightly softer than previously expected, largely due to the automotive market. We attribute that to the slowing demand outlook for EVs. AI and data center demand should continue to be a stronger driver of chip capacity as should re-shoring efforts in the U.S., eurozone, and Japan. We’ve said a few times we would like to build our exposure of AMAT shares and that remains the case. This will have us very interested in quarterly results and guidance next week from Lam Research (LRCX). Should it follow ASML and offer softer-than-expected guidance, we are likely to see AMAT follow those shares lower. That could bring us an opportunity to make a move with AMAT.
1-Wk. Price Change: -8.7%; Yield: 0.8%
INVESTMENT THESIS: Applied provides manufacturing equipment, services, and software to the semiconductor, display, and related industries. With its diverse technology capabilities, Applied delivers products and services that improve device performance, power, yield, and cost. Applied's customers include manufacturers of semiconductor chips, liquid crystal, and organic light-emitting diode displays, and other electronic devices. Applied operates in three reportable segments: Semiconductor Systems (73% of 2022 revenue, 78% of 2022 operating income), Applied Global Services (22%, 19%), and Display and Adjacent Markets (5%, 2%). Key customers include Samsung (12% of 2022 sales), Taiwan Semiconductor (20%), and Intel (10%).
Target Price: Reiterate $225; Rating: Two
Panic Point: $175
RISKS: Manufacturing and Supply Chain, Competitive Factors, Government Regulation, Technology Change.
Axon Enterprise AXON; $293.61; 535 shares; 3.86%; Sector: Aerospace & Defense
WEEKLY UPDATE: After hitting a record high last week at $326.09, AXON shares traded off as part of the market’s overall move lower this week. We chalk that up to shorter-term horizon investors peeling off some gains because of their vapid move from below $250 in early January. Because some of last week’s gains were due to Needham hiking its price target to a Wall Street high of $400 given its expectation for share gains at its recently acquired real-time crime center Fusus business, we are not surprised by the retrenchment. While we continue to think Axon has a strong and growing position in the public safety market, and we remain bullish on the positive mix shift toward cloud, we would rather see Axon court some wins with its recently acquired real-time crime center Fusus business than simply assume they will be had. In the chart, we see a gap near the $275 level as well as support at the 100-day moving average near $274. If AXON found their way to that level and successfully tested that support level, we would be interested in picking up additional shares.
1-Wk. Price Change: -5.5%; Yield: 0.00%
INVESTMENT THESIS: Axon Enterprise develops, manufactures, and sells conducted energy devices and cloud-based digital evidence management software designed for use by law enforcement, corrections, military forces, private security personnel, and private individuals for personal defense. The company operates in two segments: Taser and Software & Sensors. Taser develops and sells CEDs used for protecting users and virtual reality training. Software & Sensors manufactures fully integrated hardware and cloud-based software solutions such as body cameras, automated license plate reading, and digital evidence management systems. Axon delivers its products worldwide and gets most of its revenue from the United States. President Biden's fiscal year 2023 budget requests a fully paid-for new investment of approximately $35 billion to support law enforcement and crime prevention -- in addition to the President's $2 billion discretionary request for these same programs. According to Mordor Intelligence, the wearable, and body-worn cameras market on its own was valued at $1.62 billion in 2020 and is expected to reach $424.63 billion by 2026.
Target Price: Reiterate $330; Rating: Two
Panic Point: $260
RISKS: Manufacturing and supply chain, competitive factors, government regulation, technology change.
Bank of America Corp. BAC ; $36.97 ; 4,000 shares; 3.63%; Sector: Financial Services
WEEKLY UPDATE: Quarterly results at Bank of America BAC topped expectations with investment banking and asset management being standouts. The bank guided its Net Interest Income modestly lower for the current quarter but shared it sees it rebounding in H2 2024. Part of its rationale is that it still sees three rate cuts unfolding later this year, but as we shared in our Alert to members, we are skeptical. While we could trim our BAC price target to reflect more realistic NII expectations in H2 2024, we’d rather not whipsaw around as we digest the upcoming Senior Loan Officer Opinion Survey (SLOOS) on bank lending that should be out in the next few weeks. As that report is had, we’ll also have a better sense of the health of the IPO market, which would allow us to make a more informed decision when it comes to our price target. Late in the week Wolfe Research upped its rating on BAC shares to "Outperform" from "Peer Perform" with a $42 target.
1-Wk. Price Change: 3.3%; Yield: 2.6%
INVESTMENT THESIS: Bank of America is one of the world's leading financial institutions, serving individual consumers, small and middle-market businesses, and large corporations with a full range of banking, investing, asset management, and other financial and risk management products and services. The company provides unmatched convenience in the United States, serving approximately 67 million consumer and small business clients with approximately 3,900 retail financial centers, approximately 16,000 ATMs, and award-winning digital banking with approximately 56 million verified digital users. Bank of America is a global leader in wealth management, corporate and investment banking, and trading across a broad range of asset classes, serving corporations, governments, institutions, and individuals around the world. Bank of America offers industry-leading support to approximately 3 million small business households through a suite of innovative, easy-to-use online products and services. The company serves clients through operations across the United States, its territories, and approximately 35 countries. From a reporting basis, the company's business breaks down as follows: Net Interest Income breakdown: Consumer Banking 57%, Global Banking 23%, Global Wealth & Investment Management 14%, and Global Markets 6%; Income Before Tax breakdown: Consumer Banking 42%, Global Banking 27%, Global Wealth & Investment Management 16%, and Global Markets 15%. Bank of America pays a quarterly dividend of $0.22 per share.
Target Price: $39; Rating: Two
Panic Point: $31
RISKS: Financial markets, fiscal, monetary, and regulatory policies, economic conditions, and credit ratings.
Costco Wholesale COST ; $709.51; 240 shares; 4.16%; Sector: Consumer Staples
WEEKLY UPDATE: Last week Costco delivered a knockout March revenue report and this week’s March Retail Sales report confirmed it. Despite that confirmation, COST shares traded off with the market this week, but we continue to see the company gaining incremental consumer wallet share as it continues to expand its warehouse footprint and inflation pressures persist. With the shares below the 50-day moving average at $730.32, the next layer of support is with the 100-day moving average at $690.27. While the shares may not retreat to such levels, if they did it would be a good pick-up for members. For now, we’ll keep our $800 price target, but if the company’s April sales show similar gains, it could be a reason for us to revisit that target with an upward bias. Costco will pay its next quarterly dividend on May 10 to shareholders of record on April 26. We continue to wait for the eventual membership fee price increase announcement, one that will lead to upward EPS expectations and be a catalyst to boost our price target.
1-Wk. Price Change: -3.0%; Yield: 0.6%
INVESTMENT THESIS: We like Costco's long-term prospects, driven by a club-based operating model that focuses on volumes, not margins, and therefore offers its customers a value proposition of everyday low prices. The strength of this model has created an incredibly loyal customer base with low churn and continued share gains in both bricks-and-mortar and e-commerce. This is a global concept, evidenced by the strength of sales both in the U.S. and abroad, which includes an emerging China opportunity. We see the company's membership model as a key differentiator vs. other retailers and its plans to open additional warehouse locations in the coming quarters should drive retail volumes and the higher-margin membership fee income as well. We also appreciate management's approach to capital returns and their willingness to return cash when it is in excess on the balance sheet.
Target Price: Reiterate $800. Rating: Two
Panic Point: $615
RISKS: Inability to pass through higher costs, fuel prices, weaker consumer, and membership churn.
Elevance Health ELV; $531.42; 275 shares; 3.60%; Sector: Health Care
WEEKLY UPDATE: Following Elevance’s beat-and-raise March-quarter earnings report on Thursday, we lifted our price target to $560 from $550. Management reiterated its long-term compound annual growth target of 12%, management lifted its 2024 EPS outlook to “above $37.20" compared to its prior guidance of $37.15 and the market consensus of $37.10. The key to the ELV story has been the company’s ability to drive continued improvement in its benefit-cost expense. Part of that effort is tied to trimming membership programs that were a drag on margins. While some may focus on the net membership decline, we favor disciplined companies that focus on driving profit improvement especially if it means exiting markets that weigh down its margins.
1-Wk. Price Change: 6.8%; Yield: 1.2%
INVESTMENT THESIS: Elevance, formerly Anthem/Blue Cross Health, is a premier healthcare brand that appears to be in the sweet spot for HMO companies. Mostly domestic, this company has a wide reach and coverage across the U.S., serving more than 118 million people via medical, pharmacy, clinical, and care solutions. Founded in 1944, Elevance offers a terrific business model that works in boom or bust economic times. The opportunity to find a company with reliable and dependable revenue and cash flows is right here with Elevance. Revenue growth for this company has surged in recent years, with better than double-digit growth since 2018 as the company thrived during the pandemic.
Target Price: Reiterate $560; Rating: Two
Panic Point: $425
RISKS: With any insurance business the risk is high for changes in regulation and government programs. Since the onset of Obamacare more than 10 years ago, companies like Elevance have changed their model to be more in line with a better cost/benefit analysis, reducing waste and squeezing out excesses (as was outlined and suggested in Obamacare). Separately, as the population increases and ages, there is more opportunity for Elevance to grow, but with those changes, there is a risk. Lastly, competition is brisk with some very strong opponents who keep their costs low (Humana, Cigna, UNH, CVS/Healthnet).
The Energy Select Sector SPDR Fund XLE ; $94.97; 1,345 shares; 3.13%; Sector: Energy
WEEKLY UPDATE: Energy prices have been quite volatile of late, with XLE hitting fresh highs last week at just under $100 but they have since backed off a bit. Not exactly surprising given the shares have been very overbought for about a month, so a corrective move was due. We currently see the XLE below the 200-day moving average, and that could be the end of this move lower. If not, the $91 level sets up as the next support area, and then $89 below there (50-day moving average). Uncertainties overseas, especially in oil-rich Iran, have put a bullish flame under crude oil. Chevron (CVX) and ExxonMobil (XOM), which are 40%+ of the XLE continue to perform well and both report this coming Friday. Late this week, Truist upgraded its rating in the energy sector to "overweight" due to an improvement in technical factors. Similar to our thinking on GLD shares, should XLE shares continue to trend much higher, we may look to lock in another slice of these outsized gains. We’ll be revisiting this thought following the April Flash PMI data that will be released next week.
1-Wk. Price Change: -1.2%; Yield: 3.5%
INVESTMENT THESIS: The Energy Select Sector SPDR Fund is an exchange-traded fund that tracks the performance of the Energy Select Sector Index. The ETF holds large-cap U.S. energy stocks. It invests in companies that develop & produce crude oil & natural gas and provide drilling and other energy-related services. The holdings are weighted by market capitalization.
Target Price: Reiterate $100; Rating: Two
Panic Point: $84
RISKS: Interest rates, weakness in the broad economy, energy prices.
First Trust Nasdaq Cybersecurity ETF CIBR ; $52.63; 2,530 shares; 3.26%; Sector: Cybersecurity
WEEKLY UPDATE: Another week, another batch of headlines on the latest hacks and cyber-attacks. The CIBR chart shows a gentle decline from recent highs at $59 after a monster run higher from late October 2023. With a series of lower highs, and lower lows the CIBR is in a downtrend. Late in the week, CIBR shares were on the cusp of being oversold. With support at the 200-day moving average at $50.31, we are interested in expanding the portfolio’s position size closer to that price level.
1-Wk. Price Change: -4.0%; Yield: 0.0%
INVESTMENT THESIS: The First Trust Nasdaq Cybersecurity ETF seeks investment results that correspond generally to the price and yield (before the fund's fees and expenses) of an equity index called the Nasdaq CTA Cybersecurity Index. The Nasdaq CTA Cybersecurity Index is designed to track the performance of companies engaged in the cybersecurity segment of the technology and industrial sectors. It includes companies primarily involved in the building, implementation, and management of security protocols applied to private and public networks, computers, and mobile devices to protect the integrity of data and network operations. To be included in the index, a security must be listed on an index-eligible global stock exchange and classified as a cybersecurity company as determined by the Consumer Technology Association. Each security must have a worldwide market capitalization of $250 million, have a minimum three-month average daily dollar trading volume of $1 million, and have a minimum free float of 20%.
Target Price: Reiterate $62; Rating: Two
Panic Point: Reiterate $48
RISKS: Cybersecurity spending, technology, and product development, the timing of product sales cycle, new products, and services in response to rapid technological changes and market developments as well as evolving security threats.
Laboratory Corporation of America LH ; $201.48; 165 shares; 0.81%; Sector: Healthcare
WEEKLY UPDATE: On Thursday, we called up shares of Labcorp LH from the Bullpen, establishing a starter position and our $235 price target. Even though the shares are oversold from a technical perspective on the daily chart, we would look to build out the position more aggressively closer to $190 and even more so at modestly lower levels. In terms of calendar items, Labcorp will report its quarterly results on April 25 and by starting this position when we did, we will qualify for the record date for its next quarterly dividend. That date is May 28, and the payment date for the company’s $0.72 per share quarterly dividend is June 12.
1-Wk. Price Change: 1.6%; Yield: 1.4%
INVESTMENT THESIS: Labcorp is a global leader in innovative and comprehensive laboratory services that provides vital information to help doctors, hospitals, pharmaceutical companies, researchers, and patients make clear and confident decisions. By leveraging its diagnostics and drug development capabilities, the company provides insights and accelerates innovations to improve health and improve lives. The Company is organized under two segments, consisting of Diagnostics Laboratories (Dx), which includes routine testing and specialty/esoteric testing, and Biopharma Laboratory Services (BLS), consisting of Early Development Research Laboratories and Central Laboratory Services. Our attraction to LH shares stems from the combination of the aging population driving diagnostic testing growth and the increasing array of diagnostic testing as well. That combination is expected to drive the healthcare testing services market to $12.6 billion by 2029, from $7.4 billion in 2024, according to Markets and Markets. To augment its position in oncology, women's health, autoimmune diseases, and neurology, the company has been expanding through acquisitions and partnerships with health systems and regional local labs.
Target Price: Reiterate $235; Rating: Two
Panic Point: Reiterate $170
RISKS: Macroeconomic factors, changes in healthcare reimbursement models and products, government regulations, product discontinuations or recalls.
Lockheed Martin Corp. LMT; $463.87; 330 shares; 3.76%; Sector: Aerospace & Defense
WEEKLY UPDATE: Lockheed Martin was awarded a $17 billion contract to develop the next generation of interceptors that would guard the United States against an intercontinental ballistic missile attack. The reports did not indicate the length of the contract, but the first interceptor is expected to be operational in 2028. For context, the company’s overall backlog exiting 2023 stood at a record $160.6 billion, making this a sizable win for the company. Hopefully, when Lockheed reports its earnings on April 23, we will get more details on this program and a better sense for when F-35 shipments will ramp up. Those details will influence EPS expectations and price targets. From a technical perspective, LMT stock has made a nice move off the February lows, rising nearly 20% but is right at the highs from 2024, which is strong resistance. Earnings are next week and if taken well we could finally see LMT attack the $500 level, something not seen since 2023. The daily chart is not quite overbought yet while the MACD is making a bullish crossover move. All indicators point to higher prices from Lockheed Martin.
1-Wk. Price Change: 3.0%; Yield: 2.7%
INVESTMENT THESIS: Lockheed Martin is the largest defense contractor globally and has dominated the Western market for high-end fighter aircraft since the F-35 program was awarded in 2001. Lockheed's largest segment is aeronautics, which is dominated by the massive F-35 program. Lockheed's remaining segments are rotary and mission systems, which is mainly the Sikorsky helicopter business; missiles and fire control, which creates missiles and missile defense systems; and space systems, which produces satellites and receives equity income from the United Launch Alliance joint venture. Historically, the stability of defense spending has been a haven during periods of economic uncertainty, and we see that repeating once again even as geopolitical conflicts are likely to lead to incremental demand for Lockheed's products. The company has increased its dividend consistently over the last 19 years and is widely expected to boost it again in the coming days. In October 2022, Lockheed announced its board authorized the purchase of up to an additional $14.0 billion of LMT stock under its share-repurchase program.
Target Price: $520; Rating: Two
Panic Point: $375
RISKS: Contracts and budget risk with the U.S. government and the Department of Defense, F-35 program funding and renewal, competition, and subcontractor issues.
Mastercard MA; $455.39; 275 shares; 3.06%; Sector: Info. Tech
WEEKLY UPDATE: MA started to pull back from an overbought condition last week but could not find any footing at the 50-day moving average. Failing there puts the stock in correction mode, with lower targets of $447 and then perhaps $421 (200-day moving average). It’s not that the company has done anything wrong here, but the runup from October’s low was extreme and the stock was due for a rest. On the technical side, there is a bit more to go for an extreme oversold reading, at which point it could be a good time to pick up some additional shares. This week Baird maintained a "Buy" and adjusted its price target upward to $545 from $525, JP Morgan maintained its "Overweight" rating with a $520 target while Bank of America believes Mastercard and Visa will match revenue forecasts with perhaps a "small EPS beat." When both report their March-quarter results, we’ll be sizing up their respective transaction volumes following the year-over-year decline reported by American Express (AXP) on Friday. For now, our price target remains $490, but given the strength of the economy and return of real wage growth in the U.S. we may need to revise that higher should oncoming data confirm those trends. While we wait for that data, you should mark your calendar for May 9, which is when Mastercard will pay its next quarterly dividend of $0.66 per share.
1-Wk. Price Change: -2.1%; Yield: 0.6%
INVESTMENT THESIS: Mastercard is a card network company that benefits from the secular shift away from cash transactions and toward card-based and electronic payments. On COVID-19 dynamics, we view MA as a "reopening" play and an economic recovery play within technology because its cross-border volumes fell sharply during the pandemic but will rebound as mobility increases and travel restrictions ease. Mastercard has more international exposure relative to Visa (V), making its growth outlook more susceptible to new travel restrictions. However, we view MA as the better long-term play as we are betting on that inevitable recovery.
Target Price: Reiterate $490 Rating: Two
Panic Point: $400
RISKS: The recovery in cross-border transactions, regulation in the payments market, competition from other fintechs, and pricing pressures.
Microsoft Corp. MSFT; $399.12; 325 shares; 3.19%; Sector: Technology
WEEKLY UPDATE: In recent weeks, MSFT received several price target increases and ratings boosts, however, the shares continued to trade off this week resulting in their falling almost 7% over the last month. With funds flowing out of the market and fear returning, it’s not surprising to see some of the December and March quarter highfliers come under some pressure. For MSFT shares, it means we will be closely watching the 100-day moving average at $399. We do have room to incrementally build the portfolio’s position in MSFT, but with its quarterly results in the first half of next week and guidance being a key factor in the current earnings season, we’re inclined to digest its updated outlook first. If the shares retreated further with the next level of support near $367, that would be a far more compelling point to add to our holdings given its AI prospects and further cloud gains.
1-Wk. Price Change: -5.4%; Yield: 0.8%
INVESTMENT THESIS: We believe the cloud to be a secular growth trend and that upside to the shares will result from Microsoft's hybrid cloud leadership as the company grabs market share in this expanding industry. While companies may look to build out multi-cloud environments, Microsoft's Azure offering will be a prime choice thanks to its decision to provide the same "stack" used in the public cloud, to companies for their on-premises data centers. Additionally, we would note that hybrid environments are currently the preference for most companies because they allow them to maintain critical data in-house while taking advantage of the agility and scalability provided by public clouds. Outside of the cloud opportunity, we maintain a positive view on the company's growing gaming business, which we believe is becoming an increasingly prominent factor in the Microsoft growth story as gaming becomes more mainstream, management works to convert its gaming revenue from one-time license purchase to a recurring subscription model and as technologies like augmented/virtual reality evolve. Finally, as it relates to LinkedIn and other subscription-based services such as O365 and various Dynamics products, we continue to value them highly for their recurring revenue streams, which, we remind members, provide for greater transparency of future earnings.
Target Price: $450; Rating: Two
Panic Point: Reiterate $350
RISKS: Slowdown in IT spending, competition, cannibalization of on-premises business by the cloud.
Morgan Stanley MS ; $90.66; 1,575 shares; 3.51%; Sector: Financial Services
WEEKLY UPDATE: Quarterly results at Morgan Stanley topped expectations with investment banking and asset management being standouts. With incremental signs of an improving investment banking landscape and the prospect for continued share gains in its asset management business, we continue to favor MS shares even after their nice recovery this week. We will continue to monitor the IPO market and should that activity accelerate further it would be a reason for us to revisit our MS price target, which currently sits at $100. Late in the week, HSBC boosted its price target for MS to $102 from $100, citing higher wealth management and investment banking earnings.
1-Wk. Price Change: 5.2%; Yield: 3.8%
INVESTMENT THESIS: Morgan Stanley reports in three business segments: Institutional Securities (42% of trailing 12-month revenue, 38% of trailing 12-month Income Before Tax), Wealth Management (48%, 55%) and Investment Management (10%, 6%). While the IPO window has yet to reopen, the potential IPO class for 2024 continues to build with recent additions including Panera Bread, Reddit, Fanatics, and Skims, which is backed by Kim Kardashian. This along with the Fed increasingly likely to start cutting rates in H1 2024, suggests we are far closer to the IPO window opening on a sustained basis than we have been in some time. That would be a boon to private equity firms and others that have been nursing IPO candidates during the dark period and a positive for Morgan's investment banking business. Marginally lower rates could also generate a pick-up in M&A activity as the cost of capital with rates improving. As the Fed continues its cutting cycle to get rates back to normalized levels, that effort would also reduce rates for stock market alternatives, ones that quashed the "there is no alternative" trade earlier this year. That along with folks continuing to be behind in retirement savings bodes well for Morgan's wealth management business in the coming quarters.
Target Price: $100; Rating Two
Panic Point: $78
RISKS: Market and interest rate risk, credit risk, country risk, and operational risk, including cybersecurity.
Nvidia Corp. NVDA; $762.00; 145 shares; 2.77%; Sector: Technology
WEEKLY UPDATE: Entering this week, Citi opened a 90-day positive catalyst watch on NVDA shares. Shortly thereafter, Evercore initiated coverage on NVDA with an "Outperform" rating but warned of a mid-cycle correction like we are currently seeing unfold in the shares as well as others like Marvell. On Thursday, following the better-than-expected March-quarter results and guidance from Taiwan Semiconductor that included stronger year-over gains for its High-Performance Computing segment, we picked up some additional NVDA shares for the portfolio. Even after that latest addition, the portfolio’s position size is far from full. We will continue to add NVDA shares when the opportunity knocks. Upcoming catalysts to watch will be quarterly results from Intel (INTC), Advanced Micro Devices (AMD), Alphabet, Microsoft, Amazon and Meta Platforms (META).
1-Wk. Price Change: -13.6%; Yield: 0.0%
INVESTMENT THESIS: Nvidia is well positioned to benefit from ramping AI and data center spending. The company pioneered accelerated computing to help solve the most challenging computational problems. Nvidia is now a full-stack computing infrastructure company with data-center-scale offerings that are reshaping the industry. The company's full stack includes the foundational CUDA programming model that runs on all Nvidia GPUs, as well as hundreds of domain-specific software libraries, software development kits, or SDKs, and Application Programming Interfaces, or APIs. This deep and broad software stack accelerates the performance and eases the deployment of Nvidia accelerated computing for computationally intensive workloads such as artificial intelligence, or AI, model training and inference, data analytics, scientific computing, and 3D graphics, with vertical-specific optimizations to address industries ranging from healthcare and telecom to automotive and manufacturing. Nvidia reports in two business segments: Compute & Networking and Graphics. The Compute & Networking segment (78% of revenue, 85% of operating income) is comprised of Data Center accelerated computing platforms and end-to-end networking platforms including Quantum for InfiniBand and Spectrum for Ethernet; NVIDIA DRIVE automated-driving platform and automotive development agreements; Jetson robotics and other embedded platforms; Nvidia AI Enterprise and other software; and DGX Cloud software and services. The Graphics segment (22% of revenue, 15% of operating income) includes GeForce GPUs for gaming and PCs, the GeForce NOW game streaming service and related infrastructure; Quadro/NVIDIA RTX GPUs for enterprise workstation graphics; virtual GPU, or vGPU, software for cloud-based visual and virtual computing; automotive platforms for infotainment systems; and Omniverse Enterprise software for building and operating metaverse and 3D internet applications.
Target Price: $950; Rating Two
Panic Point: $760
RISKS: Market and interest rate risk, credit risk, country risk, and operational risk, including cybersecurity.
PepsiCo Inc. PEP; $174.13; 800 shares; 3.41%; Sector: Consumer Defensive
WEEKLY UPDATE: PEP shares had a relatively strong showing this week with good relative strength, robust volume, and a much-needed lift off the medium-term moving averages. The MACD is nearly on a buy signal cross-over, but so far money flow remains negative. We will need to see a string of up sessions for PepsiCo over the coming days, and with earnings out soon a bit of momentum leading into the print would be a positive development. Retail sales came in stronger than expected, which means grocery items such as Pepsi products are doing better than thought. The March Retail Sales report showed grocery store sales for the March quarter rose 0.8% year over year, a positive indicator for the company’s domestic businesses in what is their seasonally weakest quarter. Recently Jefferies joined our thinking that PepsiCo management’s outlook for 2024 looks to be conservative. When PepsiCo reports, we would be disappointed if management does not inch up its guidance like it typically does this time of year. This Dividend King is due to announce its next quarterly dividend, and we could see it time that announcement alongside next week’s earnings report.
1-Wk. Price Change: 3.6%; Yield: 2.9%
INVESTMENT THESIS: PepsiCo is one of the largest food-and-beverage companies globally. It makes, markets, and sells a slew of brands across the beverage and snack categories, including Pepsi, Mountain Dew, Gatorade, Doritos, Lays, and Ruffles. The firm uses a largely integrated go-to-market model, though it does leverage third-party bottlers, contract manufacturers, and distributors in certain markets. In addition to company-owned trademarks, Pepsi manufactures and distributes other brands through partnerships and joint ventures with companies such as Starbucks. The combination of the consumable nature of those products along with PepsiCo's ability to realize price increases has led to consistent revenue, EPS, and dividend growth during both the Great Recession and the Covid pandemic.
Target Price: Reiterate $185; Rating: Two
Panic Point: $145
RISKS: Economic conditions, supply chain constraints, raw material costs.
Qualcomm Inc. QCOM ; $157.63; 1,040 shares; 4.01%; Sector: Technology
WEEKLY UPDATE: Following March-quarter data from IDC that showed smartphone industry volumes rose 7.8% year over year to 289.4 million units we boosted our QCOM price target to $200 from $175. That action was underscored by quarterly results from Taiwan Semiconductor (TSM) on Thursday that showed its smartphone business rose 26% year over year, another data point pointing to the normalization of Android smartphone inventories. TSM’s guidance for the current quarter points to another strong showing for smartphones. As Qualcomm announces AI-related wins, we suspect the market will rethink not only how it values QCOM but also the 2024-2025 smartphone AI-on-device upgrade cycle. Apple, Samsung, and key suppliers including Skyworks (SWKS) and Qorvo (QRVO) as well as those from Qualcomm will provide further insight into the smartphone market and the expected AI-on-device upgrade cycle that should benefit our QCOM shares.
1-Wk. Price Change: -8.0%; Yield: 2.2%
INVESTMENT THESIS: Qualcomm focuses on foundational technologies for the wireless industry, including 3G (third generation), 4G (fourth generation), and 5G (fifth generation) wireless technologies and processor technologies including high-performance, low-power computing, and on-device artificial intelligence technologies. As a connected processor company, its technology roadmap aims to enable the connected intelligent edge (the next generation of smart devices) across industries and applications beyond handsets, including automotive and the Internet of Things (IoT). Qualcomm has three reportable segments: QCT (Qualcomm CDMA Technologies) semiconductor business, which develops and supplies integrated circuits and system software based on 3G/4G/5G and other technologies for use in mobile devices; automotive systems for connectivity, digital cockpit, and ADAS/AD; and IoT including consumer electronic devices; industrial devices; and edge networking products. QCT accounts for 80%-85% of revenue. QTL (Qualcomm Technology Licensing) licensing business grants licenses or otherwise provides rights to use portions of the company's intellectual property portfolio, which includes certain patent rights essential to and/or useful in the manufacture and sale of certain wireless products. QTL accounts for ~15% of Qualcomm's revenue but contributes a greater portion of the company's operating income.
Target Price: $200; Rating Two
Panic Point: $140
RISKS: Customer risk, technology advancement, competition risk, third-party supplier, and manufacturing partner risk.
SPDR Gold Shares ETF GLD ; $221.05; 312 shares; 1.70%; Sector: Commodities
WEEKLY UPDATE: Gold has been on the move lately, no doubt with the uncertainties in the world and an insatiable appetite for countries to move toward hard currency. Since March the GLD has been on a meteoric rise, a stunning 20% move in just over six weeks. The economic data has been pointing towards sticky inflation, and gold is a nice hedge against higher prices. Recent reports from the CPI and PPI point towards this happening, and the Federal Reserve is responding by knocking down rate cut expectations. GLD had been overbought here for a while but that is by no means a reason to sell. This week Citi shared expectations for gold to hit $3,000 per ounce over the next 6-18 months, an outlook that follows last week’s year-end price target revision by Goldman Sachs to $2,700. Should GLD shares keep climbing much further, the smart move will be to realize at least a portion of these sharp gains. Also, if Middle East tensions start to de-escalate, it would be a reason to lock in a slice of recent GLD gains.
1-Wk. Price Change: 1.9%; Yield: 0.0%
INVESTMENT THESIS: The GLD ETF is a proxy for gold. This "trust" buys and sells gold futures each day to mimic the daily moves in the underlying asset, in this case, gold. We see gold as an ideal hedge against a weaker dollar, strong inflation (which tends to weaken the dollar) alternative, and in uncertain times (worry over war and battles). For the past 15 years, gold has been a strong asset class held by fund managers, countries, and banks. The metal is not correlated with markets and will move based on the demand/supply dynamic in the marketplace. Other precious metals such as silver and platinum are good proxies for the criteria stated earlier, however, gold is far more liquid and offers better upside opportunities.
Target Price: Reiterate $220; Rating: Two
Panic Point: $190
RISKS: Weak inflation data, interest rate risk, dollar strength relative to other currencies, geographic risk.
United Rentals URI ; $628.34; 232 shares; 3.56%; Sector: Industrials
WEEKLY UPDATE: URI has pulled back sharply; we discussed URI technicals at length in a Chart of the Day and noted the recent drop on heavier turnover. The current moving averages (short and medium term) are bending lower and will now be resistance for URI. One target is coming into view, the 100-day moving average at $617, but if that does not hold the 200-day moving average comes in at roughly $532. A pullback to such levels would open up additional room to add additional URI shares, but as of now, the probability of such a pronounced pullback is low given multiple stimulus streams driving non-residential construction. This week saw Morgan Stanley raise its target to $678 from $500, while Goldman Sachs sees $790 in the future. We have a price target of $750. URI will report its quarterly earnings on April 24 with an earnings call the following morning. As we digest those results and guidance, we’ll be cross-referencing them with comments on domestic construction activity from Caterpillar and Terex.
1-Wk. Price Change: -6.9%; Yield: 1.0%
INVESTMENT THESIS: United Rentals, the largest equipment rental company in the world, operates throughout the United States and Canada, and has a limited presence in Europe, Australia, and New Zealand. It serves industrial and other non-construction; commercial (or private non-residential) construction; and residential construction. Industrial and other non-construction rentals represented approximately 50% of rental revenue, primarily reflecting rentals to manufacturers, energy companies, chemical companies, paper mills, railroads, shipbuilders, utilities, retailers, and infrastructure entities; commercial construction rentals represented approximately 46% of rental revenue, primarily reflecting rentals related to the construction and remodeling of facilities for office space, lodging, healthcare, entertainment, and other commercial purposes; and residential rentals around 4% of revenue. We see the company benefiting on three fronts -- the seasonal uptick in construction spending; the release of funds and projects associated with the five-year Biden Infrastructure Bill; and the company's nip-and-tuck acquisition strategy that should further enhance its geographic footprint. In January, the company announced a fresh $1 billion buyback authorization following the completion of $4 billion in share repurchases over the 2012-2021 period.
Target Price: Reiterate $750; Rating: Two
Panic Point: $600
RISKS: Industry and economic risk, competition and competitive pressures, and acquisition risk.
Universal Display OLED ; $149.81; 895 shares; 3.27%; Sector: Technology
WEEKLY UPDATE: Following March-quarter data from IDC that showed smartphone industry volumes rose 7.8% year over year to 289.4 million units we added to the portfolio’s position in OLED shares. That action was underscored by March-quarter results from Taiwan Semiconductor (TSM) on Thursday that showed its smartphone business rose 26% year over year, another data point pointing to the normalization of Android smartphone inventories. TSM’s guidance for the current quarter points to another strong showing for smartphones. Based on those learnings, we added further to our OLED position, capitalizing on the stock's move lower during the week. Upcoming earnings from Apple, Samsung, and key suppliers, including Qualcomm, Skyworks, and Qorvo will provide further insight into the smartphone market and the expected AI-on-device upgrade cycle that should benefit our OLED shares. In addition, Apple is expected to release updated iPad models utilizing organic light-emitting diode displays in the coming week, and other PC vendors are slated to do the same in H2 2024. We have room to add further to our OLED position, and plan on doing that opportunistically.
1-Wk. Price Change: -6.1%; Yield: 1.1%
INVESTMENT THESIS: Universal Display focuses on the development and commercialization of organic light-emitting diode (OLED) technologies and materials for use in display and solid-state lighting applications. OLED displays are capturing a growing share of the display market, especially in the mobile phone, television, monitor, wearable, tablet, notebook, personal computer, augmented reality (AR), virtual reality (VR), and automotive markets. This adoption reflects advantages over competing display technologies with respect to power efficiency, contrast ratio, viewing angle, video response time, form factor, and manufacturing cost. Universal's business strategy is to develop new OLED materials and sell existing and new materials to product manufacturers for display applications, such as mobile phones, televisions, monitors, wearables, tablets, portable media devices, notebook computers, personal computers, and automotive applications, and specialty and general lighting products. The company also looks to license its OLED material, device design, and manufacturing technologies to those manufacturers. As such, Universal has a significant portfolio of proprietary OLED technologies and materials with more than 5,500 patents issued and pending worldwide.
Target Price: Reiterate $210; Rating: Two
Panic Point: $140
RISKS: Patent and Intellectual property protection; maintaining OLED manufacturing and customer relationships; technology risk; market risk.
Waste Management WM ; $207.07; 425 shares; 2.16%; Sector: Industrials
WEEKLY UPDATE: WM shares have slipped a bit this month and are flirting with the 50-day moving average near $206. Should they not successfully test that level, the next layer of technical support is near the 100-day moving average, which coincides with a gap on the chart. We are interested in building up our WM position, but we will be mindful of the technicals as we digest the company’s upcoming earnings report on Wednesday, April 25. This week’s March Industrial Production Report confirmed the growing manufacturing economy, a positive for Waste’s non-residential business. Ahead of the company’s earnings report next week, we will be digging into the Flash April PMIs for the U.S. Should they point to a further pick up in manufacturing activity, that would be another positive data point for Waste’s business. Infrastructure spending should continue to help drive that non-residential business while the combination of prudent pricing and the accelerating deployment of automated trucks bodes well for incremental margin gains in the company's residential-facing business.
1-Wk. Price Change: 0.8%; Yield: 1.4%
INVESTMENT THESIS: 2024 will see more nonresidential construction activity because of the Biden Infrastructure Law, but now we can finally factor in activity for the CHIPS Act, which saw its first award this week. Other potential drivers include spending associated with the Inflation Reduction Act, including the much-awaited start of building out a nationwide network of EV charging stations. Recently President Biden announced an $8.2 billion passenger rail project, which will likely take several quarters to come onstream, leading us to think it's more of a 2025 catalyst. Alongside that bright outlook for WM's commercial business, automation efforts and pricing power in its sticky residential business should drive margins and EPS generation higher in the coming quarters.
Target Price: Reiterate $220; Rating: Two
Panic Point: $178
RISKS: Industry and economic risk, competition and competitive pressures, and acquisition risk.
THREES
McDonald's Corp. MCD ; $271.99; 225 shares; 1.50%; Sector: Consumer Cyclical
WEEKLY UPDATE: This week we trimmed back the portfolio’s position in MCD as we downgraded our rating to a Three from Two. Those decisions reflected fresh data that showed slowing sales growth for the company in March and potential market-share losses to a variety of competitors. Tepid guidance from French fry partner Lamb Weston as well as rising beef prices and higher wages for California fast-food workers are additional concerns for the company’s March quarter guidance. Even though MCD shares are flirting with becoming oversold, to us, there is the risk of the stocks moving lower or becoming dead money in the near to medium term. We will look to opportunistically reduce the portfolio’s exposure to MCD in the near term.
1-Wk. Price Change: 1.7%; Yield: 2.5%
INVESTMENT THESIS: The company franchises and operates McDonald's restaurants, which serve a locally relevant menu of quality food and beverages in communities across more than 100 countries. Of the 40,275 McDonald's restaurants at year-end 2022, approximately 95% were franchised. The U.S. market accounts for ~40% of total revenue, International 50%, and International Developmental Licenses Markets & Corporate ~10%. With consumers facing continued inflation pressures, we see McDonald's winning consumer wallet share as it benefits from pricing action put in place in recent quarters and improving input costs.
Target Price: $325; Rating Three
Panic Point: $240
RISKS: Consumer spending, competition, supply chain interruption, franchise business model, employment challenges.
ProShares Short QQQ ETF PSQ; $47.06; 814 shares; 0.94%
WEEKLY UPDATE: While our plan for PSQ has been to exit them when the relative strength index for the Nasdaq returns to more normalized levels below 50, the shares have been a source of market insulation amid recent declines in the Nasdaq. Those declines reflect investors coming around to fewer rate cuts in 2024, potentially very late in the year. Should we get the sense that June-quarter EPS growth expectations are aggressive it would be another reason to own PSQ near-term. We will watch the next level of technical support for the Nasdaq near 15,479. If that support levels hold, it would be another reason to unwind the portfolio’s position in PSQ.
1-Wk. Price Change: 5.8%; Yield: 0.0%
INVESTMENT THESIS: ProShares Short QQQ ETF seeks daily investment results, before fees and expenses, that correspond to the inverse (-1x) of the daily performance of the Nasdaq 100 Index. The Nasdaq 100 Index includes 100 of the largest domestic and international non-financial companies listed on The Nasdaq Stock Market based on market capitalization.
Target Price: N/A
Panic Point: N/A
RISKS: Because PSQ shares track the inverse of the Nasdaq 100 Index, PSQ shares will move lower when the Nasdaq 100 Index moves higher.
ProShares Short S&P500 ETF SH; $12.59; 3,310 shares; 1.02%
WEEKLY UPDATE: While our plan for SH has been to exit them when the relative strength index for the S&P 500 returns to more normalized levels below 50, the shares have been a source of market insulation amid recent declines in the S&P 500. Those declines reflect investors coming around to fewer rate cuts in 2024, potentially very late in the year. Should we get the sense that June-quarter EPS growth expectations for the S&P 500 are aggressive it would be another reason to own SH near-term. We will watch the next level of technical support for the S&P 500 near 4931. If that support levels hold, it would be another reason to unwind the portfolio’s position.
1-Wk. Price Change: 1.7%; Yield: 0.0%
INVESTMENT THESIS: ProShares Short S&P 500 ETF seeks daily investment results, before fees and expenses, that correspond to the inverse (-1x) of the daily performance of the S&P 500. We are using SH shares to blunt market volatility and hedge the portfolio's performance against its benchmark, the S&P 500. Given the tactical nature of this position, we do not expect to hold SH shares for the same length of time as we do the portfolio's long positions.
Target Price: N/A
Panic Point: N/A
RISKS: Because SH shares track the inverse of the S&P 500, SH shares will move lower when the S&P 500 moves higher
