Charting the S&P 500: We Call Your Attention to an Important Change
For the first time since this rally started in early November, a key technical indicator sends a cautious signal.
You've reached your free article limit
You've read 0 of 1 free Pro articles.
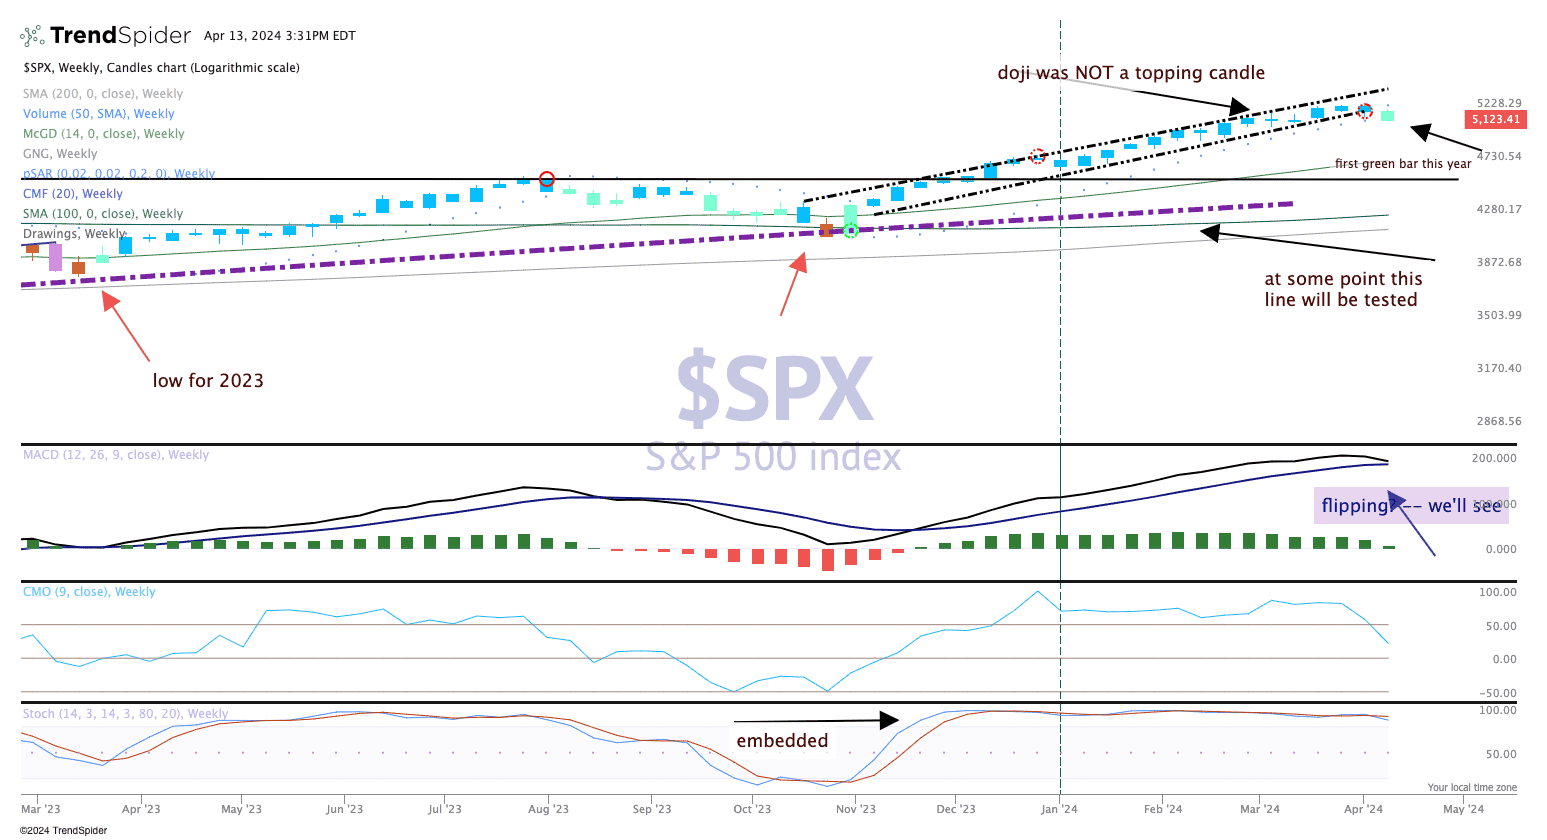
We have fanned out the S&P 500 chart this week to show you an important change in the price action. For the first time since this rally started in early November, the weekly candle changed from blue to teal.
What does it mean? Well, not to panic anyone here, but when you see a shift from full-on bullish to cautiously bullish it should get your attention.
Why did this change all of a sudden? We have had several distribution days in the markets, and that means big institutional selling is responsible for markets going lower. After a five-month rally without a correction, nobody should be surprised when it occurs. The timing is curious, though, as we are up against the start of earnings season, before many of the biggest companies in the world will talk about their quarters and will issue forward guidance.
For a larger view of this chart, click the link below.
View Chart » View in New Window »
The indicators nonetheless have rolled over, and as such there are some downside targets to consider. The first level of support comes in at 5,100, which was nearly tagged during last Friday’s session. The 10-week moving average is right there at 5,110, which also was tested last week. Below we have 5,050, an area of a breakout from earlier in the year. If that level fails to hold then a more ominous setup appears, perhaps a move down to that purple dotted line. There is no bull who would appreciate that move!
Given the time of year and seasonally bearish trends, we are likely to see a bit more downside work before the bulls regain control.
