Which Way Will Lockheed Trade From Here?
Let's go over the charts and indicators.
You've reached your free article limit
You've read 0 of 1 free Pro articles.
Defense contractor Lockheed Martin LMT received a fundamental upgrade at JP Morgan JPM. Let's check out the charts and indicators to see if they're in the bullish camp too.
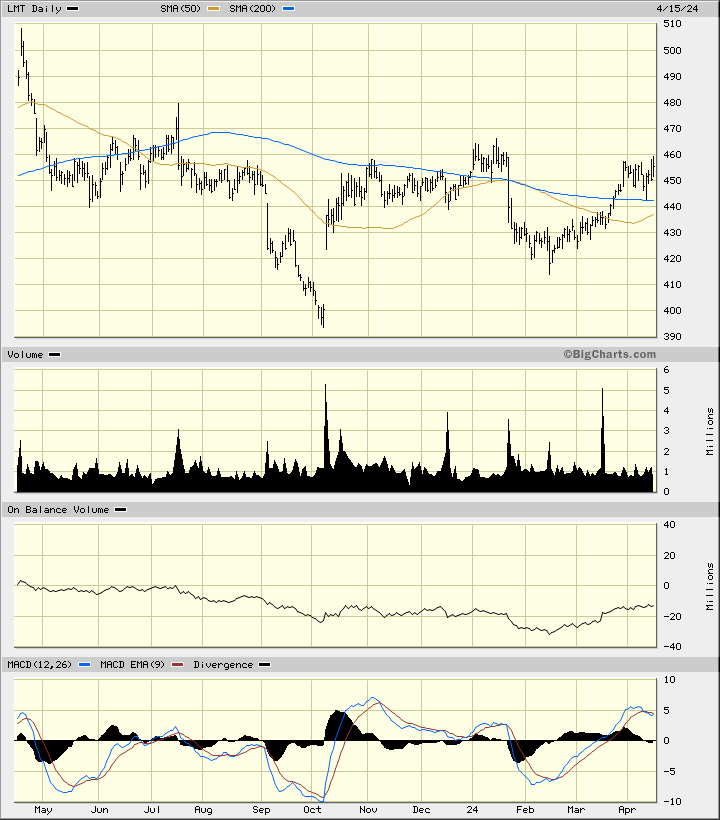
In this daily bar chart of LMT, below, I can see a picture that is trying to turn higher but not all the "pieces" are falling into place. Prices trade above the rising 50-day moving average line and above the 200-day line which still has a negative slope.
The On-Balance-Volume (OBV) line shows some improvement from the middle of February but the longer-term trend is neutral. The Moving Average Convergence Divergence (MACD) oscillator has crossed to the downside for a take profit sell signal.
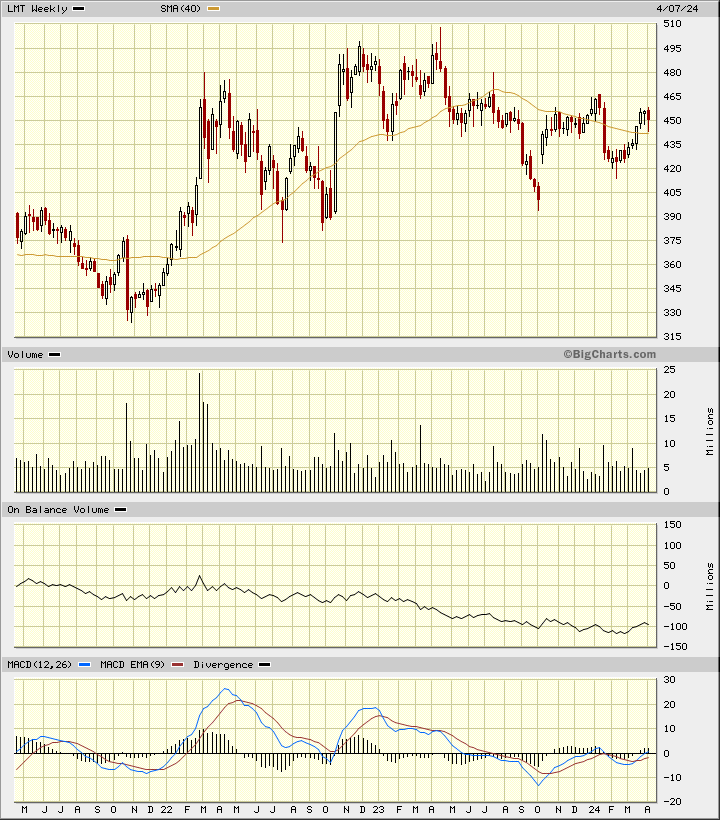
In this weekly Japanese candlestick chart of LMT, below, I can see a longer-term pattern of lower highs going back on this chart. There is a noticeable lower shadow on a candle in February that seems to be marking a low but otherwise I see a weak OBV line and an MACD oscillator that still has not cleared the zero line for an outright buy signal.
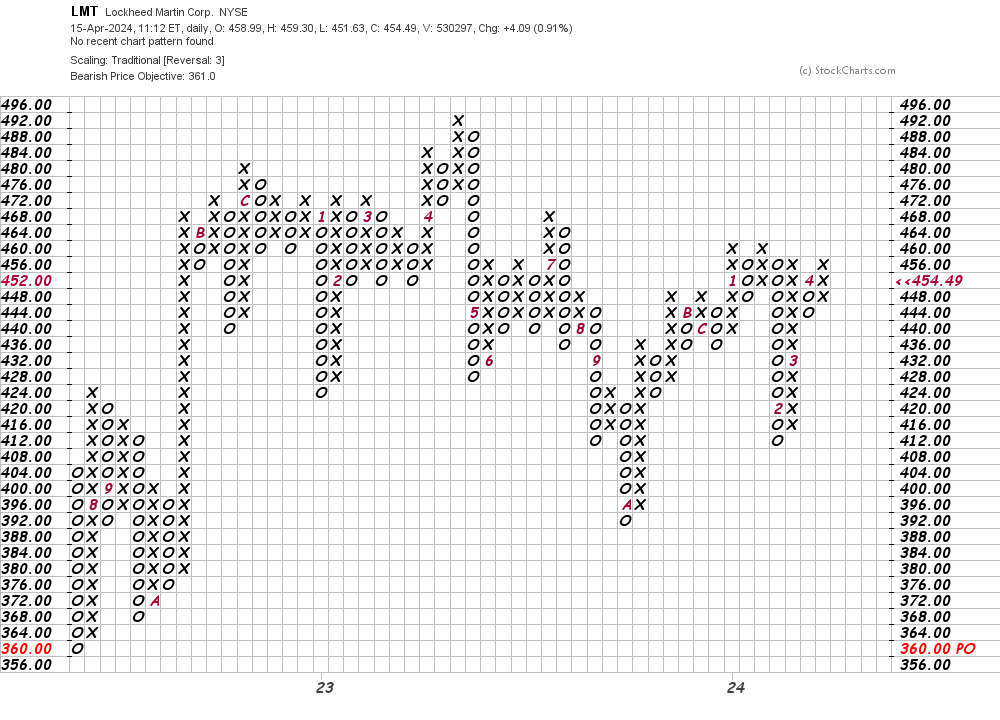
In this daily Point and Figure chart of LMT, below, I can see that the software is calling for or suggesting a possible downside price target in the $361 area.
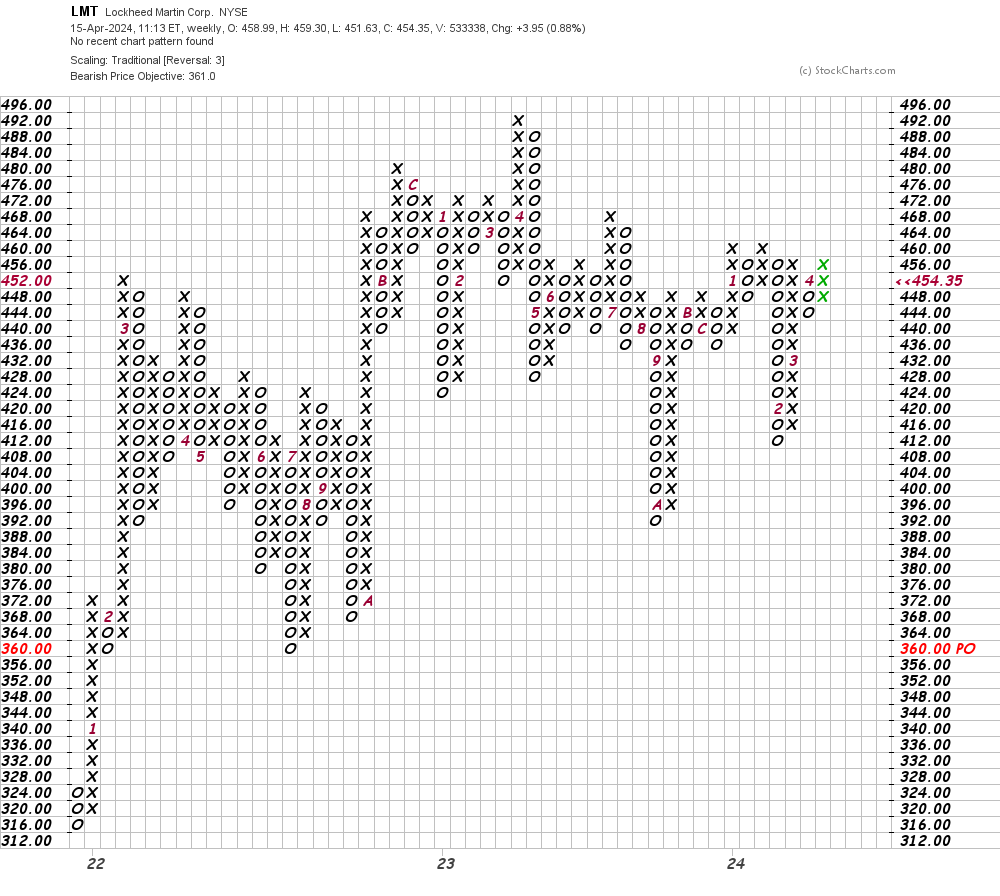
In this weekly Point and Figure chart of LMT, below, I can see the same downside price target of $361 as shown in the daily chart above.
Bottom line strategy: Overall the charts and indicators of LMT are mixed. With the current weakness in the board market averages I would defer purchases of LMT for now.
Employees of TheStreet are prohibited from trading individual securities.