Chart of the Day: A Not So Bullish Qualcomm
Secondary indicators seem to be stacking up on the bearish side of the ledger.
You've reached your free article limit
You've read 0 of 1 free Pro articles.
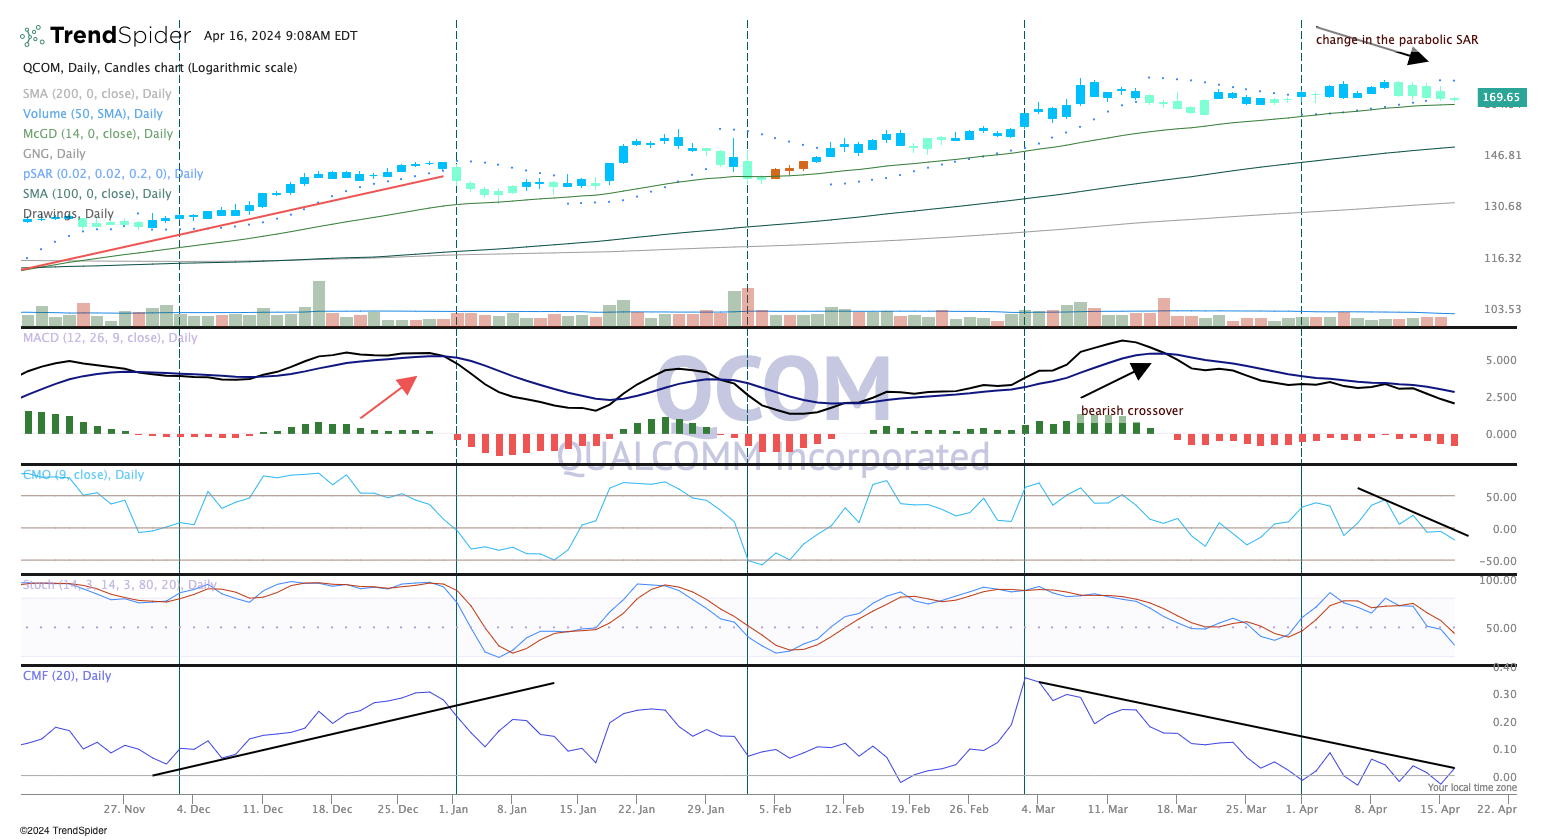
While the price action in Qualcomm QCOM has been pretty darned bullish recently, the indicators are telling us something different.
Price has been solid, notice the blue and teal candles since the end of October (left side of the chart). Only a couple of days with amber (neutral) in February. This tells us the chart has been bullish for some time, but now we notice the indicators have rolled over.
To view this chart in a new window, click here.
These secondary indicators seem to be stacking up on the bearish side of the ledger. A series of these indicators could weigh on the stock eventually, but as we often say, the price action matters most. We'll give QCOM the benefit of the doubt for now and say it is still bullish.
Money flow (bottom pane) is weak and the Chande oscillator (pane three) is slowing down, making lower highs and lower lows.
It is nearly oversold, but shows that relative strength is rather poor. We recently raised the price target on Qualcomm as we continue to see strength in the smartphone market, where the company is well-positioned to gain if demand for phones remains strong.
We rate Qualcomm a two in TheStreet Pro portfolio, which means 'stockpile on pullbacks'.
At the time of publication, TheStreet Pro Portfolio was long QCOM.
