Chart of the Day: United Rentals' Big Move Up Is Over
The indicators are poor and now the price action reflects it.
You've reached your free article limit
You've read 0 of 1 free Pro articles.
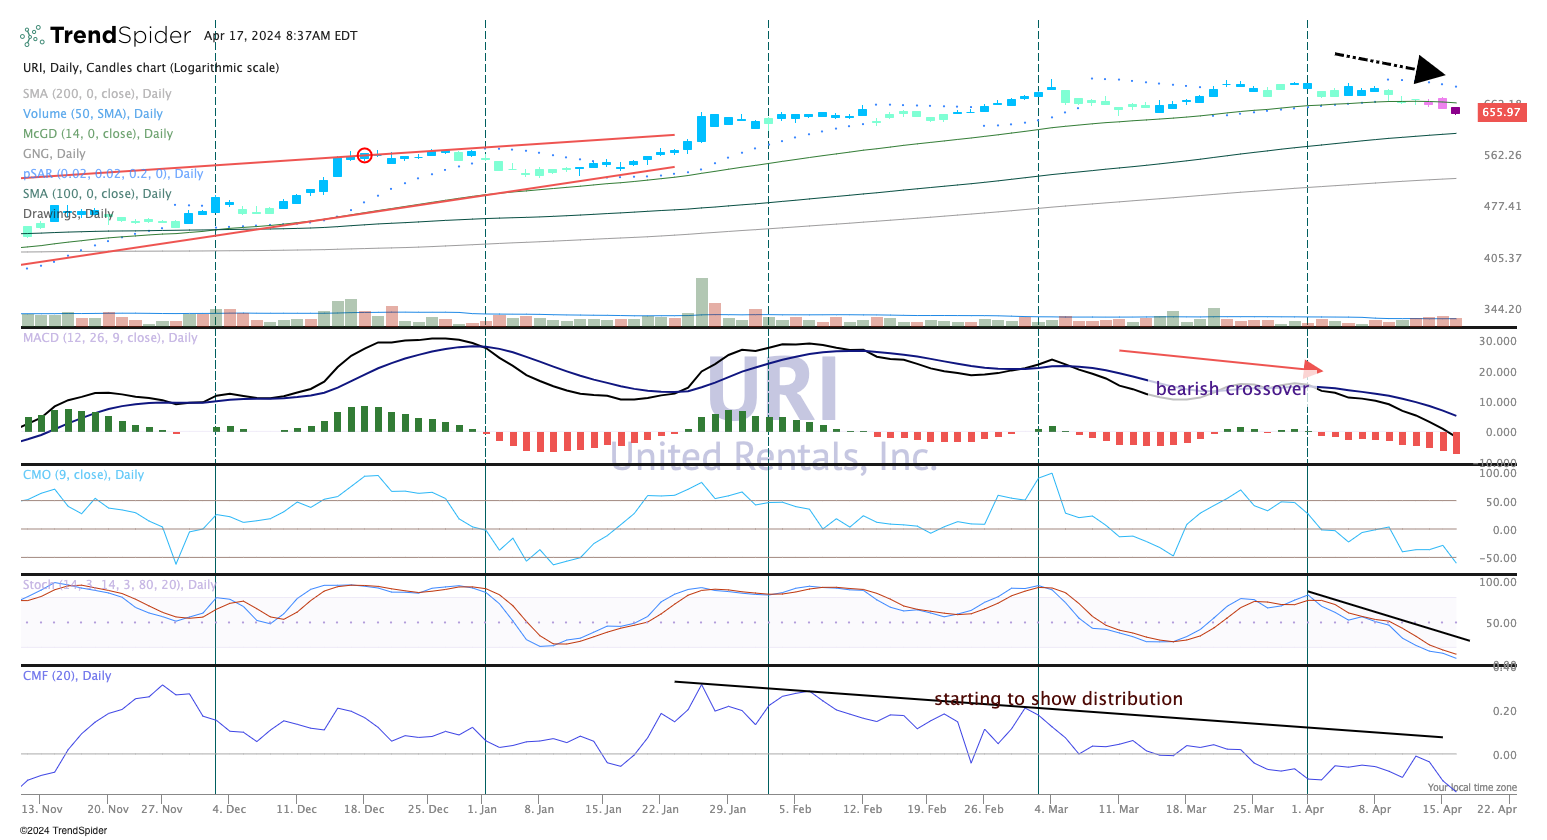
That big move up in January for United Rentals URI was as good as could be, with very strong volume and supporting moves up by the indicators. Eventually the stock went to new all-time highs.
But notice that the follow-on move in price was slow and steady, yet the indicators like the MACD (moving average convergence divergence) and Chaikin money flow (panes 2 and 5) stalled or turned lower. That is what we call a bearish divergence, and one recently occurred again in early March.
These divergences eventually resolve and if there is too much evidence weighted on those indicators then the price action will eventually move with those indicators. In this case, that is lower.
Notice the latest candle shows pink and now purple, which is bearish. We would not be too concerned here though. URI is due to report earnings on April 24 and all signs point to robust business.
To view this chart in a new window, click here.
However, the price action may be telling us that investors and traders are willing to unload the stock before earnings hit, which have been very strong the last couple of quarters.
The Chaikin money flow (pane 5) is showing distribution, the parabolic SAR (stop and reverse) in the top of the chart is showing a bearish sign, which tells us the direction of price before it actually occurs. After a long basing period we could see this stock move down to a better spot to add.
We rate United Rentals a two in TheStreet Pro Portfolio, or 'stockpile on pullbacks'.
At the time of publication, TheStreet Pro Portfolio was long URI.
