Chart of the Day: Nothing Bullish About McDonald's
A sharp drop from all-time highs and weak technicals plagues this fast food giant.
You've reached your free article limit
You've read 0 of 1 free Pro articles.
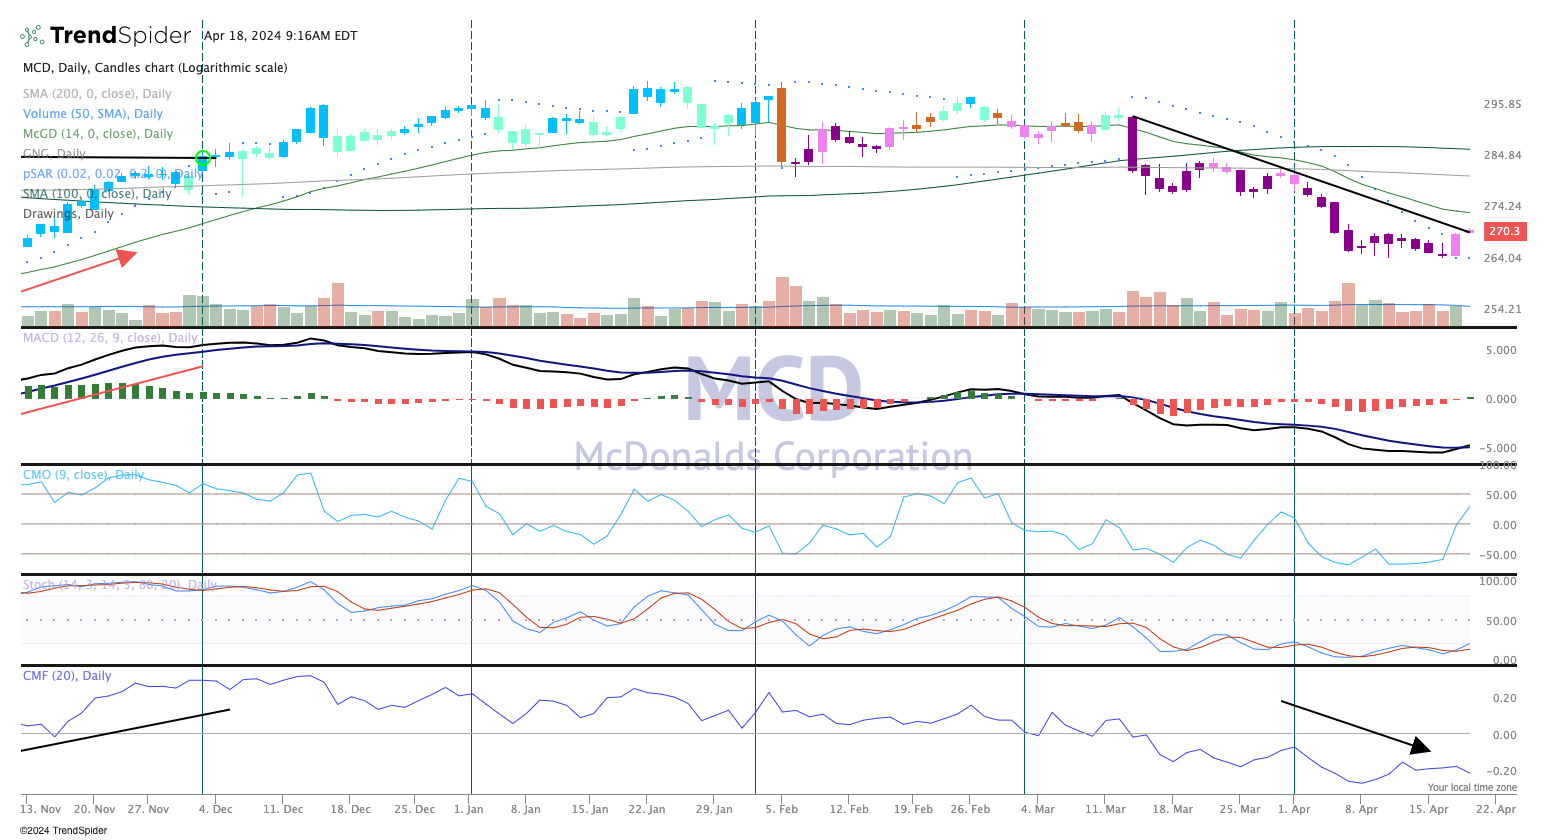
McDonald's MCD chart looks very challenged here, and while it does look very oversold and due for a bounce, the trend is clearly in place.
The downtrend of lower highs, lower lows is textbook. Notice the candles in the top pane are mostly purple for the last month. That signals strongly bearish on the GoNoGo system of several indicators.
We could see a modest rally appear from this level, the $264 area seems firm. But overall the chart is bearish and any rally is likely to be sold. We recently trimmed and downgraded McDonald's after this latest move down.
To open this chart in a new window, click here.
The MACD (moving average convergence divergence) is starting to turn up from a low level, stochastics in pane four shows the same budding move.
With earnings out soon and the challenges in the chart we don't expect to see the stock move substantially higher over the long term. Growth prospects are low in the quarters ahead, and we may hear that repeated on the earnings call.
We rate McDonald's a Three, which means "holding pattern."
At the time of publication TheStreet Pro Portfolio was long MCD.
