Pending Home Sales Sink to Second Straight Record Low
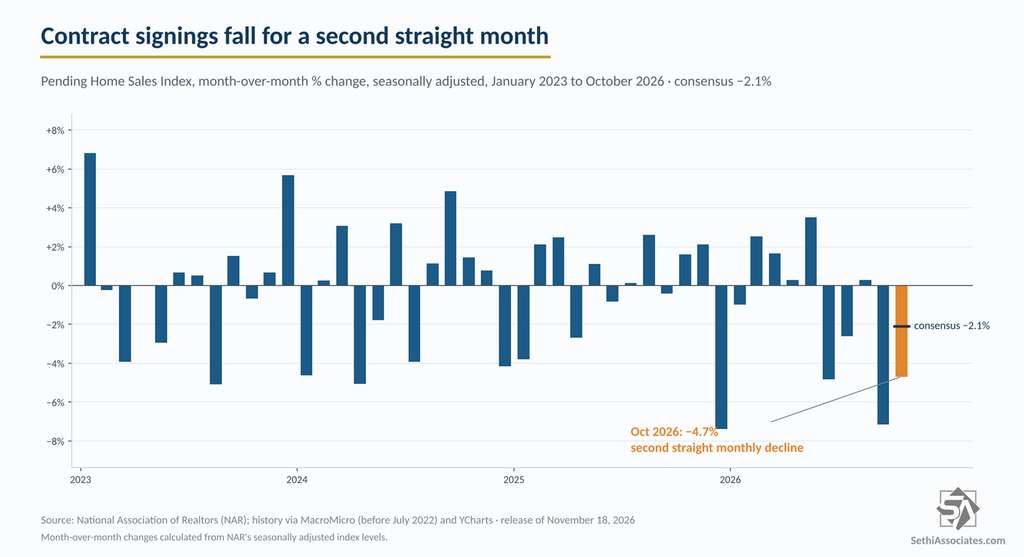
Contract signings for existing homes fell 4.7% in October, more than expected, to a new record low in data back to 2001, down 16.7% from a year earlier.
You've reached your free article limit
You've read 0 of 1 free Pro articles.
U.S. Pending Home Sales October (month-over-month): -4.7% (estimate -2.1%; previous -7.3%; previous revised -7.2%)
– Pending Home Sales, not seasonally adjusted (year-over-year): -17.1% (previous -12.6%)
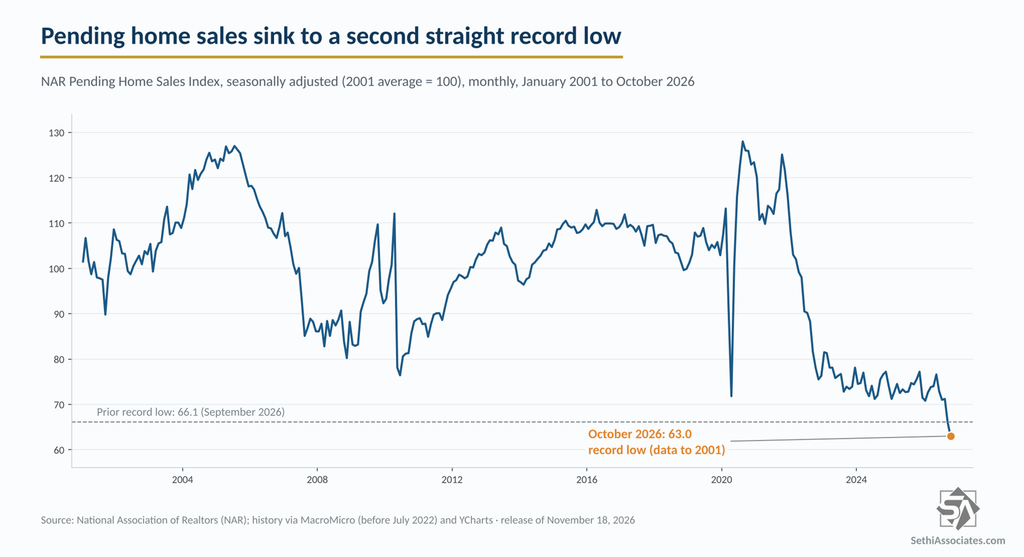
– Pending Home Sales Index: 63.0 (previous 66.0; previous revised 66.1)
Executive Summary
- Pending home sales fell 4.7% in October to 63.0, a second straight record low in data back to 2001, worse than the 2.1% drop expected. The index, where 100 equals average contract activity in 2001, is now 4.7% below September’s prior record.
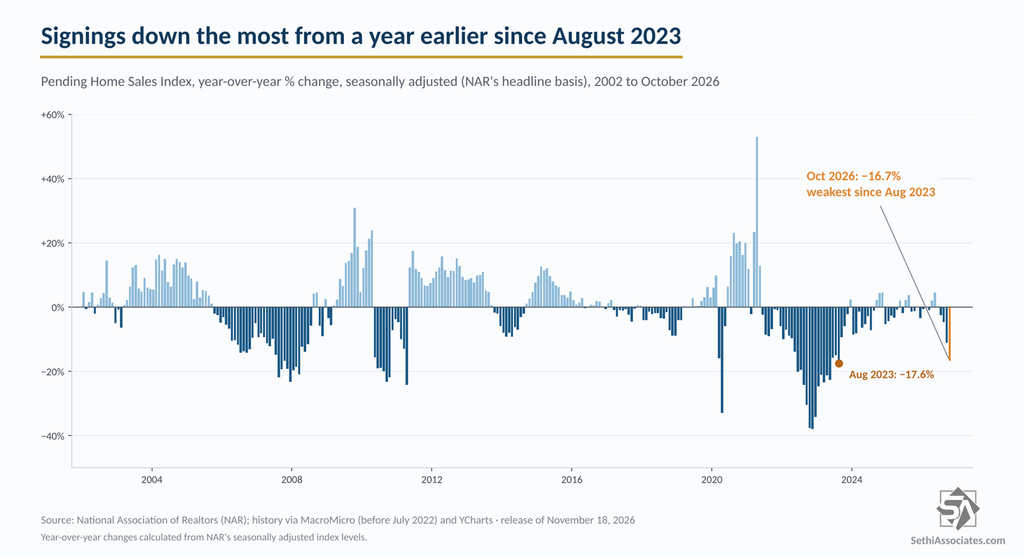
- Contract signings were down 16.7% from a year earlier, the weakest since August 2023 on NAR’s seasonally adjusted basis, and 17.1% before seasonal adjustment.
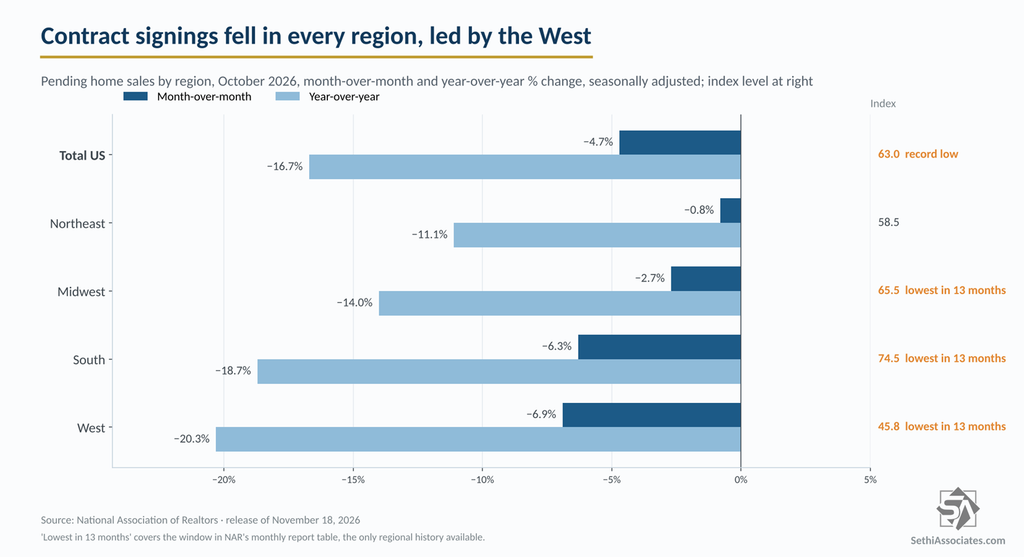
- All four regions fell from September and from a year earlier, led by the West (-6.9% month-over-month, -20.3% year-over-year). The Northeast held up best, slipping just 0.8%.
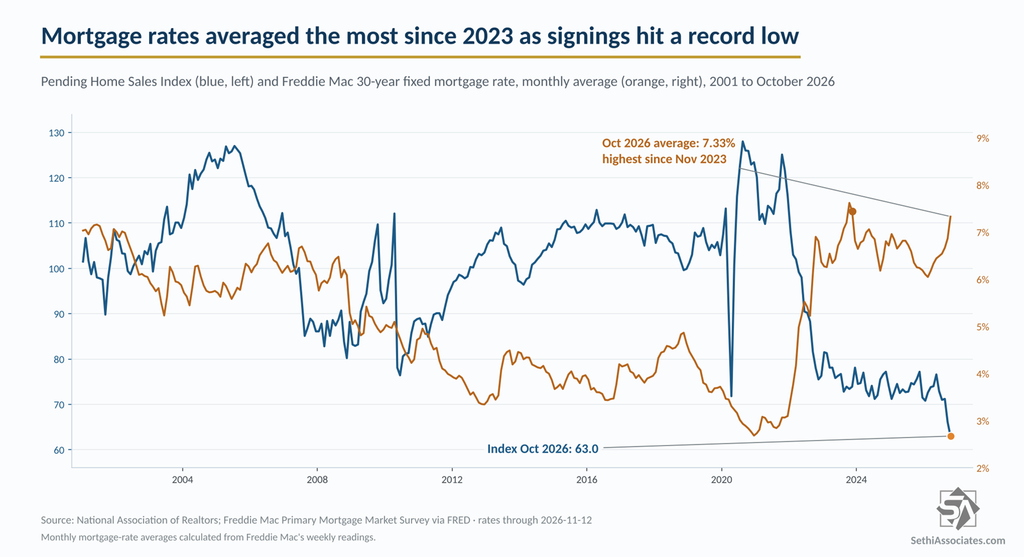
- NAR Chief Economist Lawrence Yun said, “October could mark the low point in contract signings for this housing cycle, as mortgage rates appear to have topped out.” Freddie Mac’s 30-year rate averaged 7.33% in October, the highest since November 2023, but has eased to 7.11% since.
Existing home sales historically represented 90% of home sales in the US but fell to as low as two-thirds post-pandemic due to low supply (which has improved) and home builder incentives for new homes (elevating new home sales). Existing home sales are now back to around 85% (over the past year). Pending home sales are contract signings for existing home sales, not actual transactions, so a little more forward looking. Contract signings usually lead sales by about 45 to 60 days but also can be misleading when contract cancellations are high (as they are currently).
October Contract Signings
Pending home sales fell 4.7% in October, according to the National Association of Realtors, after September’s plunge to a record low. That was worse than the 2.1% decline expected. September’s drop was revised slightly to 7.2% from the 7.3% first reported (index 66.1 from 66.0).
The index fell to 63.0, the lowest in data back to 2001 and 4.7% below September’s prior record of 66.1. Before September, the record low was 70.8 in January. Even the April 2020 pandemic shutdown only took it to about 72.
Versus a Year Ago
Signings were down 16.7% from October 2025, the weakest since August 2023 on NAR’s seasonally adjusted basis, deeper than September’s 11.2% decline. Before seasonal adjustment they fell 17.1%. It’s the fourth straight month below year-ago levels.
By Region
Signings fell in every region. The West dropped 6.9% and was down 20.3% from a year earlier, its index at 45.8. The South, the biggest home-selling region, fell 6.3% (down 18.7% year-over-year) to 74.5. The Midwest fell 2.7% (down 14.0%), and the Northeast slipped 0.8% (down 11.1%).
The Midwest, South and West are all at the lowest in the 13 months of regional data NAR publishes with its monthly report.
Rates and the Outlook
These October contracts were signed as the 30-year fixed mortgage rate averaged 7.33%, the highest monthly average since November 2023 and up from 6.25% a year earlier, according to Freddie Mac. The weekly rate peaked at 7.40% on October 8 and 15 and has since eased to 7.11% as of November 12. Even so, rates “remain more than a percentage point above pre-war levels,” Bloomberg noted.
“Two consecutive months of record-low pending contracts point to very sluggish fourth-quarter home sales closings, and annual existing-home sales could be the lowest since the mid-1990s,” Yun said. “Either sizable housing demand is building in the background, or the dream of homeownership is increasingly out of reach for many Americans.”
Metro Areas
NAR noted that “pending home sales fell year-over-year even in the strongest markets.” The 10 large metro areas with the smallest annual declines, according to Realtor.com Economics data, were:
- 1. Cincinnati, OH-KY-IN (-4.7%)
- 2. Austin–Round Rock–San Marcos, TX (-9.7%)
- 3. Hartford–West Hartford–East Hartford, CT (-10.0%)
- 4. Indianapolis–Carmel–Greenwood, IN (-11.3%)
- 5. Chicago–Naperville–Elgin, IL-IN (-11.9%)
- 6. Pittsburgh, PA (-12.4%)
- 7. Nashville–Davidson–Murfreesboro–Franklin, TN (-12.7%)
- 8. Buffalo–Cheektowaga, NY (-12.7%)
- 9. Jacksonville, FL (-12.8%)
- 10. Cleveland, OH (-12.8%)
What to Watch
Pending sales lead closings by one to two months, so November and December existing-home sales will reflect these two record-low months. October closings already fell to the lowest since 2010, and Bill McBride of CalculatedRisk expects 2026 sales to finish “at the lowest level since 1995,” in line with Yun’s call. Builders are feeling it too, with homebuilder sentiment at the lowest since April 2012.
The test of Yun’s “low point” call is rates. The weekly 30-year rate has come down from 7.40% to 7.11%, but the October average was still the highest in nearly three years, and mortgage rates are back on the rise. The Mortgage Bankers Association says their survey (which is of actual closed loans vs. Freddie Mac’s survey of offered rates) climbed 14 basis points to 7.35% in the week ended November 13 Bloomberg reports.
November’s pending sales, due in December, will show whether the dip was enough to bring buyers back.