What to Watch as Housing Starts Jump, but Total Permits Sink
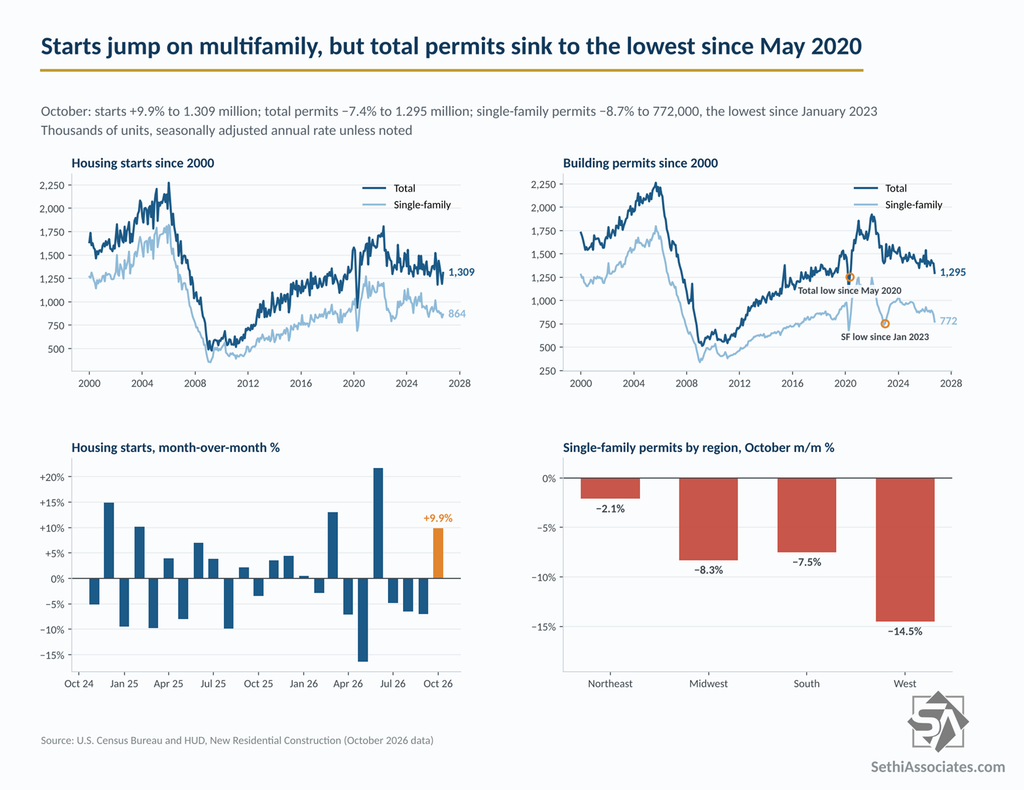
Starts came in well above estimates on a 25.5% rise in multifamily, but total building permits, a leading indicator, fell to the lowest since May 2020, with single-family permits dropping the most since February 2021.
You've reached your free article limit
You've read 0 of 1 free Pro articles.
- U.S. Housing Starts October: 1.309 million (estimate 1.250 million; previous 1.221 million; revised 1.191 million)
- Housing Starts (M/M): +9.9% (estimate +2.4%; previous -5.2%; revised -7.0%)
- U.S. Building Permits October: 1.295 million (estimate 1.377 million; previous 1.400 million; revised 1.398 million)
- Building Permits (M/M): -7.4% (estimate -1.5%; previous -0.2%; revised -0.4%)
Executive Summary
- Housing starts jumped 9.9% in October to 1.309 million, the biggest gain since June, well above the 1.250 million consensus, though September was revised down to 1.191 million. Multifamily starts surged 25.5% to 433,000, while single-family rose 4.0% to 864,000.
- Total building permits fell 7.4% to 1.295 million, the lowest since May 2020, well below consensus for 1.377 million. Single-family permits fell 8.7%, the most since February 2021, to 772,000, the lowest since January 2023, and were down in all four regions.
- Completions rose 6.5% to 1.272 million, the biggest gain since January 2025, while units under construction edged down to 1.272 million.
This post will go through housing starts, then permits, then completions and finally units under construction. All figures are month-over-month and seasonally adjusted annual rates unless noted. Single-family refers to one-unit buildings and multifamily to buildings with five or more units. Note this report is subject to significant revision — the 90% confidence interval for housing starts month-over-month, for example, is ±16.8%.
For reference, the Freddie Mac 30-year fixed mortgage rate averaged 7.33% in October, the highest monthly average since November 2023, up from 6.86% in September. The weekly reading peaked at 7.40% on October 8 and October 15, also the highest since November 2023, before easing to 7.11% by November 12.
Starts
Housing starts rose 9.9% to a 1.309 million annual pace, the biggest gain since June, beating the 1.250 million consensus in my Day Ahead. The jump came off a lower base, though: September was revised down to 1.191 million from 1.221 million, making its decline about 7% rather than the 5.2% first reported.
Multifamily did most of the work, up 25.5%, the most since June, to 433,000. Single-family starts rose 4.0% to 864,000 after September was revised down to 831,000, the lowest since March 2023. October’s single-family pace is roughly in line with the third-quarter average of 863,000.
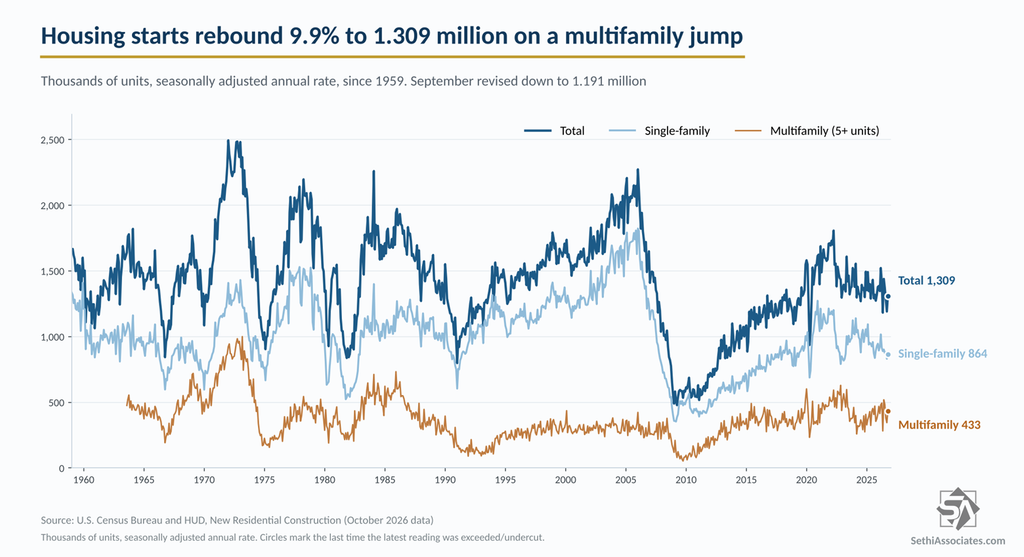
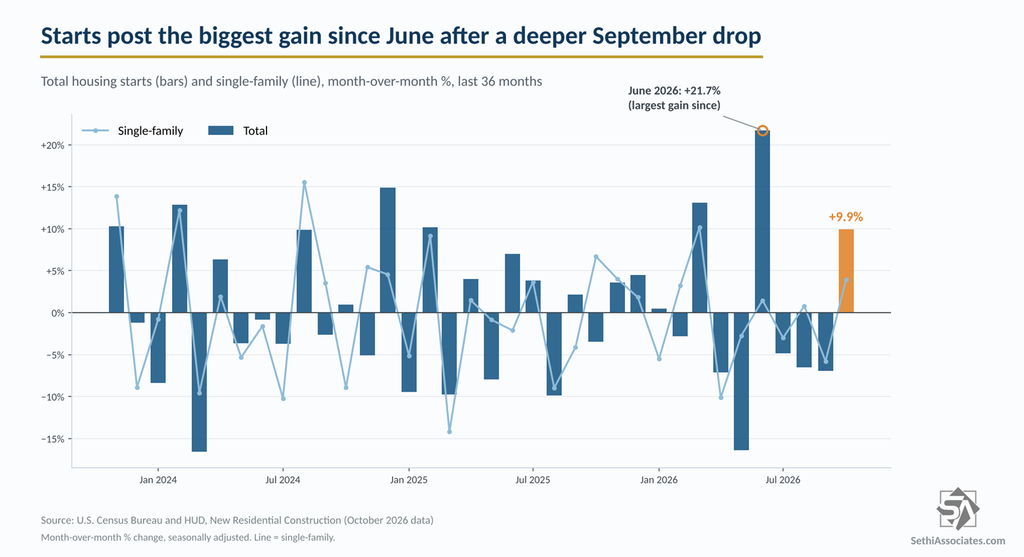
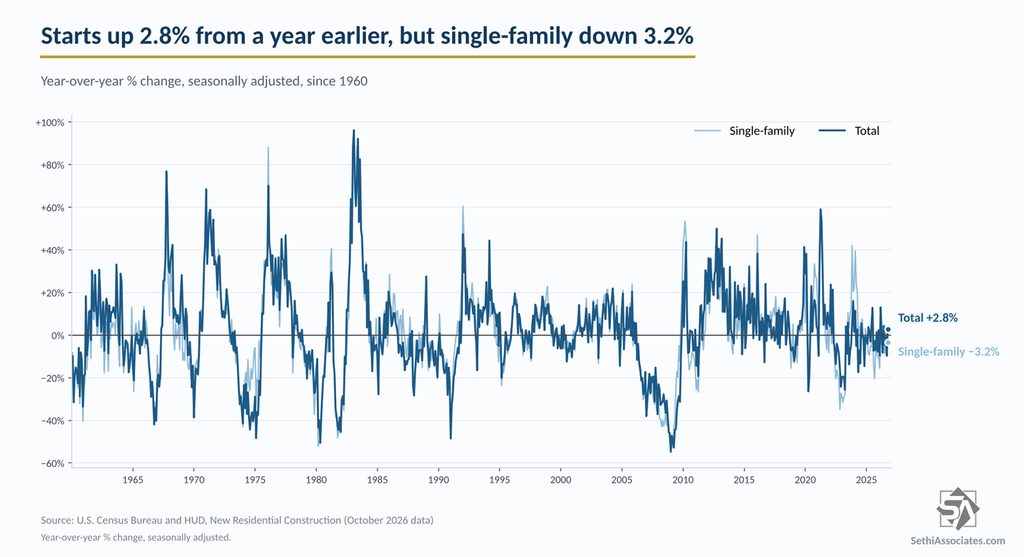
Starts are up 2.8% year-over-year, with multifamily up 22.0% but single-family down 3.2%. Through the first 10 months, starts are down 1.1% from the same period of 2025 (not seasonally adjusted), with single-family down 4.6%. Per the Census Bureau, neither the monthly nor the annual change was statistically significant: the release reads “9.9 percent (±16.8 percent)* above” September, where the asterisk means the range includes zero.
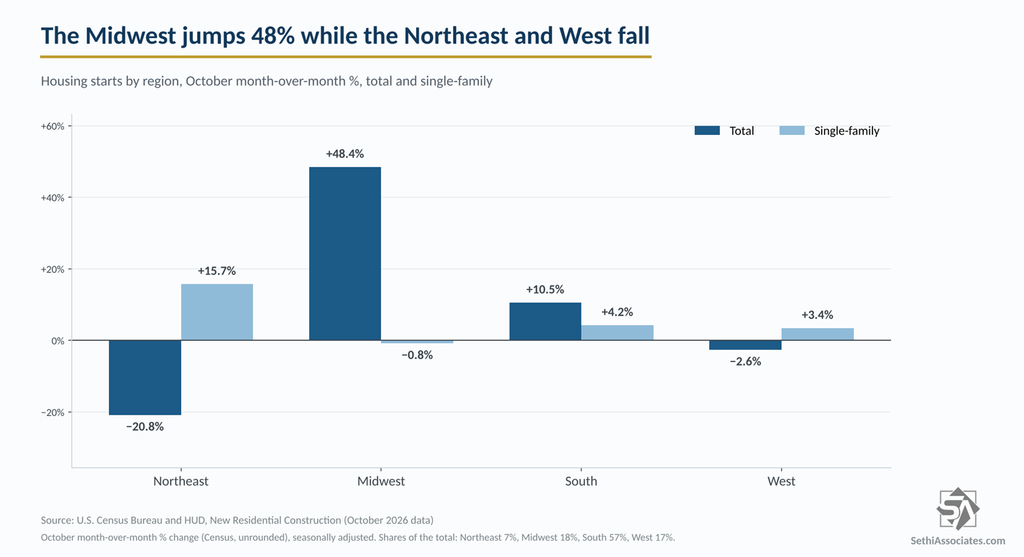
Regionally, the Midwest jumped 48.4%, the most since March 2025, and the South, about 57% of all starts, rose 10.5% (single-family +4.2%) to 747,000, the strongest since April. The Northeast fell 20.8% to 95,000, the lowest since January 2025, and the West slipped 2.6% to 228,000, the lowest since April 2020.
Permits
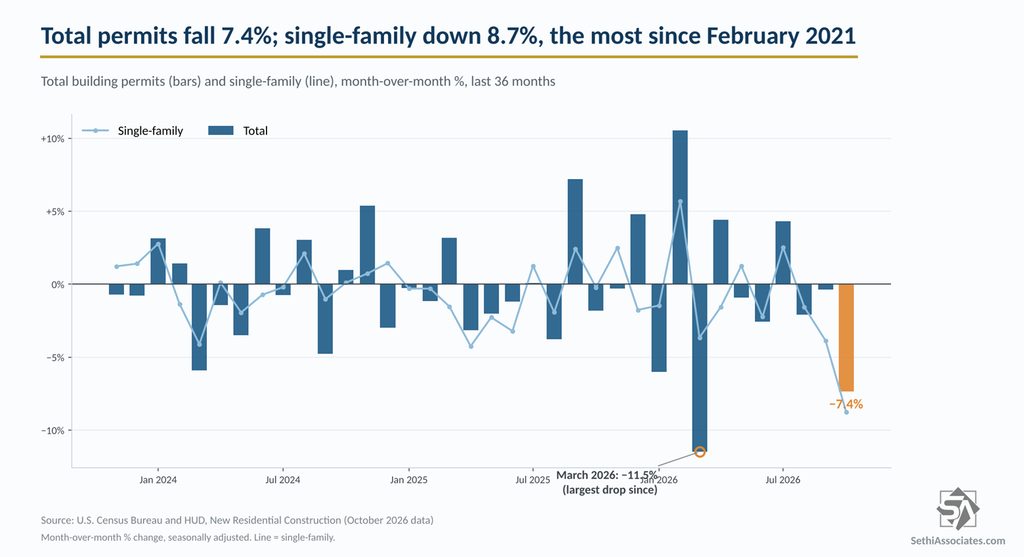
Total building permits, which lead starts, fell 7.4%, the most since March, to a 1.295 million annual pace, the lowest since May 2020. That was below the 1.377 million consensus in my Day Ahead. September was revised to 1.398 million from 1.400 million.
Single-family permits fell 8.7%, the most since February 2021, to 772,000, the lowest since January 2023, a third straight decline. The three-month average is the lowest since March 2023. Multifamily permits fell 5.2% to 475,000.
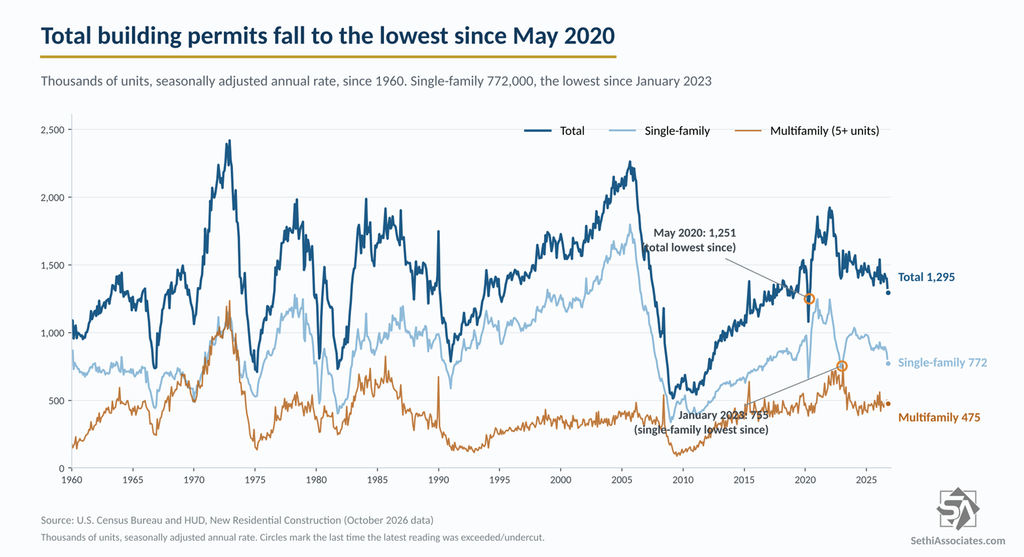
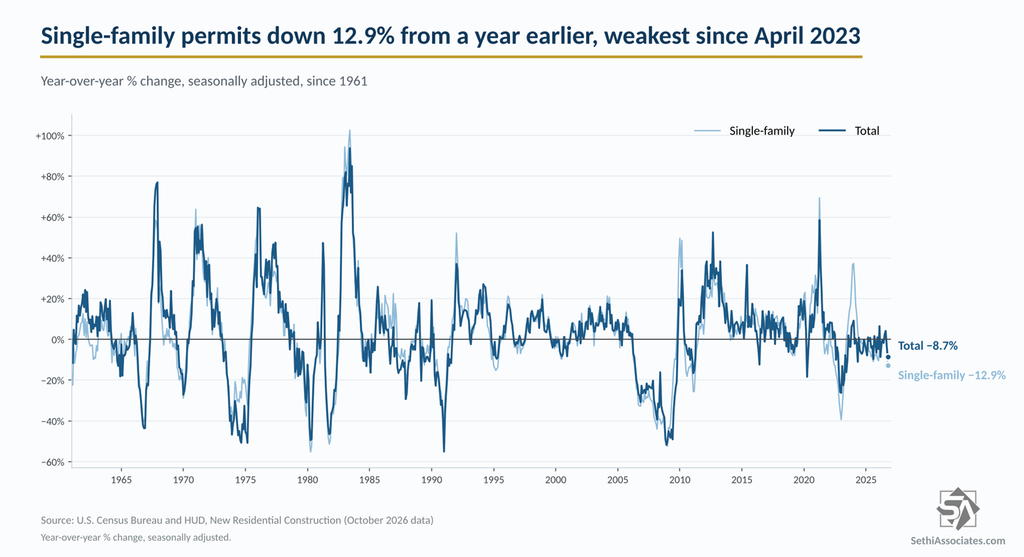
Total permits are down 8.7% year-over-year, with single-family down 12.9%, the weakest since April 2023. Through 10 months, total permits are down 1.9% from 2025, with single-family down 4.2%.
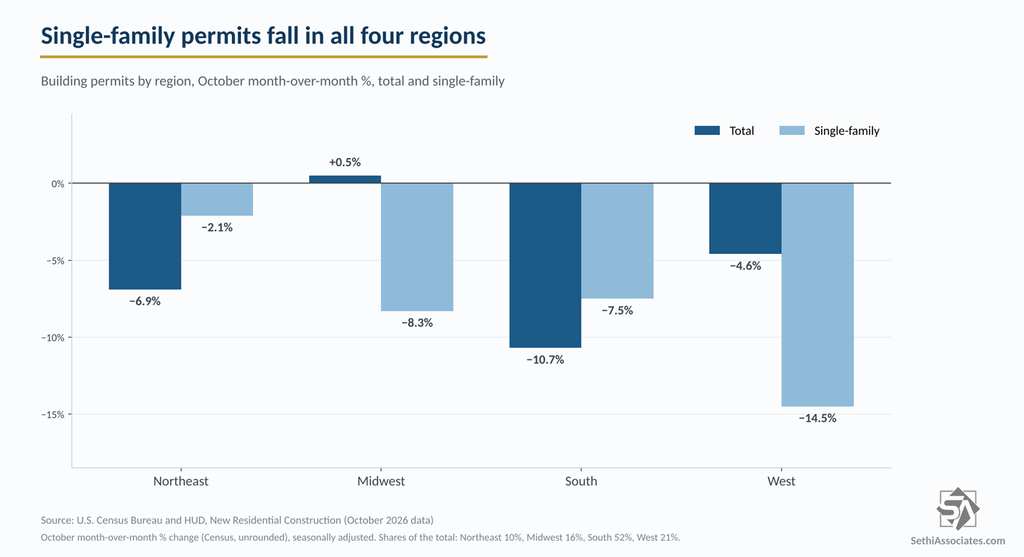
Single-family permits fell in all four regions. The West fell 14.5%, the most since April 2020, and the South, about 60% of single-family permits, fell 7.5%, the most since February 2021, to 466,000, the lowest since January 2023. Total permits in the South fell 10.7%, the most since March 2023, to 675,000, the lowest since April 2020.
Completions
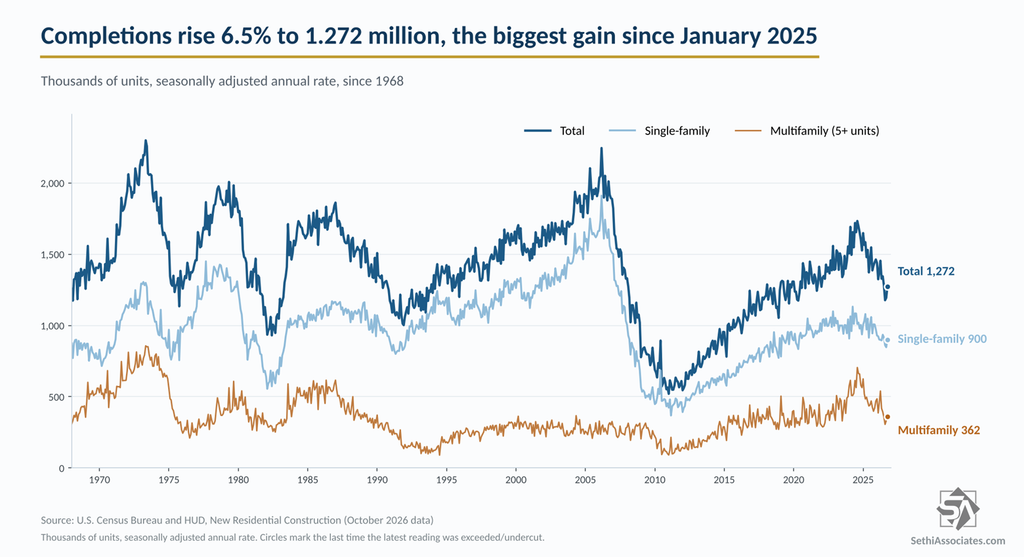
In terms of new supply coming online, completions rose 6.5%, the biggest gain since January 2025, to a 1.272 million annual pace, after September was revised up to 1.194 million. Single-family completions rose 6.3% to 900,000 and multifamily 9.0% to 362,000.
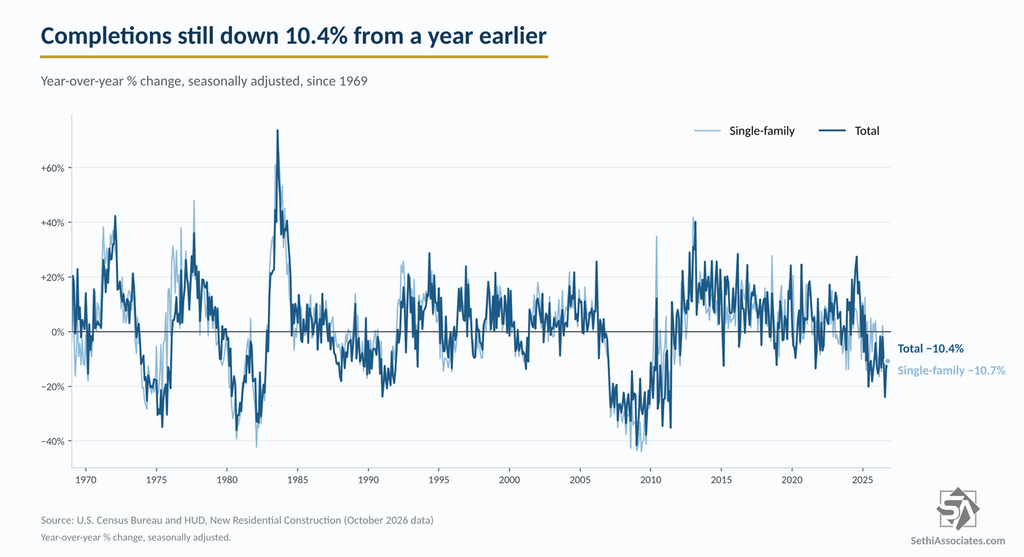
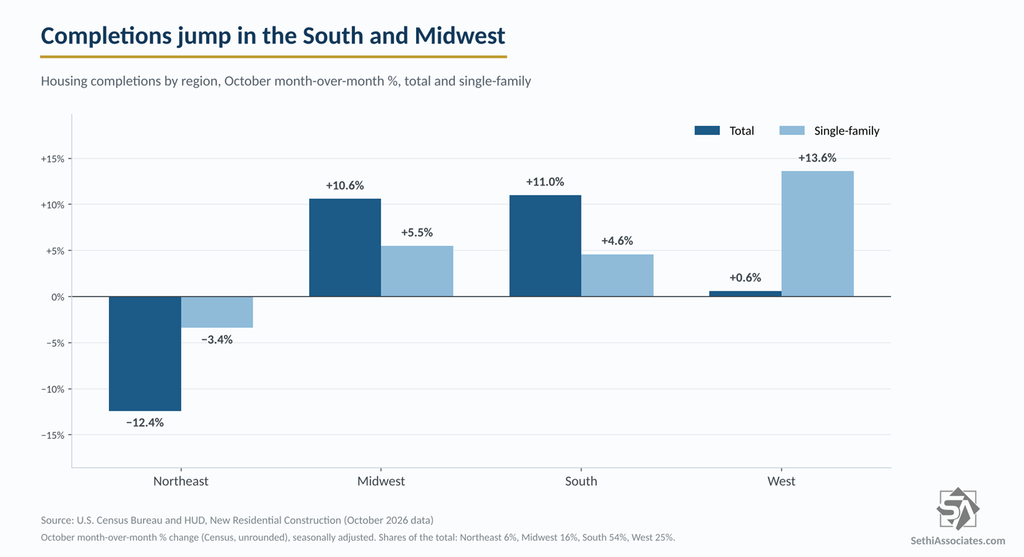
Completions are still down 10.4% year-over-year (though not statistically significant per the Census Bureau), with single-family down 10.7% and multifamily down 9.0%. Regionally, the South rose 11.0% and the Midwest 10.6%, while the Northeast fell 12.4%.
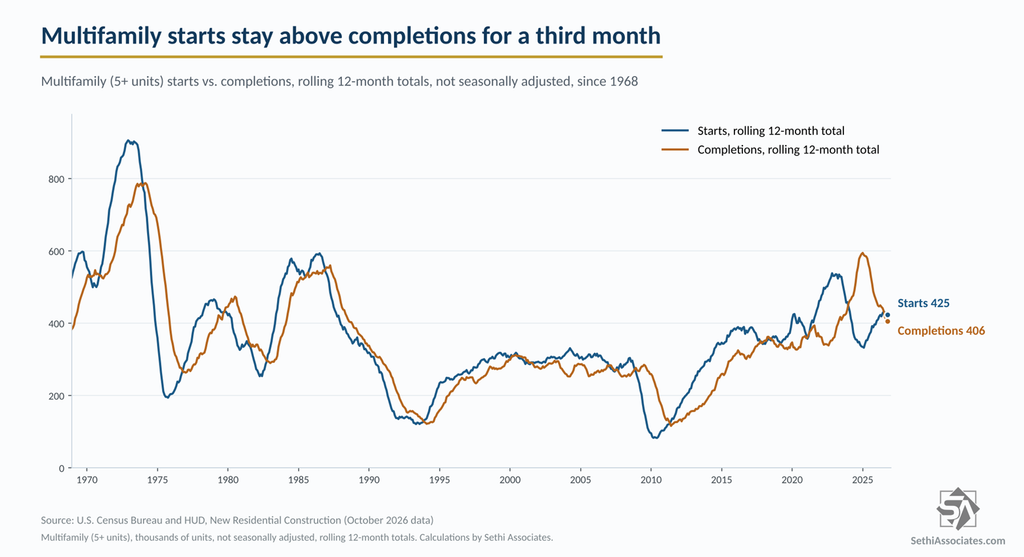
On a rolling 12-month basis (not seasonally adjusted), multifamily starts (424,700) have now run above multifamily completions (406,200) for a third month, after completions ran well ahead through 2024 and 2025, meaning we’re probably past most of the drop in completions.
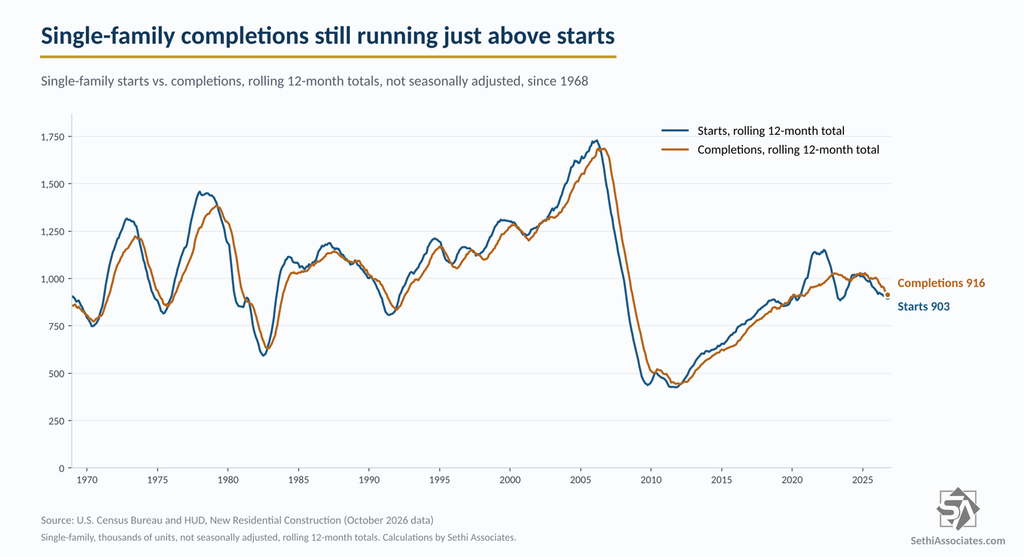
Single-family completions (916,500) remain slightly above starts (903,000), as they have since July 2024, with the gap the narrowest since July 2025.
Under Construction
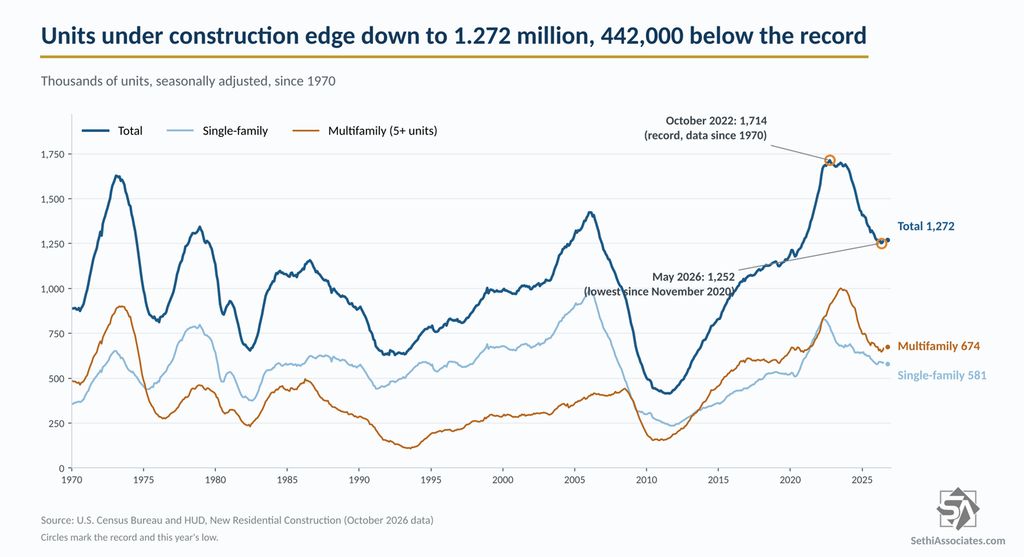
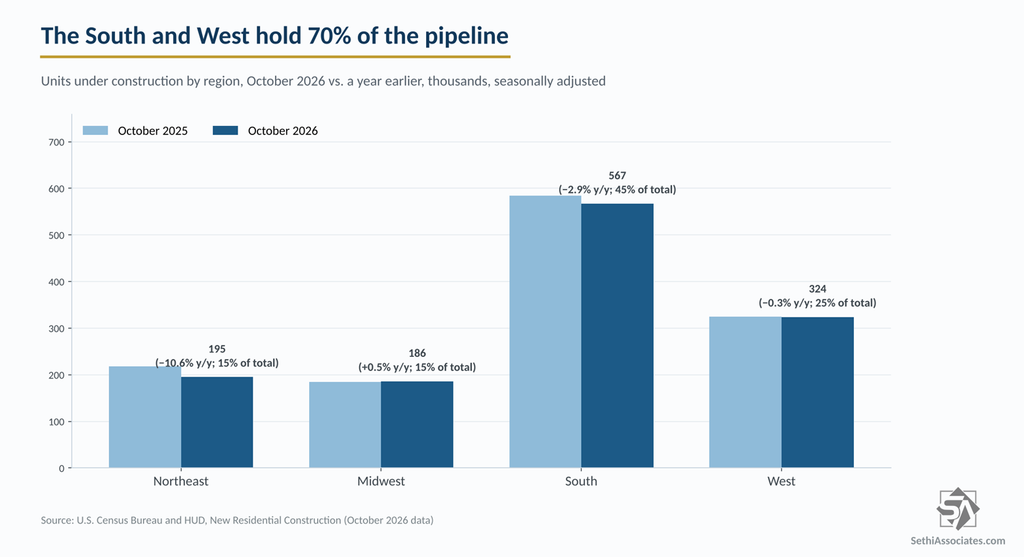
Looking at what’s “in the pipeline,” units under construction edged down to 1.272 million, down 3.0% year-over-year and 442,000 below the October 2022 record of 1.714 million, but above May’s 1.252 million, which was the lowest since November 2020. Single-family slipped to 581,000, the lowest since February, and multifamily held at 674,000, 327,000 below its July 2023 record of 1,001,000.
As Bill McBride of Calculated Risk notes, in the three years before the pandemic there were about 1.1 million to 1.2 million units under construction, “so the current level is still a little elevated.”
The South (44.6%) and West (25.5%) hold the bulk of the pipeline.
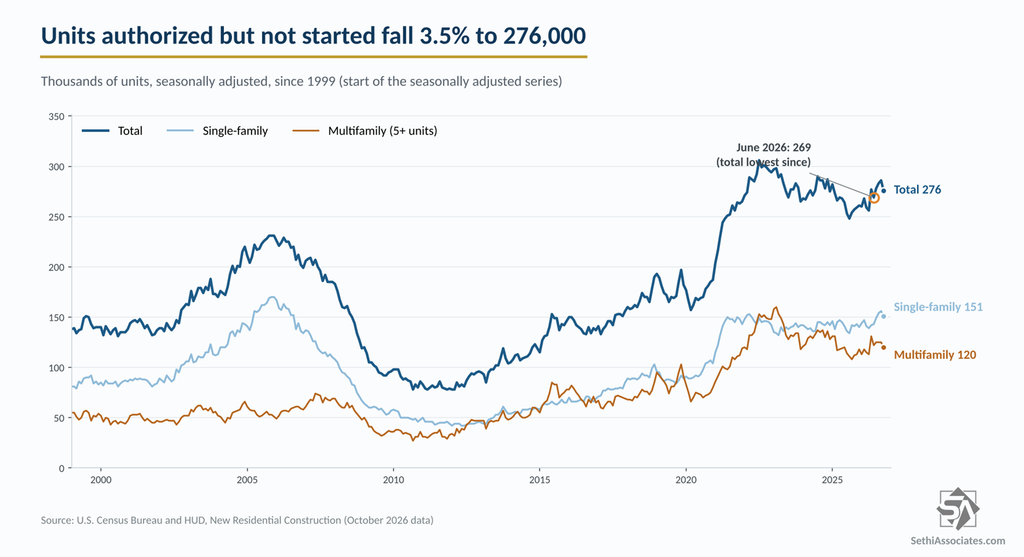
Further back in the pipeline, units authorized but not yet started fell 3.5% to 276,000, still up 7.4% year-over-year as builders hold off given the weak conditions discussed in 3 Things to Watch as Homebuilder Sentiment Sinks to Lowest Since April 2012.
Analyst Reaction
Bill McBride of Calculated Risk noted that starts “were above expectations, however starts for the previous two months were revised down,” calling it “another generally weak report boosted by the volatile multifamily sector.”
Goldman Sachs noted starts “have been particularly volatile this year, with starts increasing or declining by an average of 11.1% month-over-month over the past six months,” and said “the weakness in new permits signals future downside for homebuilding which is in line with our expectations that higher interest rates will weigh further on single-family starts over the next year.” They left their fourth-quarter GDP tracking unchanged at +2.4%.
Bloomberg noted that home construction has weighed on GDP in six of the past seven quarters, and that before today’s report the Atlanta Fed’s GDPNow showed residential investment may again subtract from fourth-quarter growth (it is currently showing -0.12% contribution). It also pointed out that Fannie Mae sees housing starts “barely improving through at least the end of 2028,” while builders are adjusting: PulteGroup (PHM) has been cutting its share of spec homes, and D.R. Horton (DHI) is building more smaller homes, including duplexes and townhomes.
ZeroHedge, under the headline “‘Renter Nation’ Juices Starts”, pointed to the gap between “current mortgage rates (above 7%) and the average mortgage across all of American homeowners (4.36%)” as “extreme to say the least, trapping sellers and buyers,” concluding that “it appears builders aren’t willing to throw good money after bad until the mortgage-rate gap narrows further.”
What to Watch
Single-family permits point to softer starts ahead. They have now fallen three straight months to the lowest since January 2023, leaving single-family starts running 12% above permits. Since 1990, when single-family starts ran 10% or more above permits, starts averaged lower over the following three months 74% of the time (median -4.1%), versus 43% of the time otherwise. That comes as builder sentiment fell to 25 in November, the lowest since April 2012, per my NAHB write-up, and existing home sales are at their lowest since 2010. The November report is due December 17.
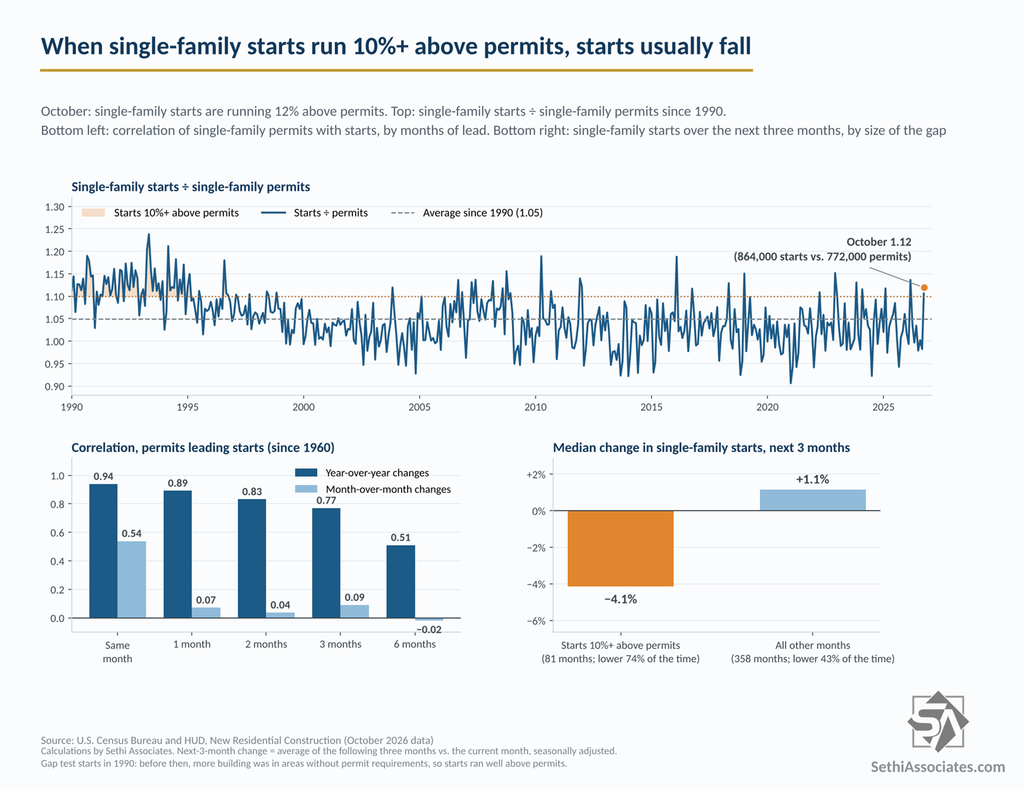
Charts are built from Census Bureau data. Source: Census Bureau, New Residential Construction; historical data.