AI Selloff Gains Steam but Solid Market Action Beneath the Surface
Worries about the sustainability of the AI trade surfaced once again, driving down a swath of related stocks, but other stocks rallied leading to the most bifurcated day since July as Treasury yields dropped the most since August 2025.
You've reached your free article limit
You've read 0 of 1 free Pro articles.
Quick Summary
- AI stocks sold off again as Meta Platforms’ higher spending plans, a disappointing report from chipmaker Lam Research and comments from Nvidia CEO Jensen Huang on scarce capital renewed worries about financing the AI buildout, sending the Nasdaq to its worst day since June. Investors plowed into other areas led by defensive sectors and Treasuries with Staples and Health Care hitting all-time highs.
- The Nasdaq fell 2.6%, and the S&P 500 dropped 1.2%, its worst day since July. The Dow Jones Industrial Average in contrast finished flat, the Russell 2000 edged up 0.1% and the equal-weight S&P 500 rose 0.8%.
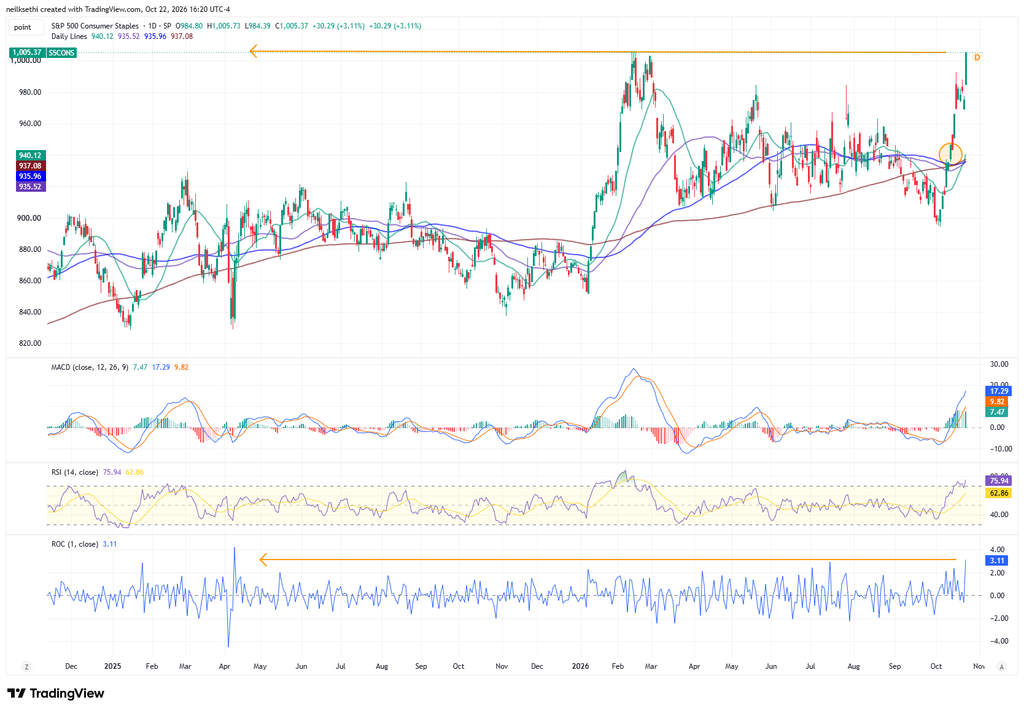
- It was the most bifurcated market action since July, with five sectors up over 0.9% and four down that much. Tech and Communications each fell about 3%, and Consumer Discretionary lost 1.7%. But Staples jumped 3.1%, its best day since April 2025, led by a 5.6% gain in Procter & Gamble (PG) after its results. Utilities, Health Care, and Financials also rose more than 1%, with Health Care hitting a record despite a 17.6% plunge in Moderna (MRNA).
- Meta Platforms (META) sank 7% despite beating revenue estimates, as investors focused on its rising AI costs. Tesla (TSLA) dropped 3% after cutting its capital spending outlook. The PHLX Semiconductor Index (SOX) dropped 6.7%, with Lam Research (LRCX) down nearly 12% on supply-constrained guidance. CoreWeave (CRWV) fell 10% after Huang told CNBC that demand for neoclouds is “off the charts,” but capital is scarce, comments Wells Fargo traders said spooked markets. AI power-infrastructure names sold off too, with GE Vernova (GEV) down more than 10%.
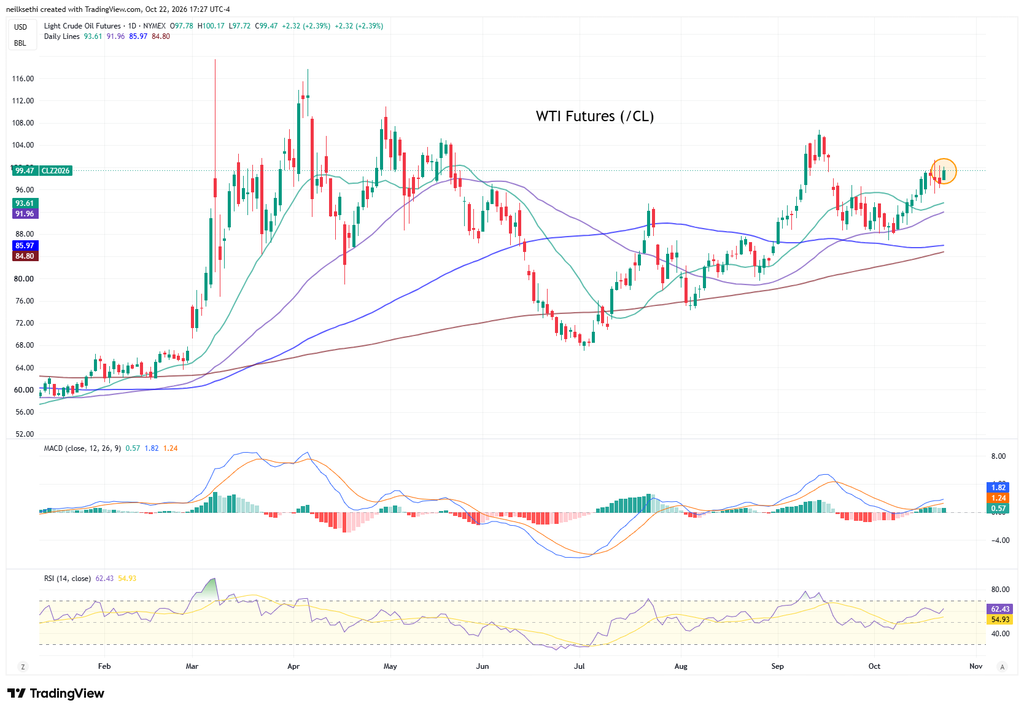
- Treasuries rallied sharply on haven demand. In the cash session, the 10-year yield fell 19bp to 4.95%, the largest drop since August 2025 and closing below 5% for the first time since September 22, while the 2-year dropped 17bp to 4.65% as Fed rate hike bets fell. Money markets cut the odds a Fed hike in October to just 7%, per CME Fedwatch and removed over half a hike from December 2027 pricing. That was even as Brent jumped 4% to above $113 and WTI rose 2.4% to about $99.50 after The New York Times reported the U.S. and Israel plan renewed strikes on Iran after the midterms.
- In data, initial jobless claims fell to 194,000, the least since July. Friday brings S&P Global’s flash October PMIs, final University of Michigan consumer sentiment and earnings from American Express (AXP).

Market Commentary
Equities:
- “The dominant market dynamic in recent weeks has been the unwinding of AI-related positions by hedge funds,” Roberto Scholtes at Singular Bank said. “I expect this trend to persist for a while, unless we see a substantial decline in bond yields triggered by a short squeeze, or major geopolitical developments.”
- “The message seems increasingly clear: the market is still willing to reward heavy AI investment, but is becoming much more demanding about returns,” said Santiago Mateo, head of equity at CaixaBank AM. “Investors want evidence that investment is translating into stronger growth, better monetization and ultimately earnings.”
- JPMorgan traders said in a note to clients “underlying price actions and feedback from our trading desk also suggested the still fragile narrative around AI financing concerns and the lack of conviction/re-grossing from the recent tech reversal.”
- “People are running away from tech,” Mark Hackett, chief market strategist for Nationwide said in a phone interview with MarketWatch. There’s “a very different tone” in the market Thursday with respect to how investors are treating AI spending in the wake of Meta Platforms’ third-quarter earnings report, he said.
- “When you think about a bubble, you think about building capacity and then hoping the demand comes,” Blackstone Inc. President Jon Gray told Bloomberg Television after the firm reported its third-quarter results. “With AI, you’re building capacity, and you’re hoping you can keep up with the demand.”
- “Seldom in my career have I seen such a supply-constrained market of this scale. Current public attitudes towards data centers will likely only amplify this scarcity.” —Blackstone CEO Stephen Schwarzman
- “The demand of the capital is much greater than the availability of the capital,” Nvidia CEO Jensen Huang said in an interview with CNBC at Nvidia’s GPU Technology Conference. “That’s going to get solved, and that’s going to get solved because fundamentally, the most important things are the values that these guys are providing, these companies are providing.”
Bonds:
- “Treasuries rallied overnight as tech stocks came under pressure amid renewed AI valuation fears,” Ian Lyngen, head of U.S. rates strategy at BMO, said in a note Thursday. “The rebound in energy prices contributed to the risk-off tone as escalating hostilities in the Middle East” pushed West Texas Intermediate Crude Oil higher, he said.
Stock and Sector Breakdown:
A very bifurcated sector chart with five sectors up over 0.9% and four down that much, with Tech again seeing a flip between the extremes, the fifth such session, this time to the bottom, ending down 3%. With its ~40% market cap weighting in the SPX, along with another ~11% in Communications, which was also down 3%, those losses more than offset the positive sectors which included Staples ending up 3.1%, its best session since April 2025, at a record high.
Health Care also hit a record high despite a 17.6% drop in Moderna (MRNA) discussed below. The Wall Street Journal credited the jump in the sector in part to a top adviser to Health Secretary Robert F. Kennedy Jr. quitting the Trump administration. Calley Means “has been an outspoken critic of the food industry and championed efforts during President Trump’s second term to remake the food system, including a push to set a federal definition for ultraprocessed foods and to persuade food companies to ditch artificial dyes” according to the Journal.
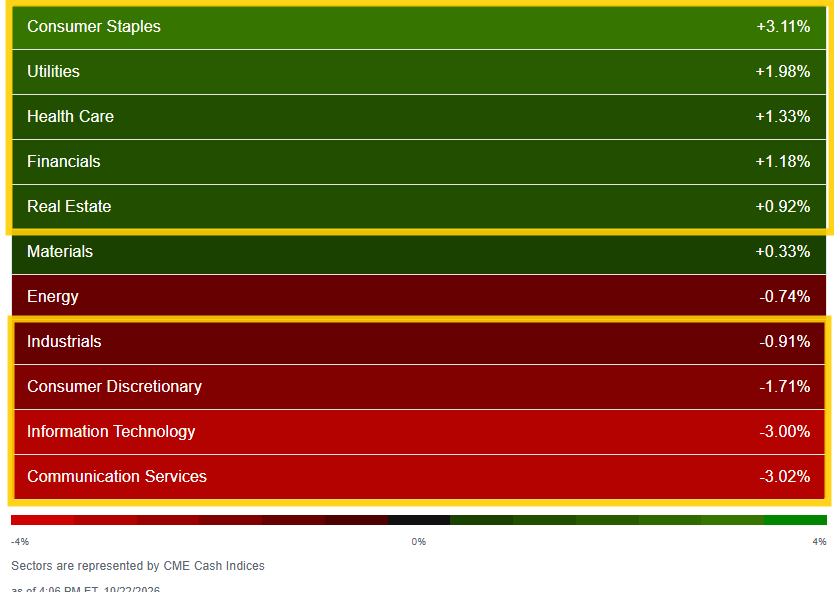
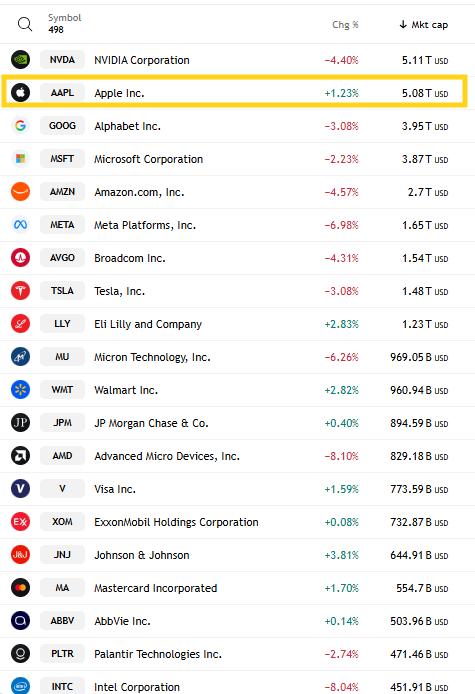
The bifurcation extended throughout the Top 20 with every Health Care, Financial, Staple or Energy stock higher but all other sectors lower with the exception of Apple (AAPL).
As exciting as Staples and Health Care can be, the AI complex was clearly the story of the day, as results from Meta Platforms (META) -7.0%, Tesla (TSLA) -3%, and Lam Research (LRCX) -11.7% overnight contained both positive and negative data points, but it was the latter that markets seized on. I detailed those in New Market Catch-22: Meta Spends Too Much, Tesla Too Little. Declines in those names would spill over leading the iShares AI Innovation and Tech Active ETF (BAI) to its worst day since June, down 6.5%.
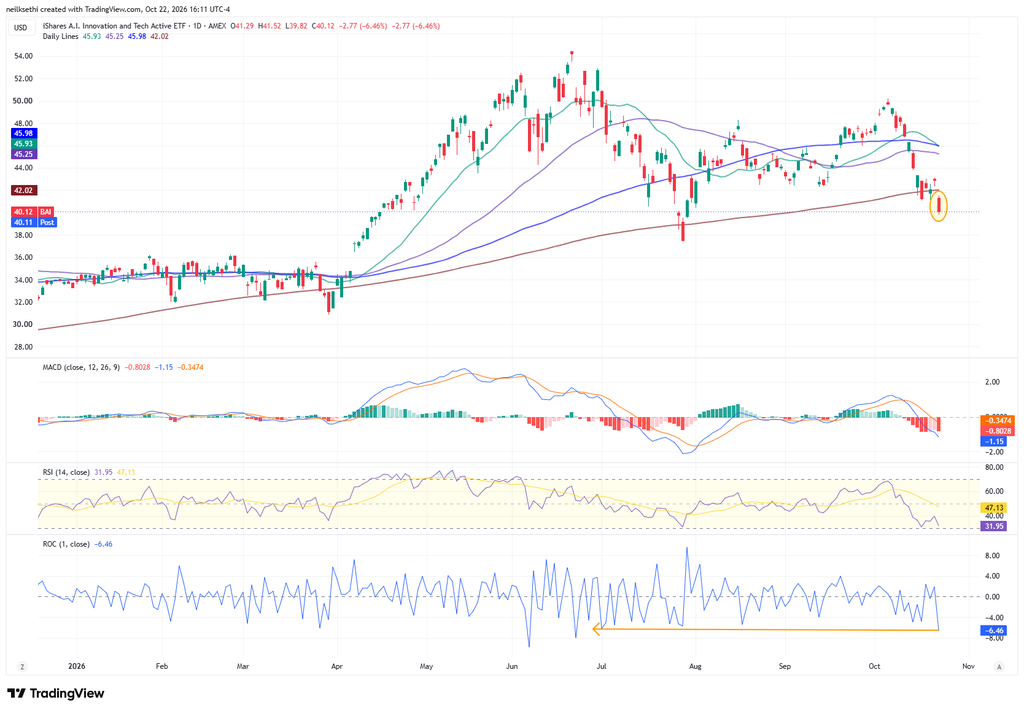
AMD (AMD) fell more than 8%, Micron (MU) 6%, and Nvidia (NVDA) 4%. But it wasn’t just Tech. Industrials fell nearly 1%, with high-profile AI-related names sharply lower, including GE Vernova (GEV) -10.6%, Eaton (ETN) -6.3%, and Bloom Energy (BE) -8.7%.
The biggest loser in the S&P 500 though, was unrelated to the AI selloff in pharma company Moderna (MRNA) -17.6%, which dropped following reports that highly anticipated clinical trial data for its experimental cancer vaccine, developed alongside Merck, leaked online ahead of an official presentation. The reported leak has raised concerns that the vaccine’s effectiveness may fall short of investors’ expectations. Partner Merck (MRK) -1.6% was also lower.
On the other end of the S&P 500 distribution, Allegion (ALLE) +11.0% led the S&P 500 to the upside as the Ireland-based security products supplier reported better than expected earnings.
Share prices of freight railroads CSX (CSX) +6.8%, Union Pacific (UNP) +3.6% and Norfolk Southern (NSC) +3.1% were another bright spot rising Thursday after the companies reported that higher fuel prices are prompting shippers to shift loads to rail from trucks. CSX, Union Pacific and Norfolk Southern reported an increase in volume of 5%, 6% and 3% respectively in the third quarter, according to the Wall Street Journal. Ryder System (R) +10.5% was an even bigger winner in the transport sector following earnings although not an S&P 500 component.
The number of large SPX winners (up over 3%) jumped to ~155, the most since July, from ~40 Wednesday. But the number of large losers (down over 3%) also jumped to ~85 from 12. As mentioned previously, both of these metrics had been very (extremely?) subdued since the start of August, rarely getting above 50 and only twice before above 100, so today was very volatile in comparison.
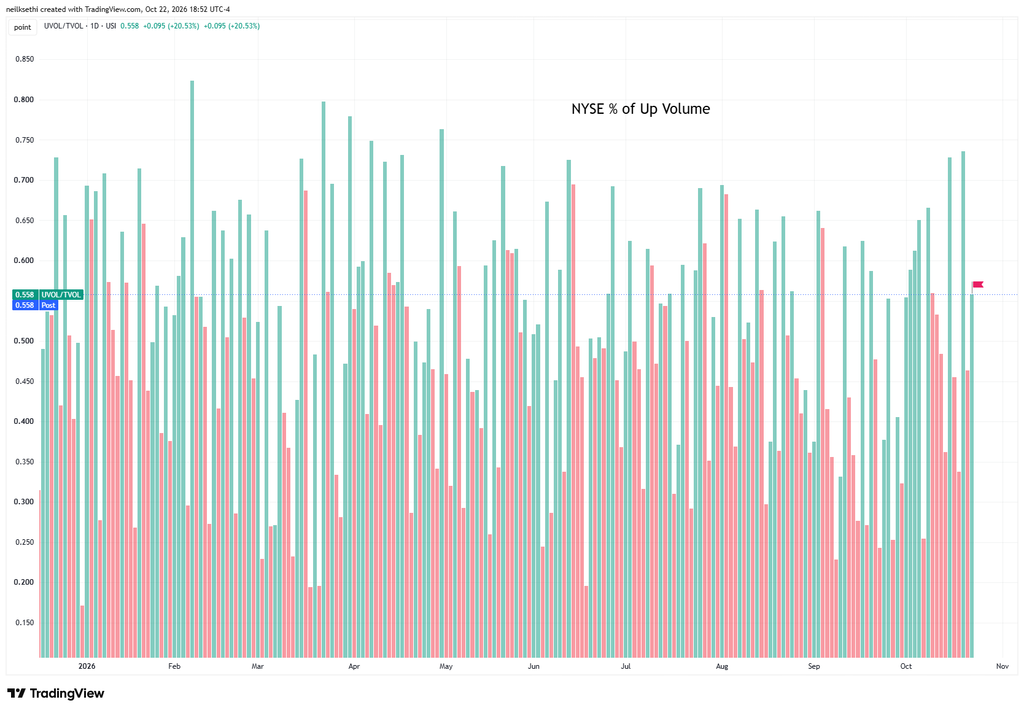
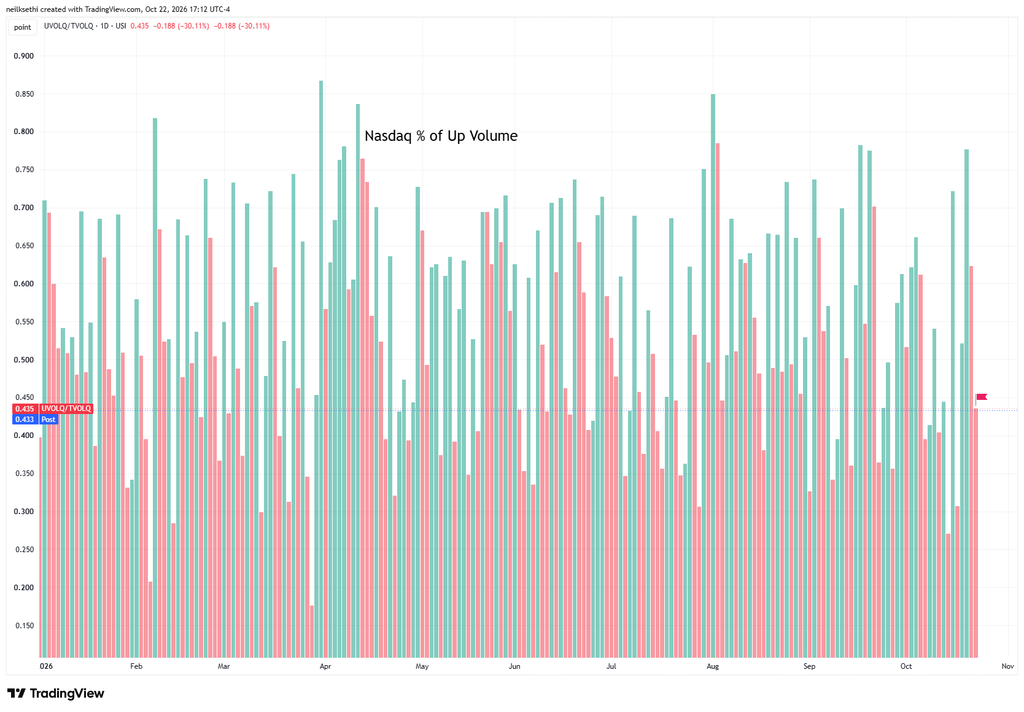
And positive volume got back on track after Wednesday’s awful readings, although not as good as Tuesday. NYSE improved to 55.8% from 46.3% Wednesday even as the gain dropped to +0.35% from +1.18%, while the Nasdaq fell to 43.5% from 61.3% but that was on a -1.56% drop vs a +1.03% gain Wednesday.
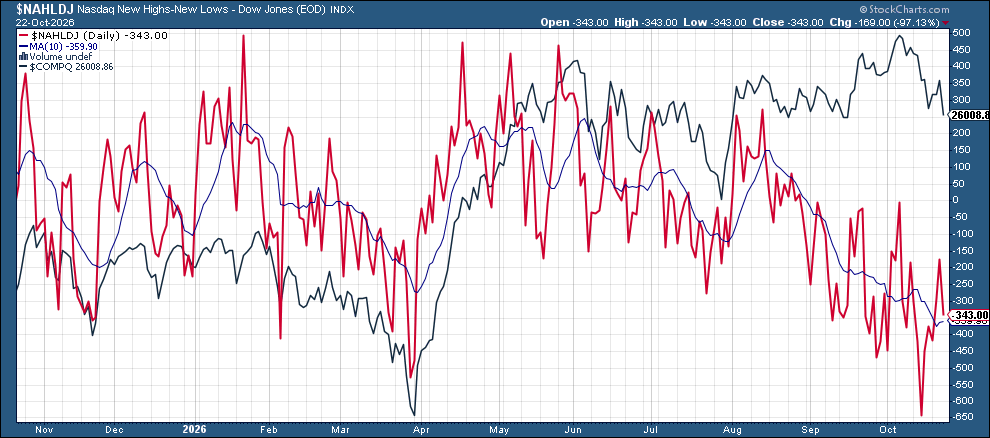
New 52-week highs minus lows followed the indices with the NYSE improving to -30 from -72 but the Nasdaq falling to -343 from -174, the 39th straight session of new lows outnumbering new highs on the Nasdaq, the longest such streak since the 43-day stretch that ended April 22, 2025.
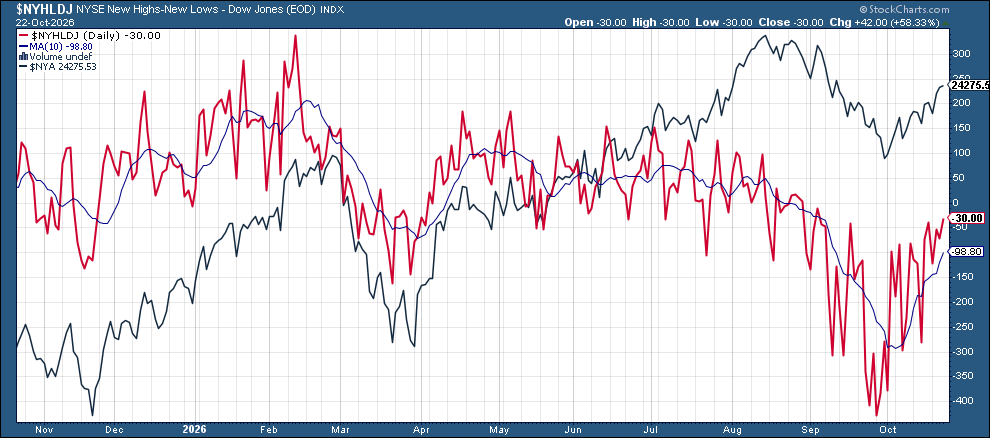
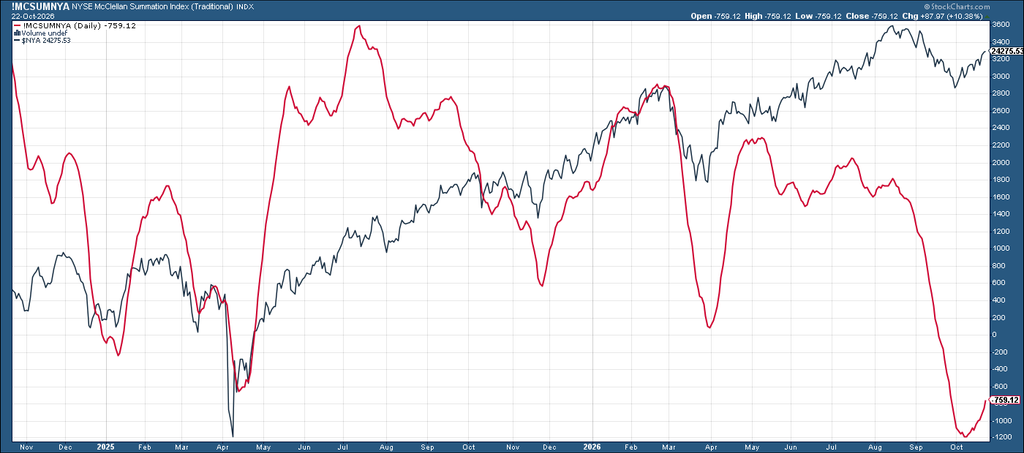
Meanwhile the McClellan Summation Index (red line, broadly whether the typical stock is doing relatively better or worse than the index) has continued its turn higher from the lowest since October 2023.
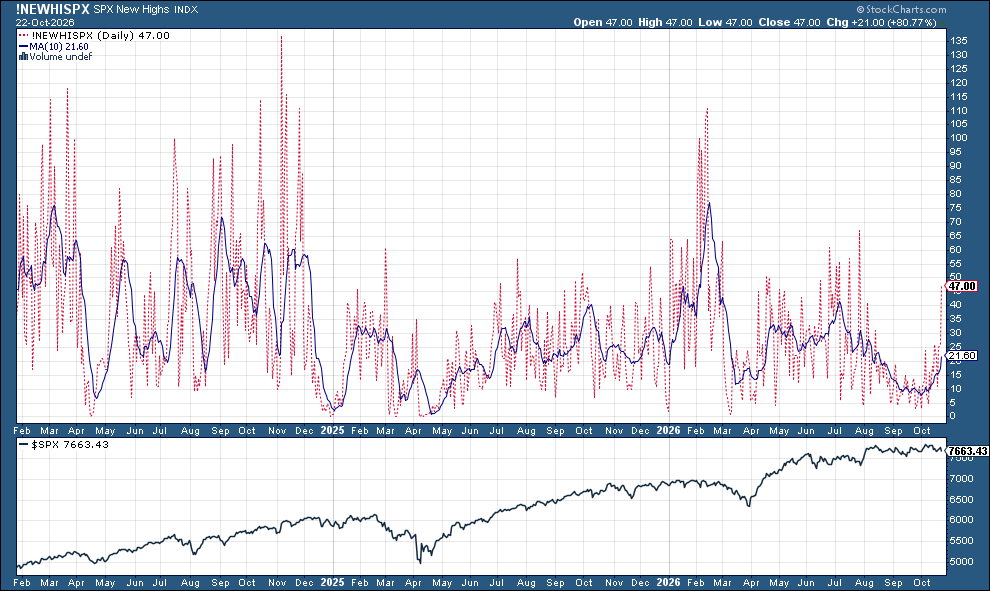
And SPX new highs shot up to 47, the most since July and the 10-DMA is the highest since early August.
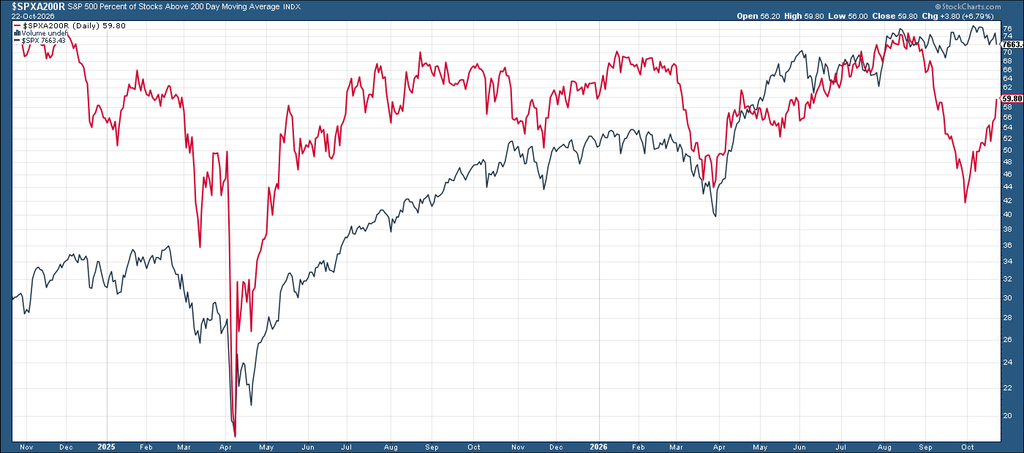
And now nearly 60% of SPX components are above the 200-DMA.
Some other stock-specific commentary from TheStreet Pro:
- Chris Versace –
- Stephen Guilfoyle – Here’s My Move on IBM After Earnings
- Bob Lang – Chart of the Day: Broadcom Looks Bearish. A Time to Buy?
A Look At The Charts
Note on all charts the colored lines are moving averages (the average price over the lookback period — days on the daily charts, weeks on the weekly charts):
20 = green
50 = purple
100 = blue
200 = brownException is monthly charts where blue is 10-month moving average and brown is 20-month moving average.
MACD = Moving average convergence/divergence line, a measure of momentum that compares longer term and shorter term momentum to gauge if a move is strengthening or weakening. This is probably my favorite individual indicator.
RSI = Relative Strength Index (basically what it sounds like) = measures the strength of the move comparing gains to losses over the given lookback window (I use the standard 14 periods).
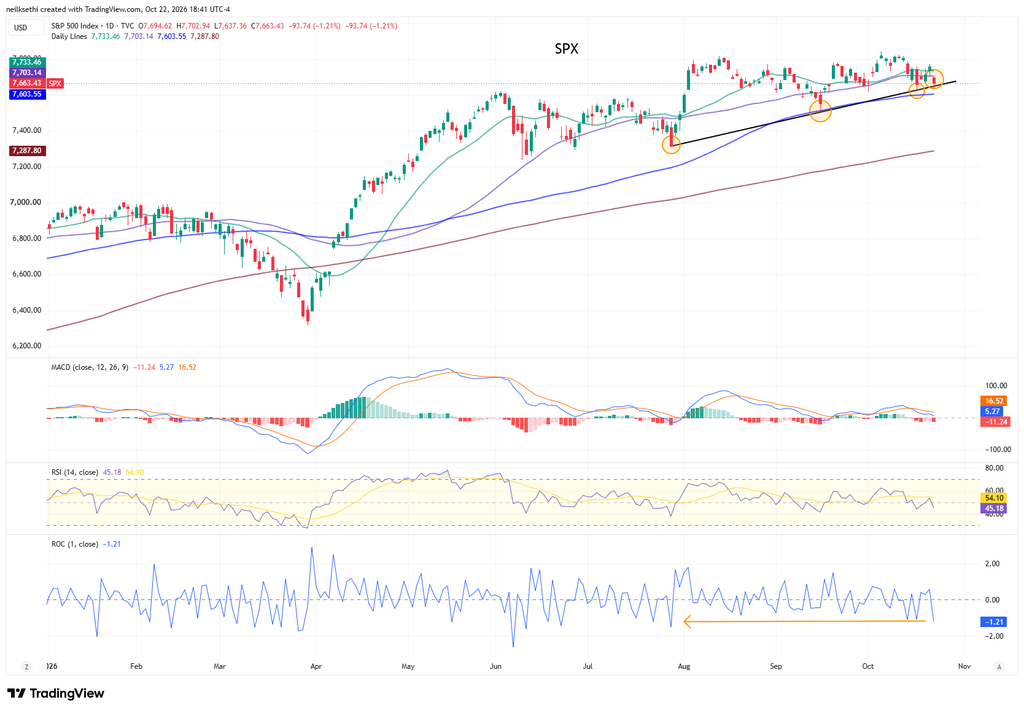
SPX fell back under its 50-DMA to the trendline from the July low. It was the worst session since July. This is now the third touch of the line, so a break would be notable and see me selling my S&P 500 ETF (SPY). As noted last week the daily MACD and RSI had slipped negative and remain so.
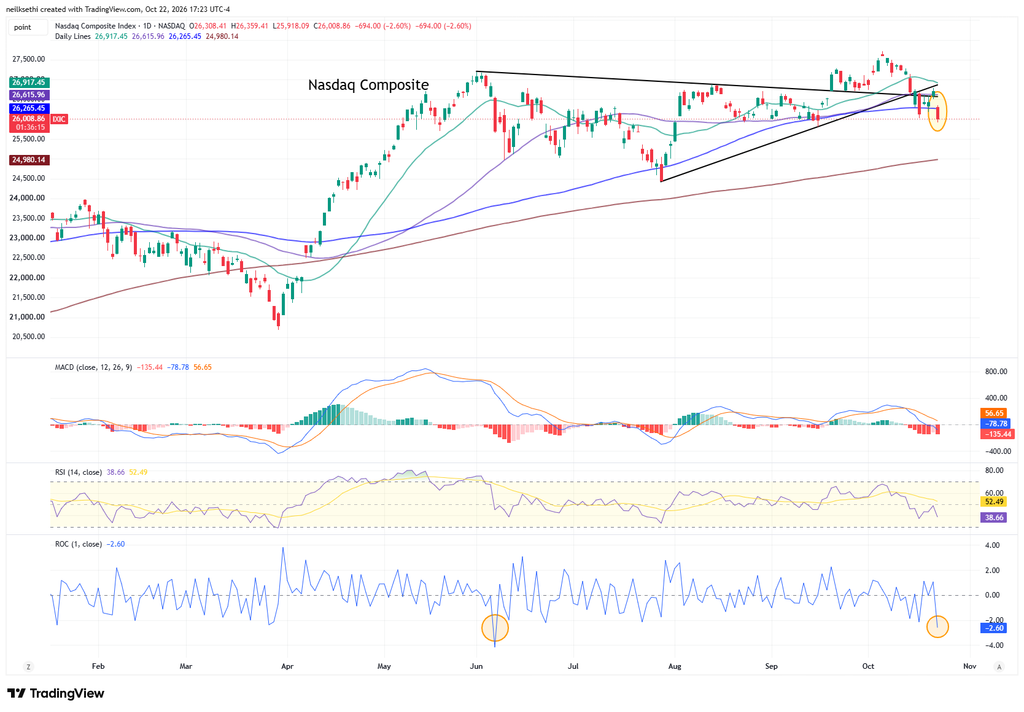
Nasdaq Composite fell through not only its 50-DMA but also its 100-DMA, the lowest close since mid-September. It was the worst day since June. As I noted last week, it has a MACD sell signal (almost a “go short” signal) and the RSI has fallen under 40.
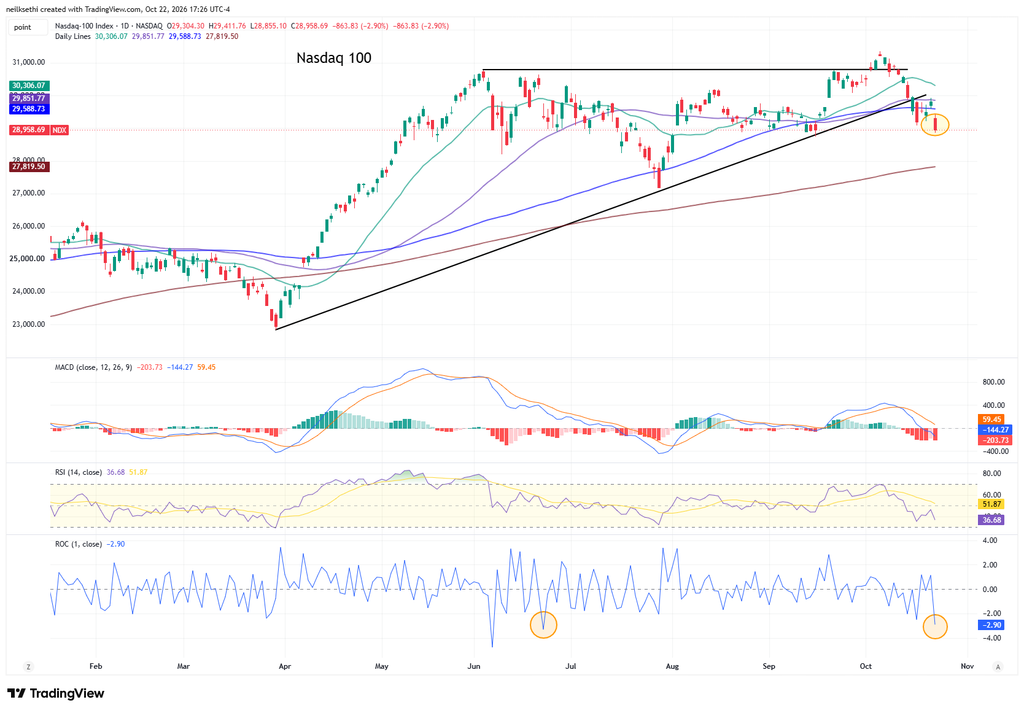
The Nasdaq-100 (QQQ) a similar story. Given the size of the drop in these, I would expect a bounce, but for me it will be one to sell until it reclaims the 50-DMA or has a deeper correction.
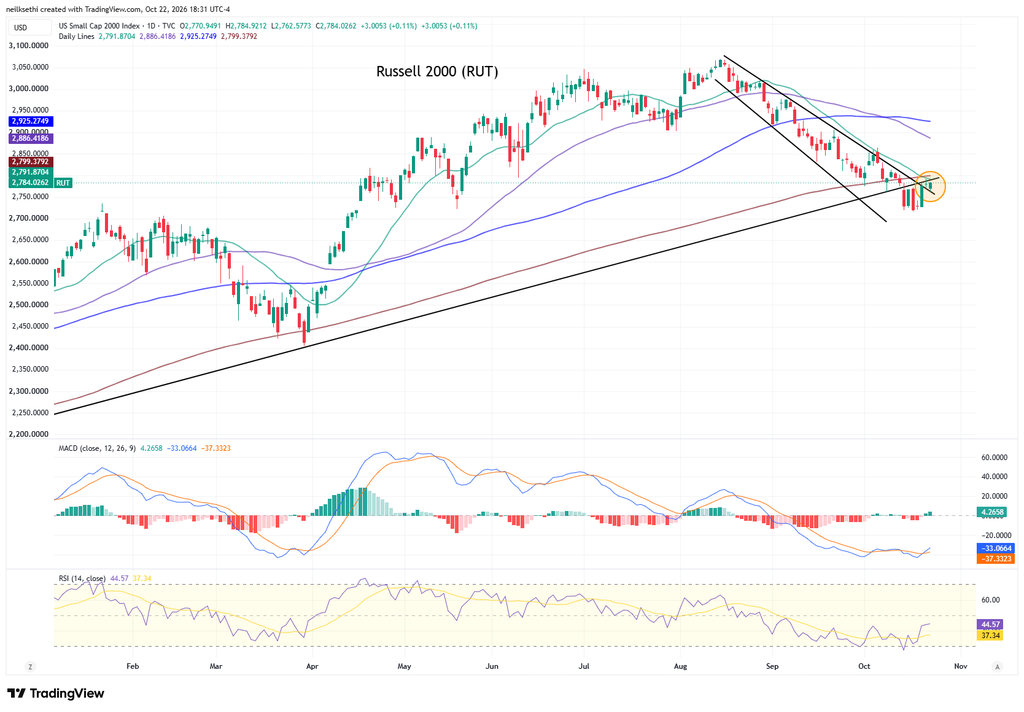
The Russell 2000 (IWM) not able to make much progress, but at least didn’t go down (which is saying something today). It remains below its 200-DMA. The MACD though as mentioned Wednesday crossed to “cover shorts” positioning and the RSI is moving back towards 50, so if it gets over the 200-DMA I’ll get back in.
The equal-weighted SPX (RSP) which I have said has been “able to hold up better” the past couple of weeks extended further above its 50-DMA. It continues to have by far the best technical setup with nothing to complain about on the daily chart.
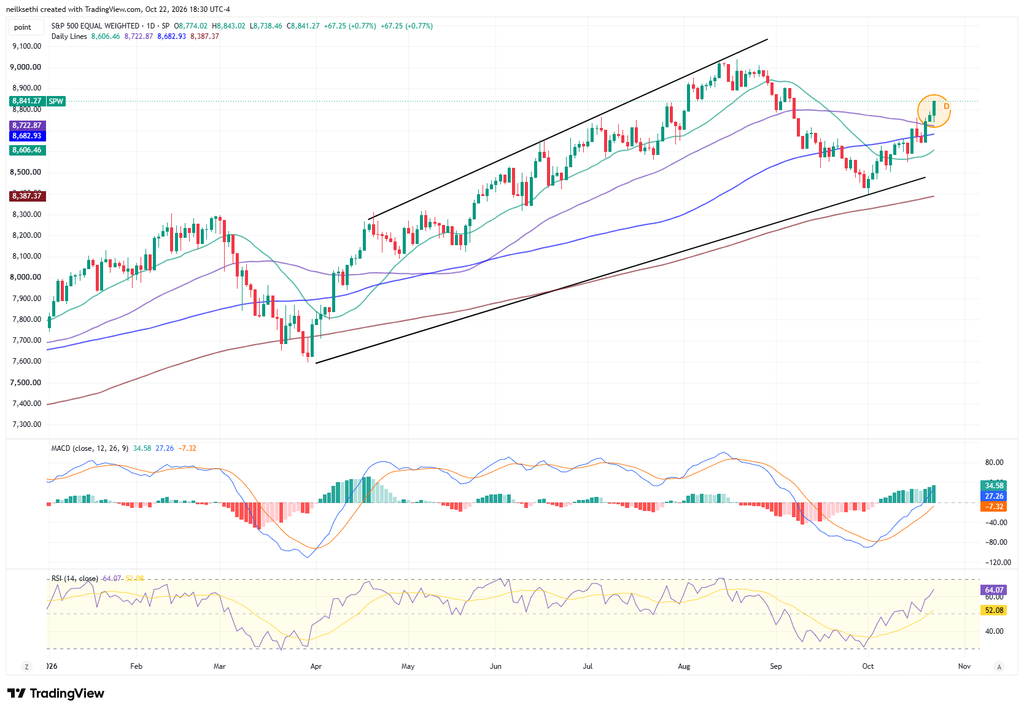
If you missed it, I wrote about RSP today: Can I Interest You in Some RSP?
Treasury yields fell sharply across the curve.
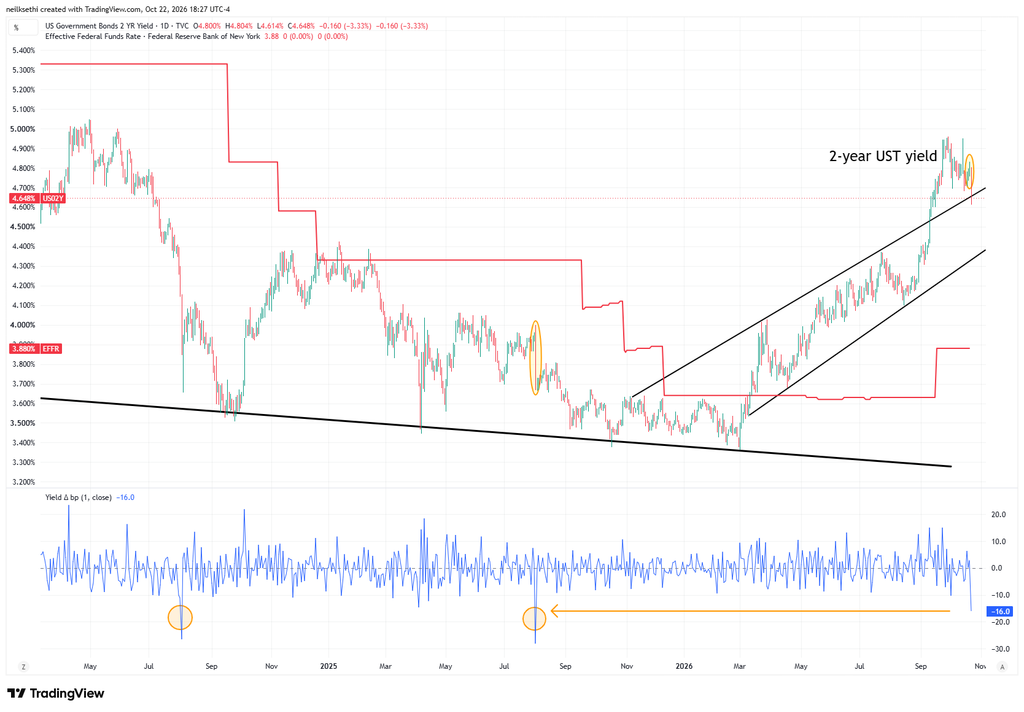
The 2-year Treasury was down 16 basis points (including the after-hours), the largest drop since August 2025 (and before that August 2024). It is now finally back in its channel from the start of the year as well.
It is ~77 basis points above the Effective Fed Funds rate, so calling now for just one or maybe two more rate hikes (it historically has traded 25-50 basis points above the Fed Funds midpoint).
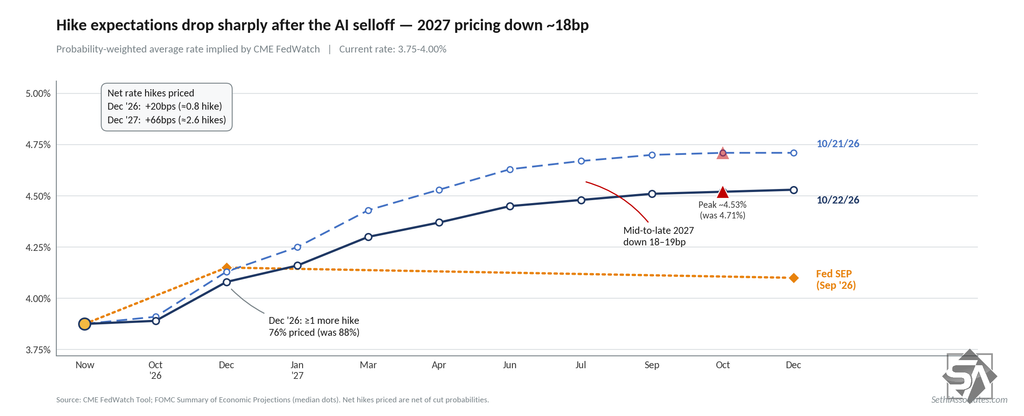
Fed rate hike expectations also dropped sharply. October is now a 93% chance of a hold, and December is less sure of a hike at 76% (from 88%). 2027 expectations dropped as well with now just 66 basis points of total hikes priced through December next year down from 83 basis points Wednesday.
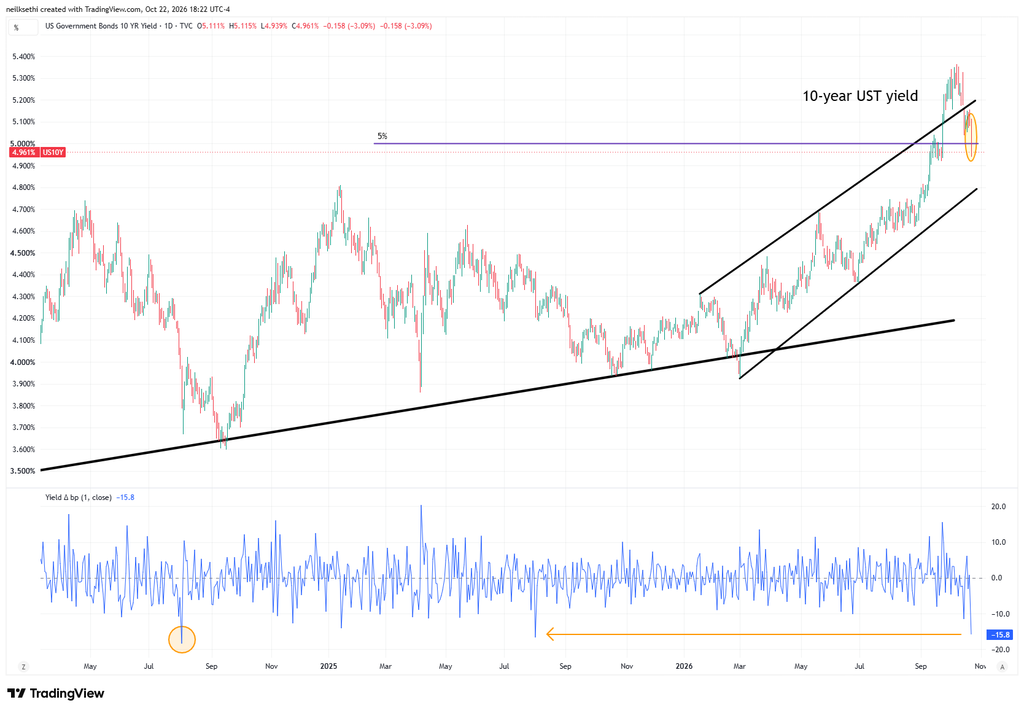
10-year yields dropped nearly 16 basis points (including after-hours) back below 5% to 4.96%. That was the biggest drop since August 2025 and before that August 2024.
30-year yields down over twelve basis points (including after-hours), the largest drop since November 2024, taking the yield to 5.29%.
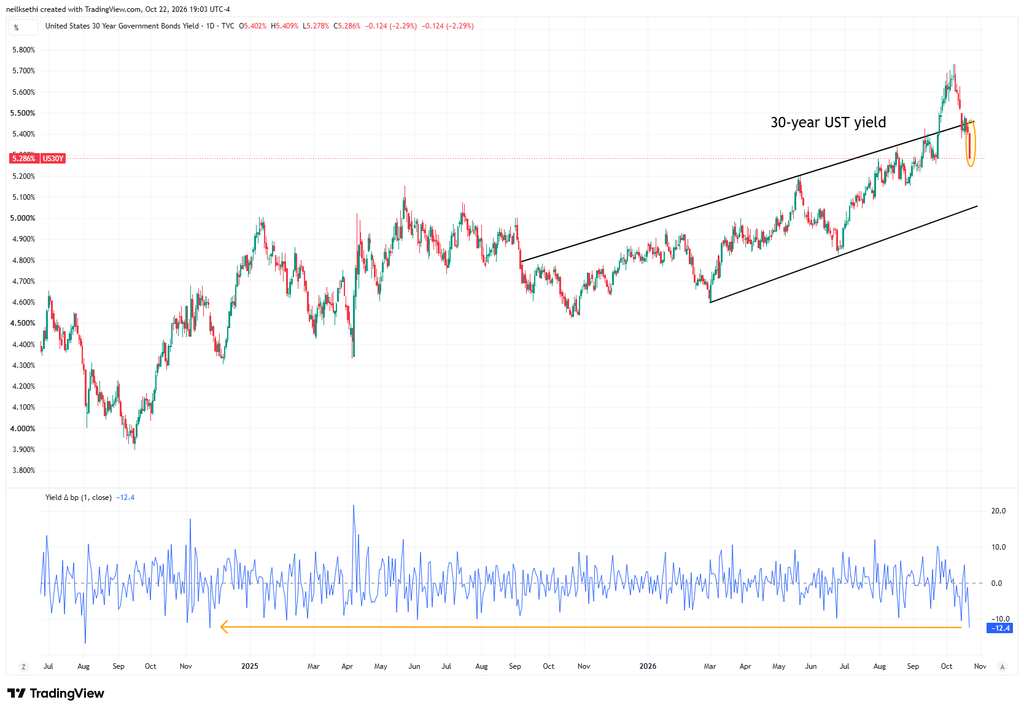
And with rates dropping notably again across the curve, we should be firmly into CTA short covering according to BofA’s rates strategists (Meghan Swiber and Eleanor Xiao) who said entering the week “CTA short covering is already underway in the long end, leaving scope for an extended rally if front-end and belly triggers are reached.”
As of Friday, the 10-year was sitting right at the top of its trigger range, with the 2-, 5- and 7-year all within about 3bp, and each range fully crossed within roughly 7–12bp. BofA puts industry CTA positioning near $280B in 10-year equivalents (about $170M of buying per basis point in an unwind).
That doesn’t though change their bigger picture. They see the setup “as consistent with tactical rallies inside a still-bearish medium-term rates backdrop. Strong US data keeps the Fed’s ‘hike or bond spike’ problem in focus: if the Fed remains patient despite resilient data, the bond market may increasingly force its hand.”
They continue to expect rates to rise and the curve to flatten “until policy becomes demonstrably restrictive through softer macro data or tighter financial conditions,” but note that “concentrated shorts also leave room for sharp countertrend rallies, particularly during non-inflationary risk-off episodes when USTs retain their defensive diversification benefit.”

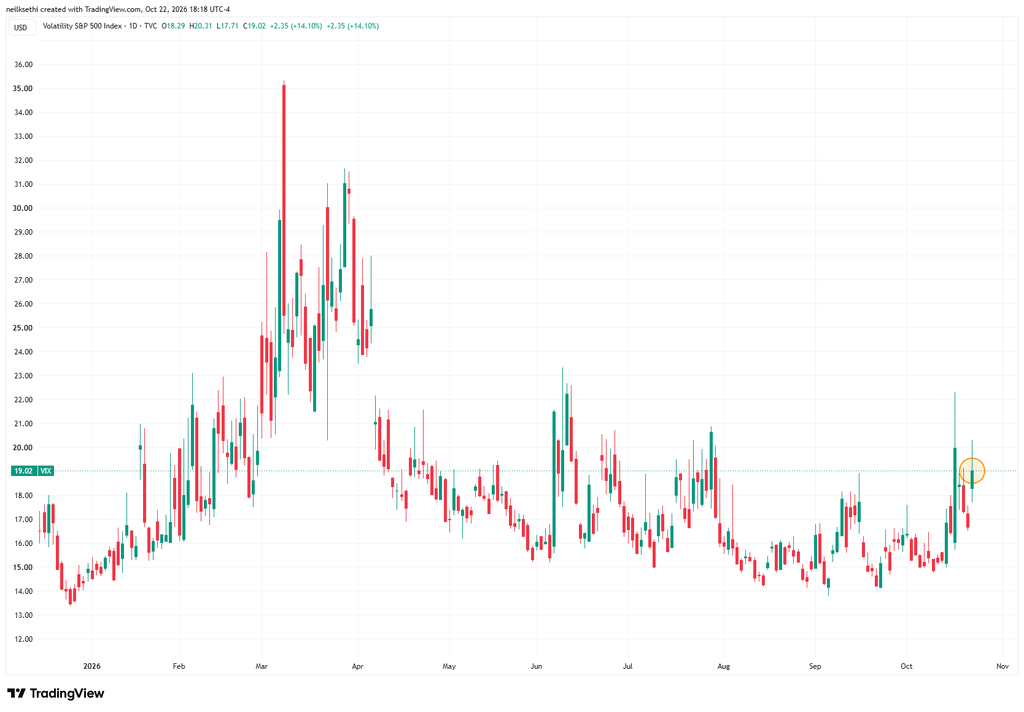
VIX jumped back up to 19.0, remaining though below the levels hit last Friday. The current level is consistent with ~1.19% average daily moves in the SPX over the next 30 days.
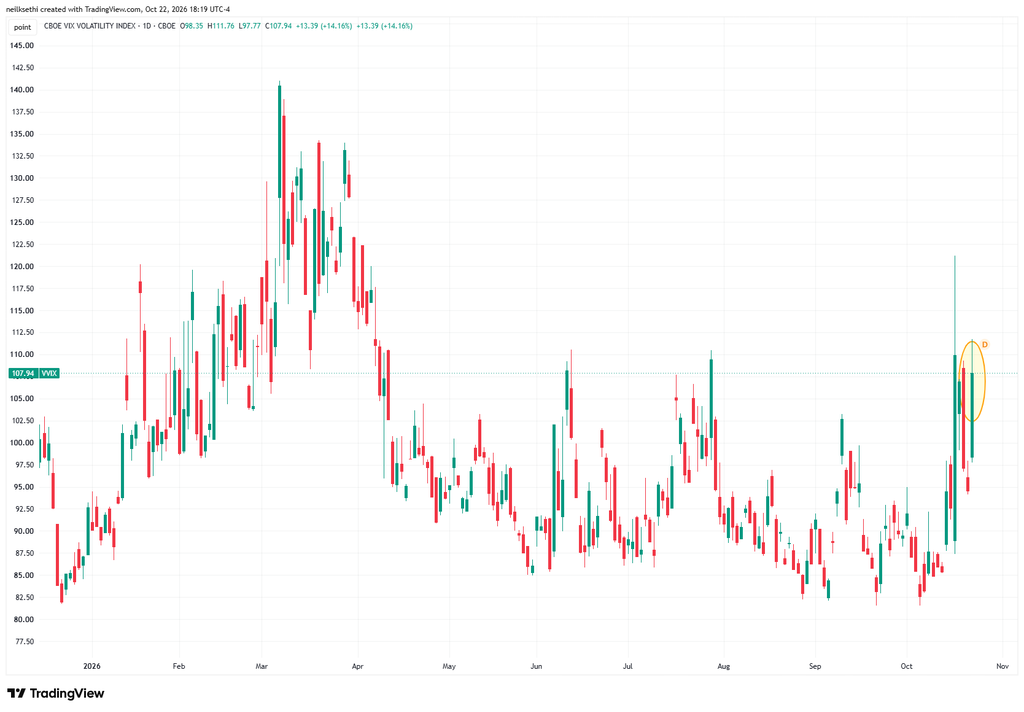
The VVIX (VIX of the VIX) similarly up to 107.9. The current level is consistent with “elevated” daily moves in the VIX over the next 30 days (historically, normal is 80-100, although we haven’t been below 80 since July 2024). Above 100 is the level flagged by Charlie McElligott as indicating higher stress.
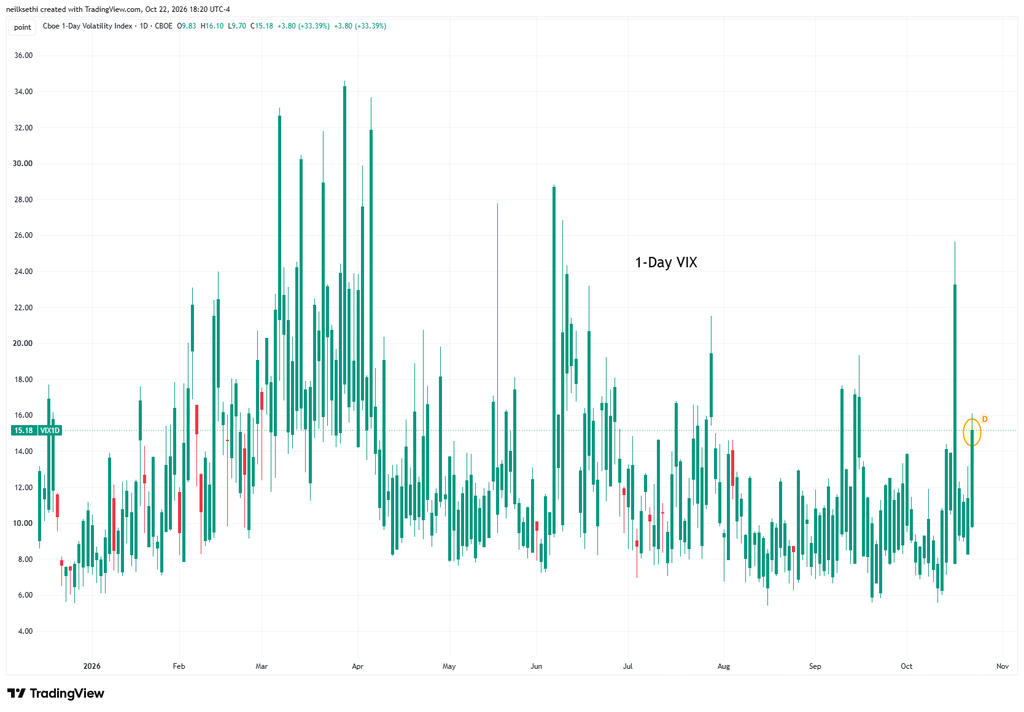
1-day VIX up to 15.2. The current reading is consistent with a move of 0.95% in the SPX next session.
WTI futures (/CL), which TradingView has at December currently, up for the first time in four sessions to a 1-month high (including after-hours).
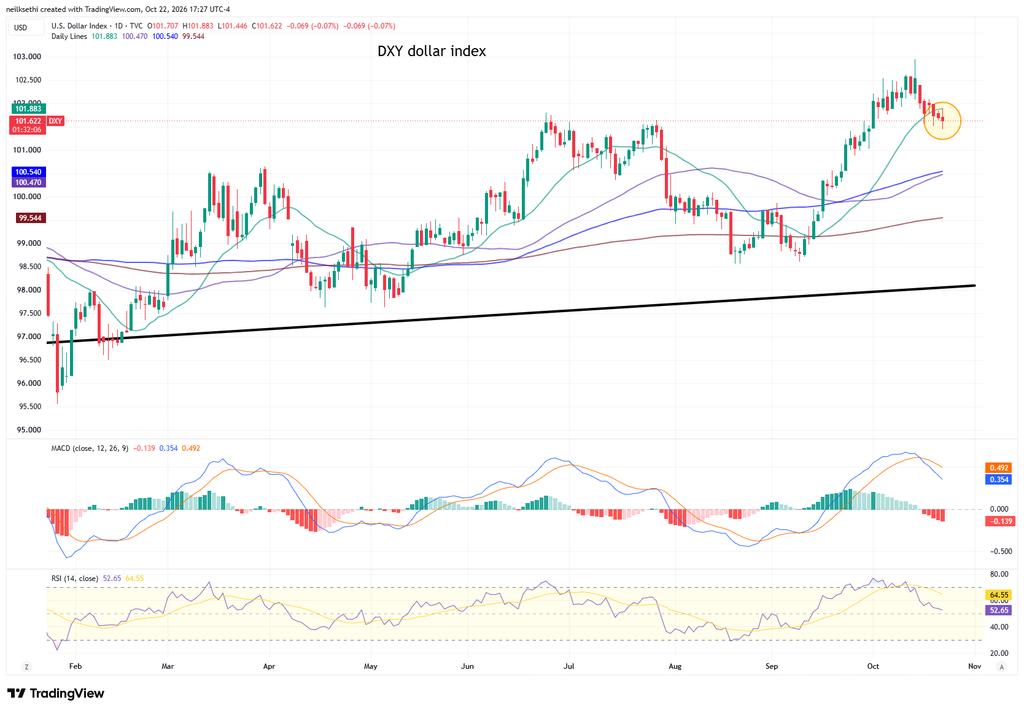
The DXY dollar index (which is fixed weighted with a heavy 57% weighting vs the euro) eased back for a third session slipping further under its 20-DMA. As I mentioned Friday “The daily MACD flipped to a ‘sell longs’ positioning while the RSI has fallen from over 70 to well under, both of which would argue for a consolidation.”
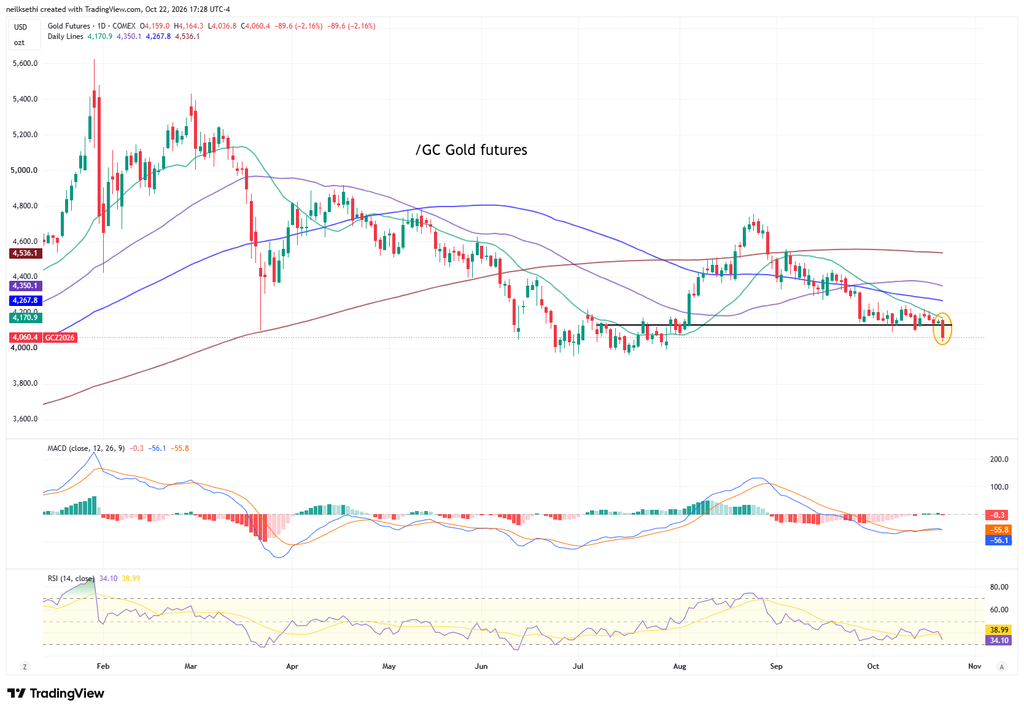
Gold futures (/GC) fell through support to the lowest close since July. The daily MACD is neutral but the RSI is now under 40.
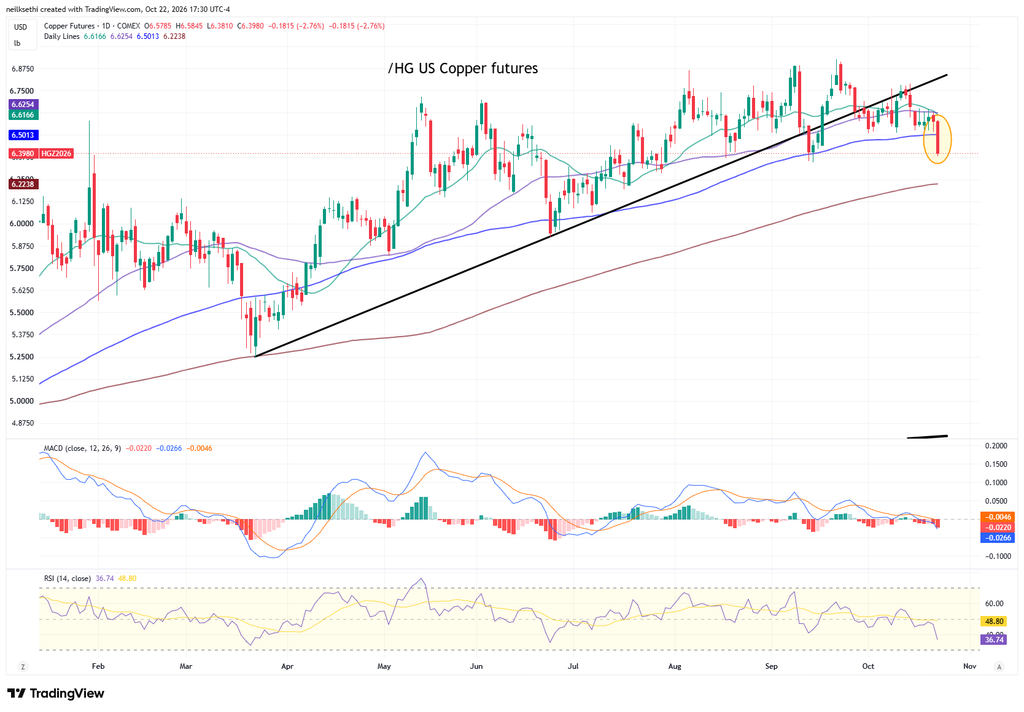
US copper futures (/HG) fell with the AI trade to the lowest close since July. That’s the bottom of their range since then, and any further declines and I will have to start selling my copper ETF (CPER) position. Daily MACD and RSI have turned more negative.
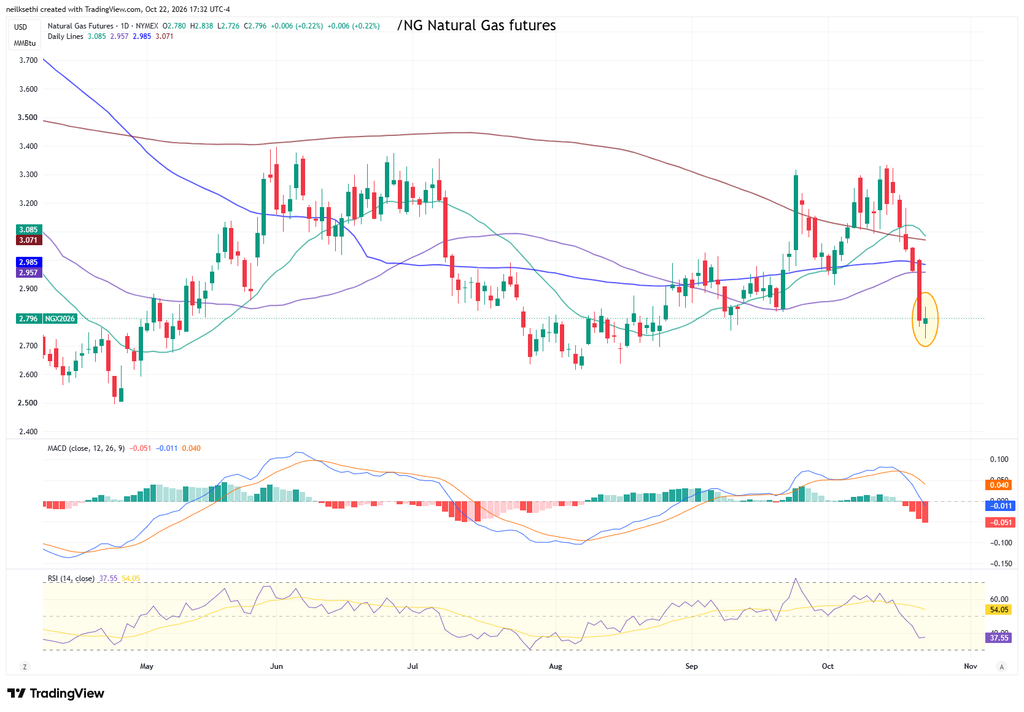
US natural gas futures (/NG) got a very modest gain, breaking a five-session losing streak, but remain in the lower half of their range since March.
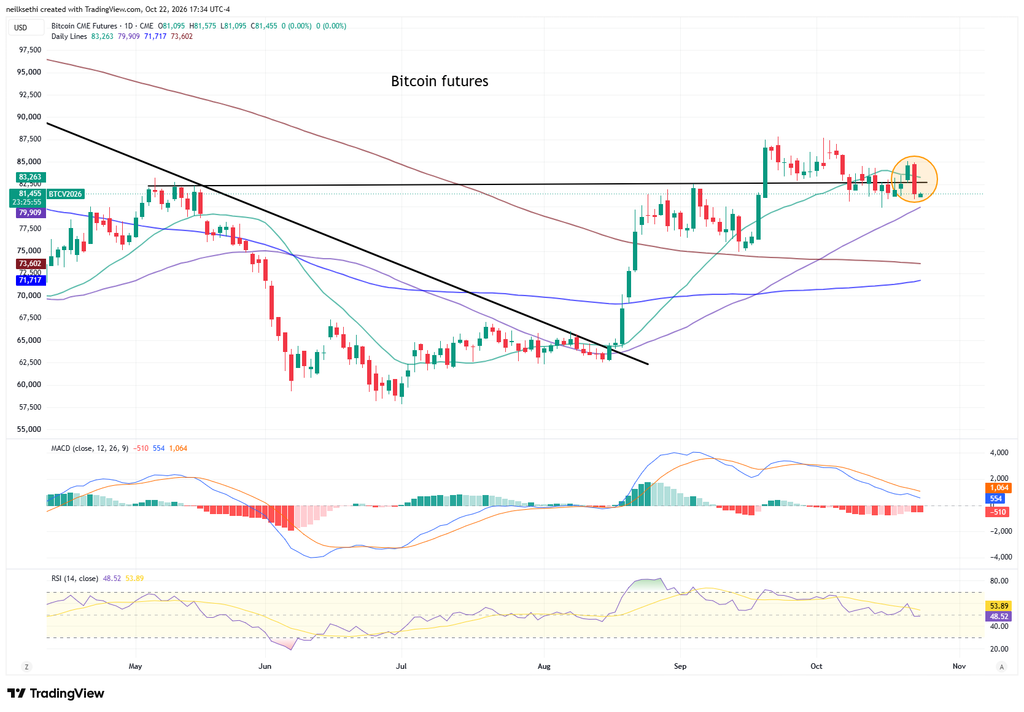
Bitcoin futures also fell back. I knew I shouldn’t have gotten back in with a small position in the iShares Bitcoin ETF (IBIT), but I’ll hold it for now to see if it can get back on track. If it breaks last week’s low, I’m back out. Daily MACD remains weak, and the RSI is under 50.
More From TheStreet Pro:
- Chris Versace –
- James “Rev Shark” DePorre –
- Helene Meisler – A Change in Sentiment Would Help. Here’s Why
- Ed Ponsi – After Overnight Selloff, Where Are the Indexes Headed Next?
- Stephen Guilfoyle – Fool Me Once… Fool the Trading Algos Over and Over Again
- Alex Frew McMillan – Indonesia Remains World’s Worst as China Hits Bear Territory
And From Me If You Missed It:
- BofA Sees Heavy Institutional Selling Last Week
- Redbook Sales Remain Very Solid
- AAII Sees Bulls Fall Further Under Bears
- Initial Jobless Claims Fall to the Lowest Since July
Miscellaneous:
Wrap-Up – The Rotation Continues
I said Wednesday:
notably today we didn’t see Tech suck the oxygen out of the market with six other sectors green on the day. Also, long bond yields didn’t follow Tech higher. So a number of positive developments. No names on the scale of today’s headliners tomorrow, so we’ll see how markets digest tonight’s batch.
And the answer is “not well”. As detailed above it was a “sell everything AI” day, so clearly this correction has more to go (which is completely consistent with the Deutsche Bank roadmap I said I should be following which says this should run through at least the end of the month). At this point as far as the AI trade goes the bears are in firm control of both the narrative and the market action, so as I said after Monday’s bounce “it will take more than one or two days to change the trend.” At this point we can’t even string two days together. I exited several more related stocks today and even put on a few shorts as they broke support. That will continue until the AI trade gets back on track.
But as I have also mentioned the past two weeks, the softening in the AI trade has also meant a softening in rates which has freed the rest of the market to make great strides. And now we’re in the midst of the bond short covering I’ve been mentioning almost daily for several weeks. How far all this has to go your guess is as good as mine. But until it stops we have to work with what the market is handing us.
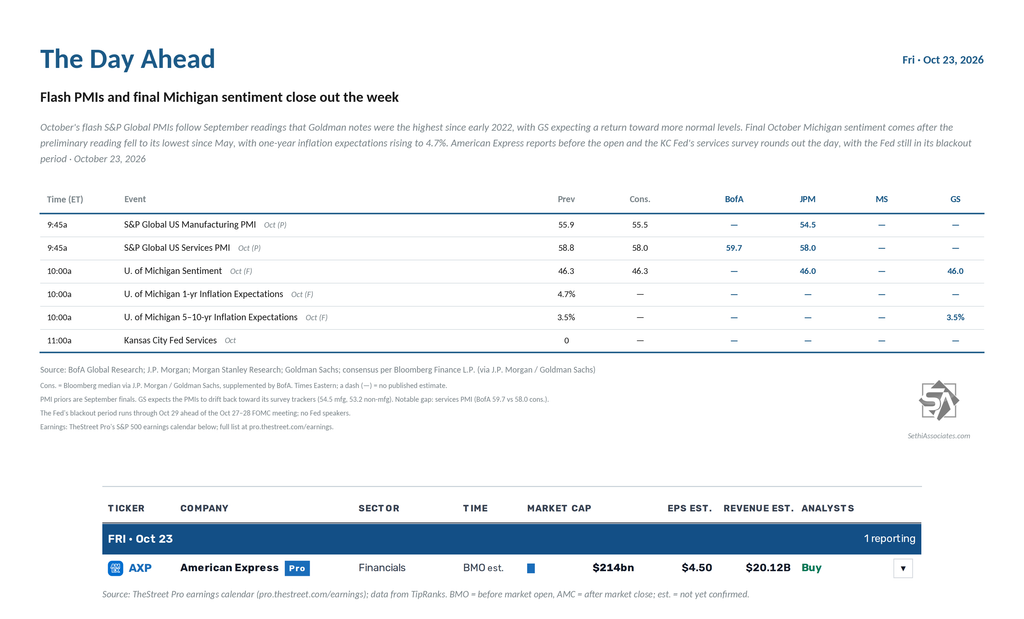
The Day Ahead – Flash PMIs Headline A Light Friday
US economic data closes out the week with October’s flash S&P Global PMIs, final University of Michigan consumer sentiment and the Kansas City Fed’s services survey.
The Fed remains in its blackout period ahead of next week’s October 27–28 FOMC meeting.
No non-Bill (>1yr in maturity) US Treasury auctions.
Q3 earnings season continues with one S&P 500 component, American Express (AXP).
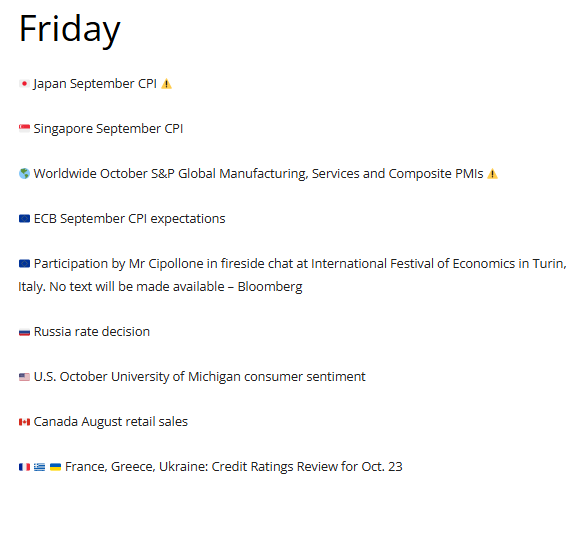
Ex-US highlights are global flash PMIs, ECB consumer expectations survey, UK October GfK consumer confidence, September retail sales, Japan September national CPI, and Canada August retail sales.
From Christophe Barraud’s international Week Ahead rundown:
At the time of publication, in terms of equities mentioned, Sethi was long NVDA, TSLA, META, SPY, RSP, CPER, IBIT, and numerous equities in the energy sector and short AMD.
As a reminder comments are encouraged. If they are directed at me, please put @NeilSethi in front.