Charting the Markets: Correction in the Dow Industrials May Have Ended
A gentle glide down to the lower Bollinger band this past week signaled a spot where dip buyers often jump in.
You've reached your free article limit
You've read 0 of 1 free Pro articles.
One of the two weak indexes over the last two months has been the Dow Industrials (DIA). The “industrials” peaked in July and since then have been on a bad trip, making a series of lower highs and lower lows.
That is our textbook definition of a downtrend, of course, and the indicators have been consistent with the situation. However, a stock or index can fall far enough in time and price to reach levels that might offer a good contrarian move. I think we have arrived at that moment for the DIA.
Take a look at the chart. While the recent slide has been defined, the candles are still teal, so cautiously bullish. That is important, as the index has now landed on the lower Bollinger, often a place where dip buyers get active. I expect that to happen as earnings season gets underway.
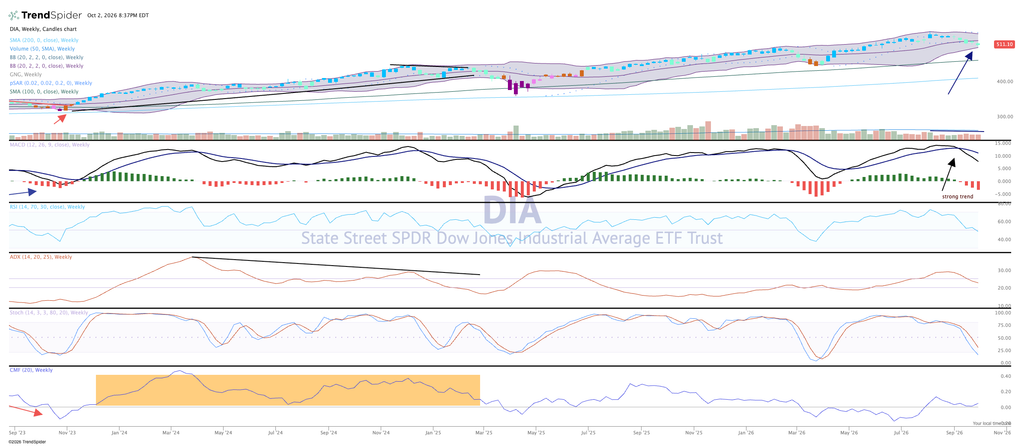
Money flow is struggling to stay positive, the MACD remains on a sell signal and momentum has slowed significantly. Nothing is easy or clear here, but the odds favor a nice bounce in the coming weeks.
