850 New Lows on the Nasdaq Suggest Stocks Are in a Bear Market
Even though the indexes have held up, many stocks are trading at new lows. That indicates a bear market. Here’s what I’m watching to play a tradable rally.
You've reached your free article limit
You've read 0 of 1 free Pro articles.

The Market
I know if you are long the market, this last week has been particularly painful. It is not my intention to add to the pain. It is my intention to let the indicators guide us so that hopefully we can locate the next tradeable rally.
As a reminder, I have likened this market to the market in 2022. That was a bear market. So is this one. I don’t care what the indexes say. You don’t get over 850 stocks making new lows on Nasdaq in bull markets unless it is quick and over in a few weeks, like Covid, back in 2020.
I like to find the point in time that the market is oversold and sentiment is bearish. When those two line up, we tend to have a tradeable rally. In early October, we had the non-mega-cap tech stocks oversold (the others) enough to rally, but we had a lot of complacency.
Now we have wiped that complacency away and are bordering on bearishness. Not all of my sentiment indicators are showing too many bears. As I explained yesterday, the Investors Intelligence survey is not overtly bearish, neither is the AAII readings we got today.
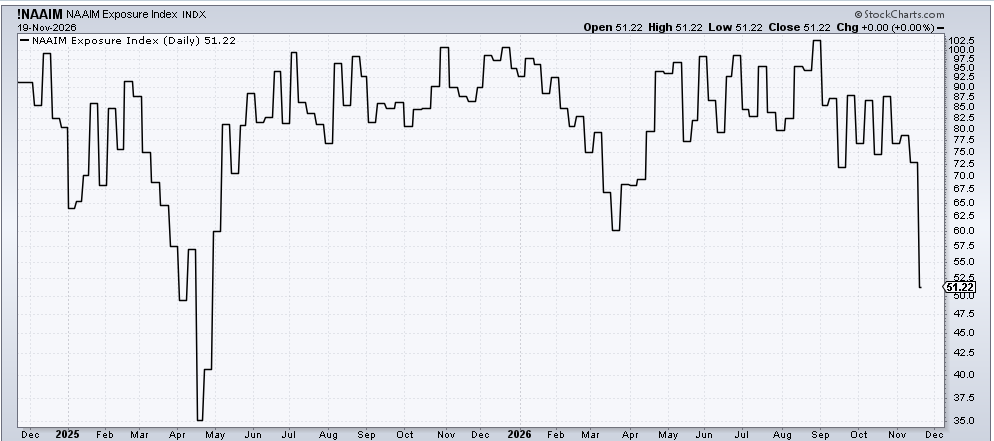
But we did see a serious change in sentiment from the folks at NAAIM. They have reduced their exposure down to 51. They were at 35 at the Tariff Tantrum. That means they are lower now than they were even in the spring when the war began. Not extreme, but pretty bearish for this cohort.
We have the DSI for the S&P at 10. We have the DSI for Nasdaq at 11 (down from 20 yesterday). You might recall from September when I thought the bonds were bottoming; the DSI for bonds got to single digits, but still interest rates had one last fling upward before exhausting themselves. The indexes (or metals, for that matter) are no different. It need not coincide exactly, but it says we’re close.
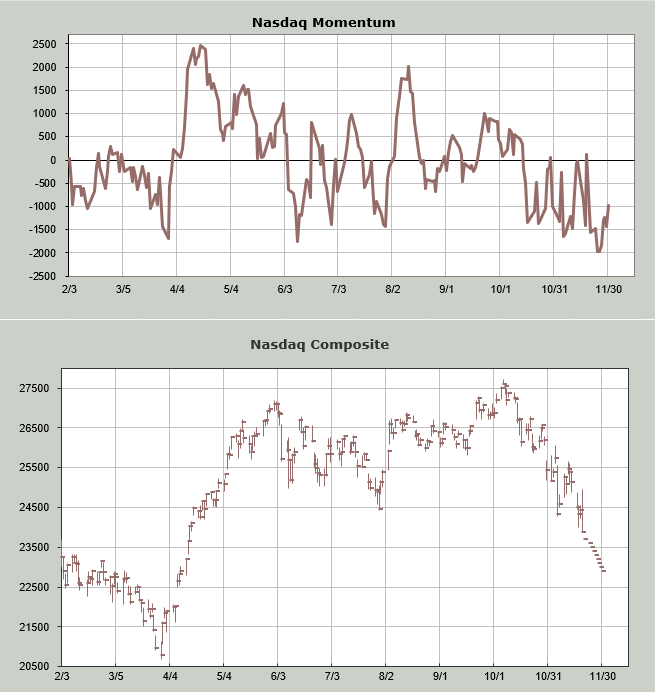
That brings me to the oversold condition. If we plug in lower closes for Nasdaq over the next week or so, we find that the Nasdaq Momentum Indicator turns up (even if price keeps going down) midweek next week. Here too, this is not meant to find the exact day but rather the general time frame.
This morning had yet another whiff of panic. For true panic, I like to see 90% of the volume on the downside. Today we got 84%. Could that be because of Anthropic? Could be, but I do not like to rationalize an indicator.
I think we are poised for an oversold rally next week.
New Ideas
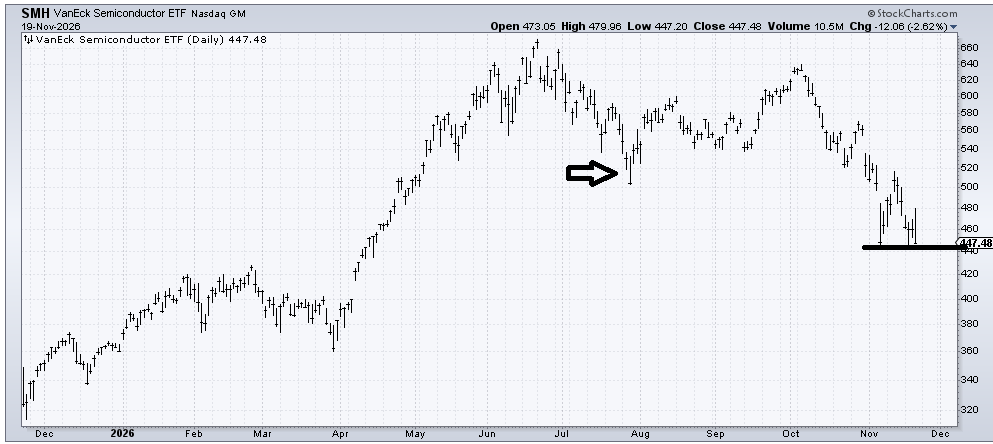
I’m going to focus on the semis as a place to rally. It’s obvious the selling in the semis wasn’t severe today, or at least not enough to break SMH under the recent lows. In July, we had that plunge to a lower low that caused a little panic. I don’t know if we get something like that this time, but the SOX has a habit of breaking and rebounding. That’s what’s on my radar over the coming days. It is just a trade.
Today’s Indicator
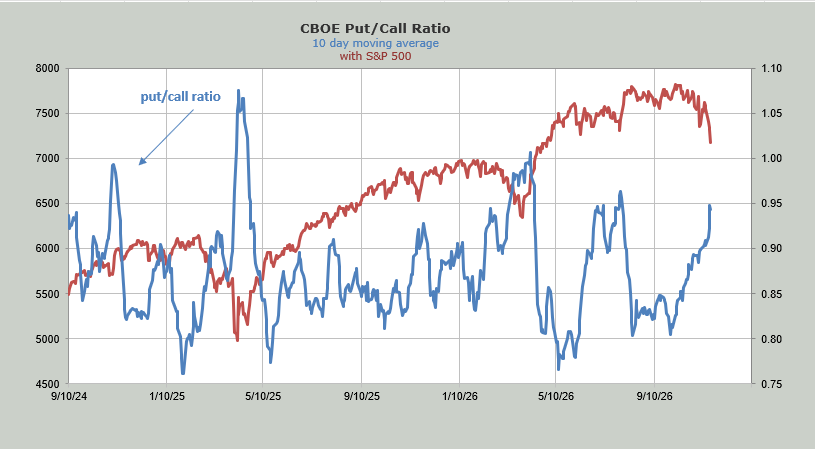
The ten-day moving average of the put/call ratio is now at .94. It got to .97 in July. It is finally getting into the zone that says folks are no longer complacent and maybe even bearish.
Q&A/Reader’s Feedback
Helene welcomes your questions about Top Stocks and her charting strategy and techniques. Please send an email directly to Helene with your questions. However, please remember that TheStreet.com Top Stocks is not intended to provide personalized investment advice. Email Helene here.
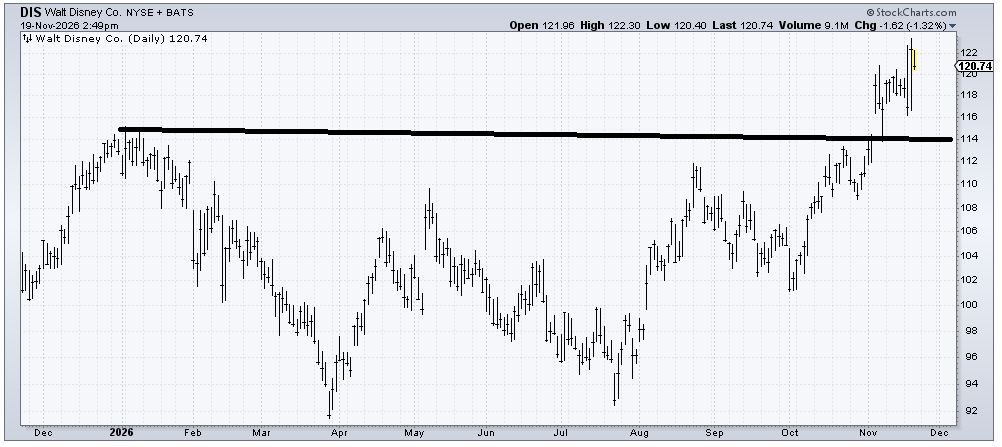
I know I am supposed to like the chart of Disney (DIS) because it broke out and I thought it would stop around 114. But I can’t shake the sense that the breakout feels more like shorts covering than real buying. But aside from my ‘feelings,’ the chart is fine as long as it stays over 114.
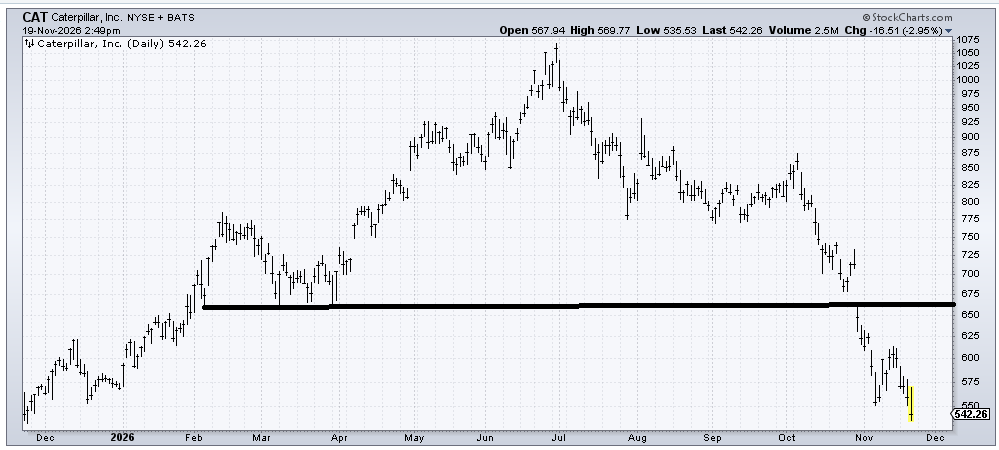
I was wrong to think Caterpillar (CAT) could buck the tide and rally more than it did. The stock is still very oversold, but I’d say a bounce near 600, if it can get that far, should be sold.
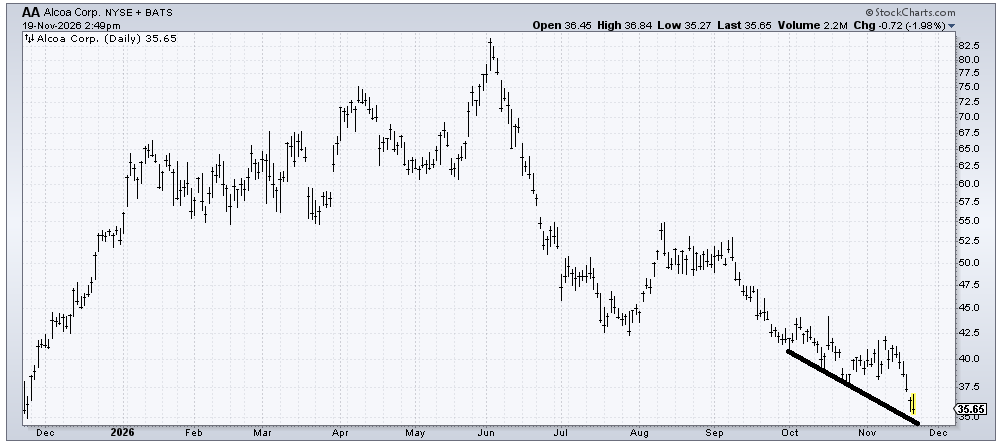
Alcoa (AA) has been my biggest disappointment for a tax-loss rally candidate. It was poised to go a week ago, and then the metals collapsed. Since most of the metals had single-digit DSIs, I figure it has to be close to a bounce. A gap up over 37.50 would actually make the chart bullish. Barring that, we’ll have to sell rallies.