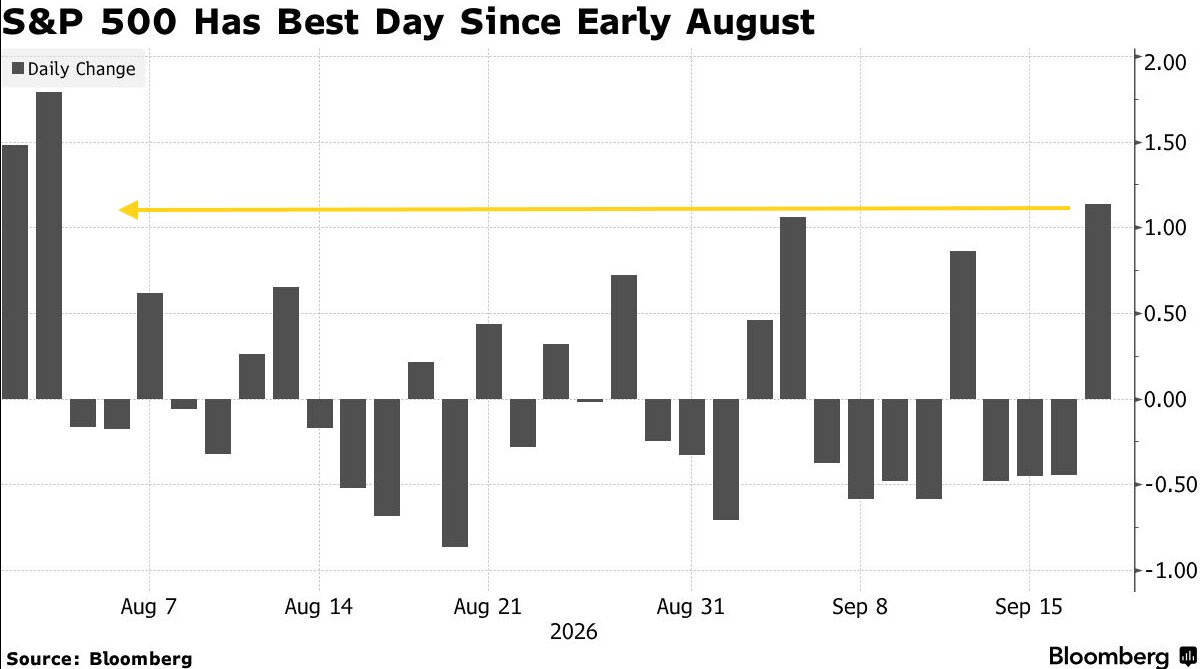
Tech-Led Rally Lifts S&P 500 To Best Day Since Early August
Stocks and bonds rallied together Thursday after having fallen in unison the day before following a hawkish Fed decision, helped by oil prices easing back for a second day.
You've reached your free article limit
You've read 0 of 1 free Pro articles.
Quick Summary
- Stocks and bonds rallied together Thursday after having fallen in unison the day before following a hawkish Fed decision, boosted by oil prices easing back for a second day.
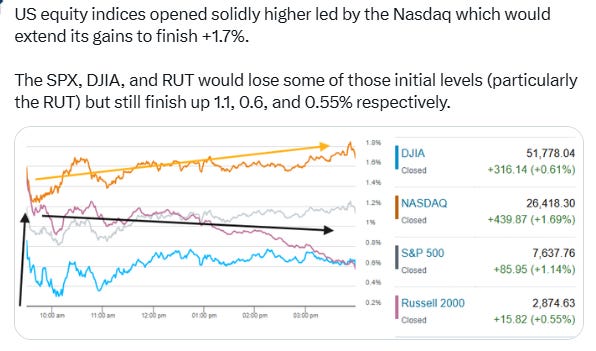
- Indices opened solidly higher, led by the Nasdaq which would extend on those gains as the day progressed ending +1.7%. The S&P 500, Dow Jones Industrial Average, and Russell 2000 would give back some of their early gains (particularly the latter ) but still closed up 1.1%, 0.6%, and 0.55% respectively. All four indexes snapped three-day skids with the S&P 500 and Nasdaq posting their biggest gains since Aug. 4.
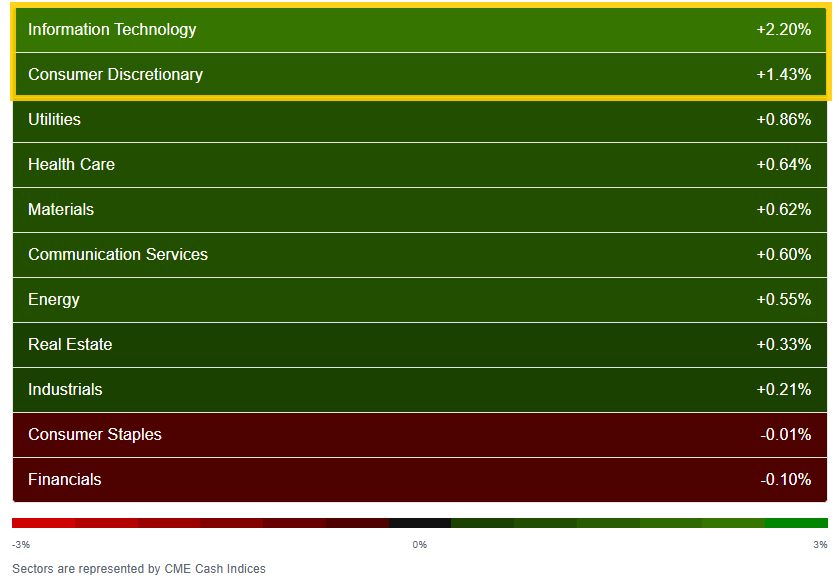
- Breadth flipped with 9 of 11 sectors higher, the first day this week with more than three, led by heavyweight Tech (+2.2%, ~40% of market cap) doing most of the heavy lifting, with Consumer Discretionary the other sector up more than 1%; only Staples and Financials edged lower, each falling -0.1% or less.
- The moves brought the S&P 500 and Nasdaq back to slightly positive on the month (Dow Jones Market Data).
- Relief came from yields and oil: the 10-year dropped more than 7 basis points to 4.93%, snapping an eight-day rising streak, while WTI eased to ~$102 and Brent settled under $105, the first back-to-back losses in those contracts this month.
Market Commentary
Fed:
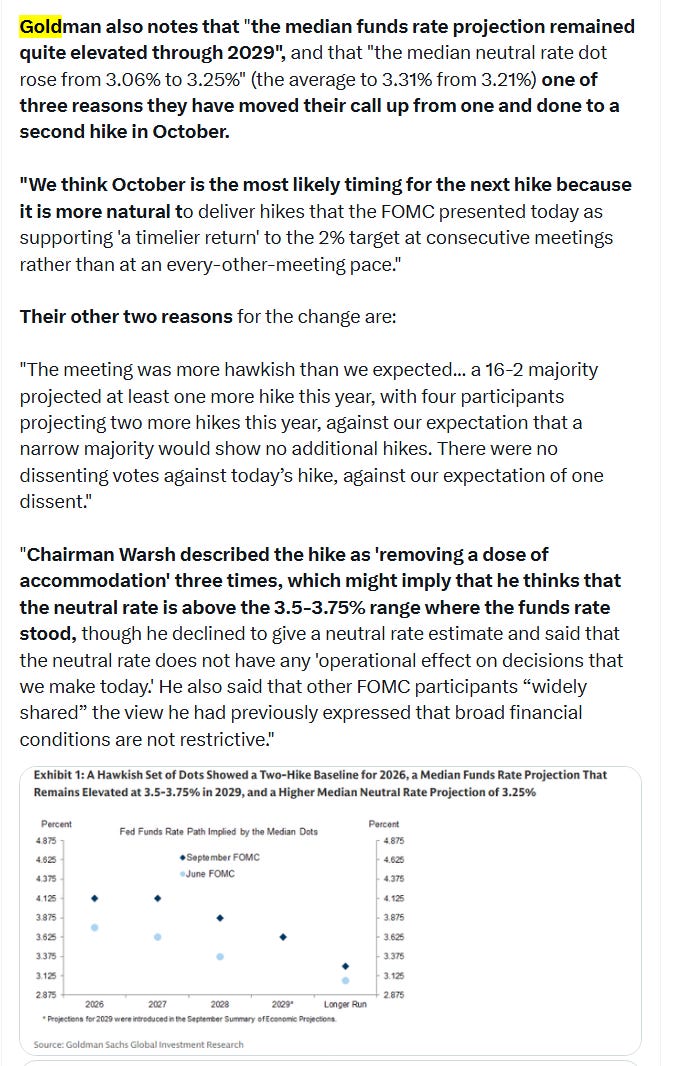
- “Current market expectations for additional rate hikes in 2027 are probably overdone,” said Joachim Klement, a strategist at Panmure Liberum. “We think that the next move in bond yields is probably lower, which in turn should support stock markets.”
- “Yesterday’s announcement went a long way towards reaffirming the Fed’s independent ability to craft monetary policy, and ultimately that should be a positive for financial assets. The burden of proof will ultimately fall upon the future trajectory of inflation, however.” — Cameron Crise, BBG macro strategist.
- “I don’t think Warsh indicated a series of rate hikes,” Kumar said. “The market reaction feels like a repricing to the scenario that the Fed will likely hike, but not deliver three, which are currently priced in.”
- “Ultimately, we expect that the economic data will hold greater sway over the direction of Fed policy,” said Ian Lyngen at BMO Capital Markets. “As investors continue to digest the forward implications of the Fed back in tightening mode, we are increasingly constructive on duration and anticipate that yields will leak lower in the coming weeks.”
Equities:
- “Sentiment has been lifted in part because crude oil has fallen for a second day, easing pressure on bond yields,” said Fawad Razaqzada at Forex.com. “Yesterday, the Fed was quite hawkish, and we saw the kind of reaction it triggered in the foreign-exchange and equity markets as you’d expect.”
- “The market’s reaction could be kind of summed up in one word: relief,” Robert Conzo, CEO at The Wealth Alliance, said of Thursday’s trading action. “I think there is a relief that, ‘Hey the Fed is addressing a sticky inflation problem.’” However, the money manager believes that the market still faces the possibility of “extreme” volatility depending on how the conflict in the Middle East unfolds. “If oil prices remain elevated, price inflation gets translated to retailers and gets embedded in the prices that they’re passing on to consumers,” he said. “if you see oil remain high, you can see that problem get greater and greater and greater, which makes inflation harder and harder and harder to slow down.”
- “Public investors currently do not have visibility on revenue growth and margin dynamics for the largest AI native business in the market,” Sthankiya said. “If both metrics are higher than expected, this should give the market greater conviction that there is a large and durable return on investment in AI capex.”
- Mark Haefele, chief investment officer at UBS Global Wealth Management, said in a Thursday morning note that his team remains “positioned for further equity gains while preparing for near-term volatility.”“If tightening remains measured, credit spreads remain stable, and profits continue to grow, the rally should have scope to broaden across sectors and regions,” he said. “We recommend diversified equity exposure while avoiding excessive concentration in areas that are particularly sensitive to interest rates or rely on a single return driver.”
- Bob Edwards, chief investment officer at Florida-based Edwards Asset Management, said in an emailed note that “now we are past this rate hike, stocks can move on.”“Stocks have the clarity needed from the Federal Reserve to resume their rally as the market’s wall of worry continues,” he said. “The post-Fed stock market declines are an overreaction, and a buyable dip. When stock prices fall without a comparable decline in prospects, that is a classic sign of a buying opportunity. We are encouraging clients to add to their stock positions, and we’ll focus our attention on valuation, revenue growth, balance sheets, and durable cash flows.”
Bonds:
- “We expect interest rates to stabilize at these elevated levels with market already pricing more hikes than projected by the Fed and would be opportunistic in duration adds,” said Olumide Owolabi, senior portfolio manager at Neuberger Berman.
- “For the bond market, this is likely to cast a long shadow rather than create a short-lived storm,” said Hebe Chen, a market analyst at Vantage Global Prime. “The front end now has to price the possibility of further Fed tightening, while the long end is already wrestling with inflation, heavy issuance and fiscal concerns — meaning even when the initial volatility settles, the gravitational pull of higher yields may remain.”
- “The Fed chairman’s message was clear: A booming US economy and above-target inflation require more restrictive policy. That may remain a problem for bonds in the medium-term, despite Thursday’s relief rally aided by lower oil prices.” —Edward Harrison, Macro Strategist, BBG Markets Live.
Stock and Sector Breakdown:
As you might expect sector breadth improved dramatically to 9 of 11 sectors higher (our first day this week with more than three), with two over 1%, importantly led by superheavyweight Tech (~40% of market cap) which finished +2.2% doing a lot of the heavy lifting. Consumer Discretionary was the other. And neither red sector (Staples and Financials) was down much at all both -0.1% or less.
Generac Holdings Inc. (GNRC) +18.3% led all S&P 500 components after agreeing to supply up to $8 billion worth of generators for Amazon.com Inc.’s (AMZN) data centers and issued a warrant for a stake in the company.
Also at the top of the stock leaderboard were a swath of AI-beneficiaries including Super Micro Computer (SMCI) +9.5%, Hewlett Packard Enterprise (HPE) +7.7%, Advanced Micro Devices (AMD) +6.4%, Micron (MU) +5.5%, and Intel (INTC) +7.7%. In news, Nvidia Corp. (NVDA) +2.% Chief Executive Officer Jensen Huang expects to sell twice as many chips in the coming year, fueled by the spread of artificial intelligence across different industries.
In earnings news Lennar (LEN) +1.7% finished higher even as the homebuilder cut its home delivery target for the full year, citing interest-rate pressure and worsening conditions in the housing market, as its revenue and profit fell in the third quarter.
CoreWeave Inc., (CRWV) -4.2% a provider of computing that powers AI systems, finished lower after kicking off a fresh round of fundraising that includes a $3 billion convertible bond issue and a vehicle for potential share sales.
Lockheed Martin’s (LMT) +0.2% CEO said the weapons maker was running ahead of schedule on its plan to more than triple production of sorely needed Patriot missiles.
[Note: chart uses futures prices.]
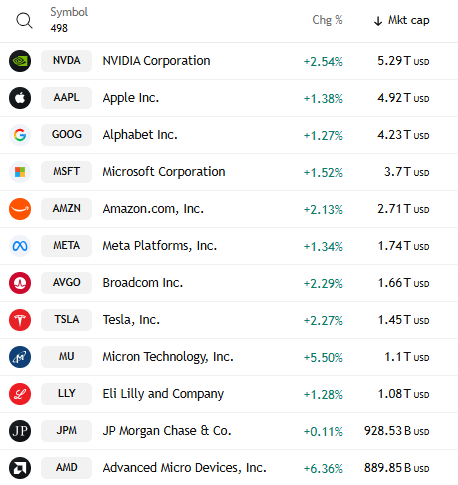
All of the largest 11 components in the SPX were up on the day and all but (JPM) were up over 1% (six up over 2%).
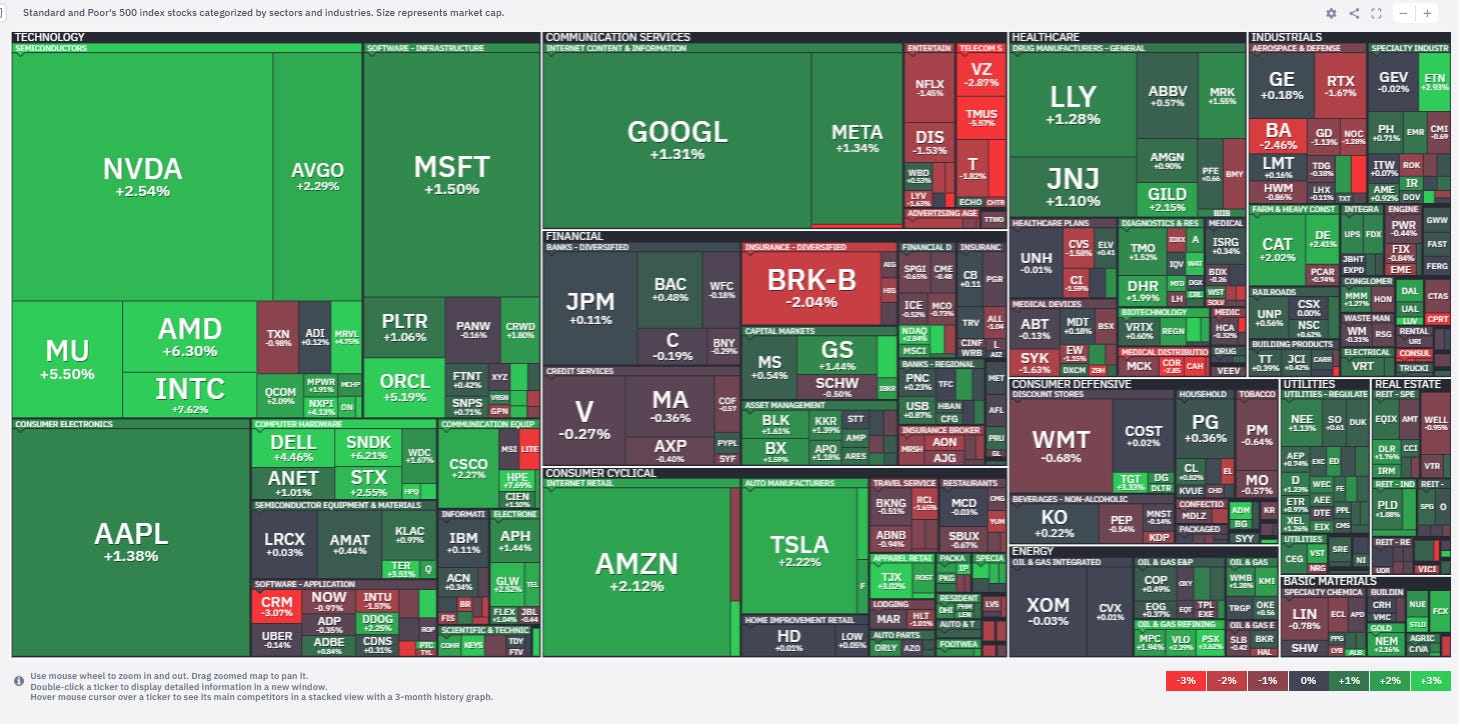
Despite the solid gains, the number of large SPX winners (up over 3%) just at ~35. While up from to 13 Wednesday and ~20 Tuesday, it’s down from ~55 Monday, although the number of large losers (down over 3%) dropped to just 10 from ~55 Wednesday, ~30 Tuesday, ~65 Monday.
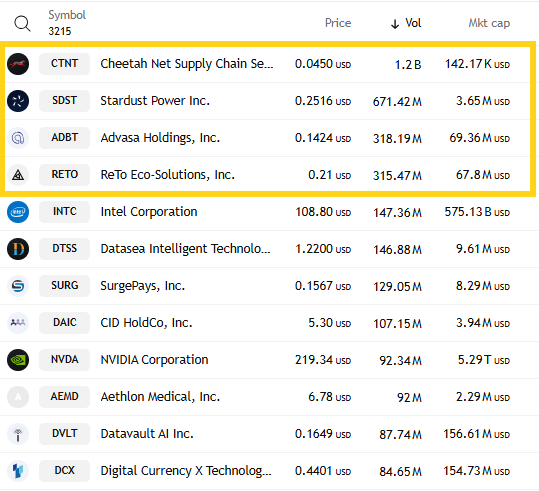
While we had a lot fewer companies trading over 100 million shares on the Nasdaq Thursday (8 vs 16 Wednesday) we did for a second day have one stock trade over 1 billion shares in penny stock (CTNT) followed by three more penny stocks at 671, 318, and 315 million respectively in (SDST), (ADBT), and (RETO), so the speculative juices continue to reignite.
Some stock-specific commentary from TheStreet Pro today:
- Chris Versace – Adding to 2 of the Portfolio’s ETF Holdings
- Stephen Guilfoyle – What Zipline’s Head-Turning $20 Billion Valuation Means for Our Drone Holding & Time to Plug Into Generac After It Generates Big Deal With Amazon?
- James “Rev Shark” DePorre – 8 Stocks With Strong Setups After Fed Interest Rate Decision
- Bob Lang – Chart of the Day: Flat Base For Microsoft Sets Up a Bigger Move
- And if you missed it Jason Meshnick gave a strong argument for the Vanguard Total International Stock Index Fund ($VXUS) which carries a Morningstar Gold rating – Pack Your (Money) Bags. It’s Time to Hit the Road to Greener Markets.
A Look At The Charts
Note on all charts the colored lines are moving averages (the average price over the lookback period (days on the daily charts, weeks on the weekly charts)):
20 = green
50 = purple
100 = blue
200 = brownException is monthly charts where blue is 10-month moving average and brown is 20-month moving average.
MACD = Moving average convergence/divergence line, a measure of momentum that compares longer term and shorter term momentum to gauge if a move is strengthening or weakening. This is probably my favorite individual indicator (it’s also the favorite of Katie Stockton, a very fine technician).
RSI = Relative Strength Index (basically what it sounds like) = measures the strength of the move comparing gains to losses over the given lookback window (I use the standard 14 periods).
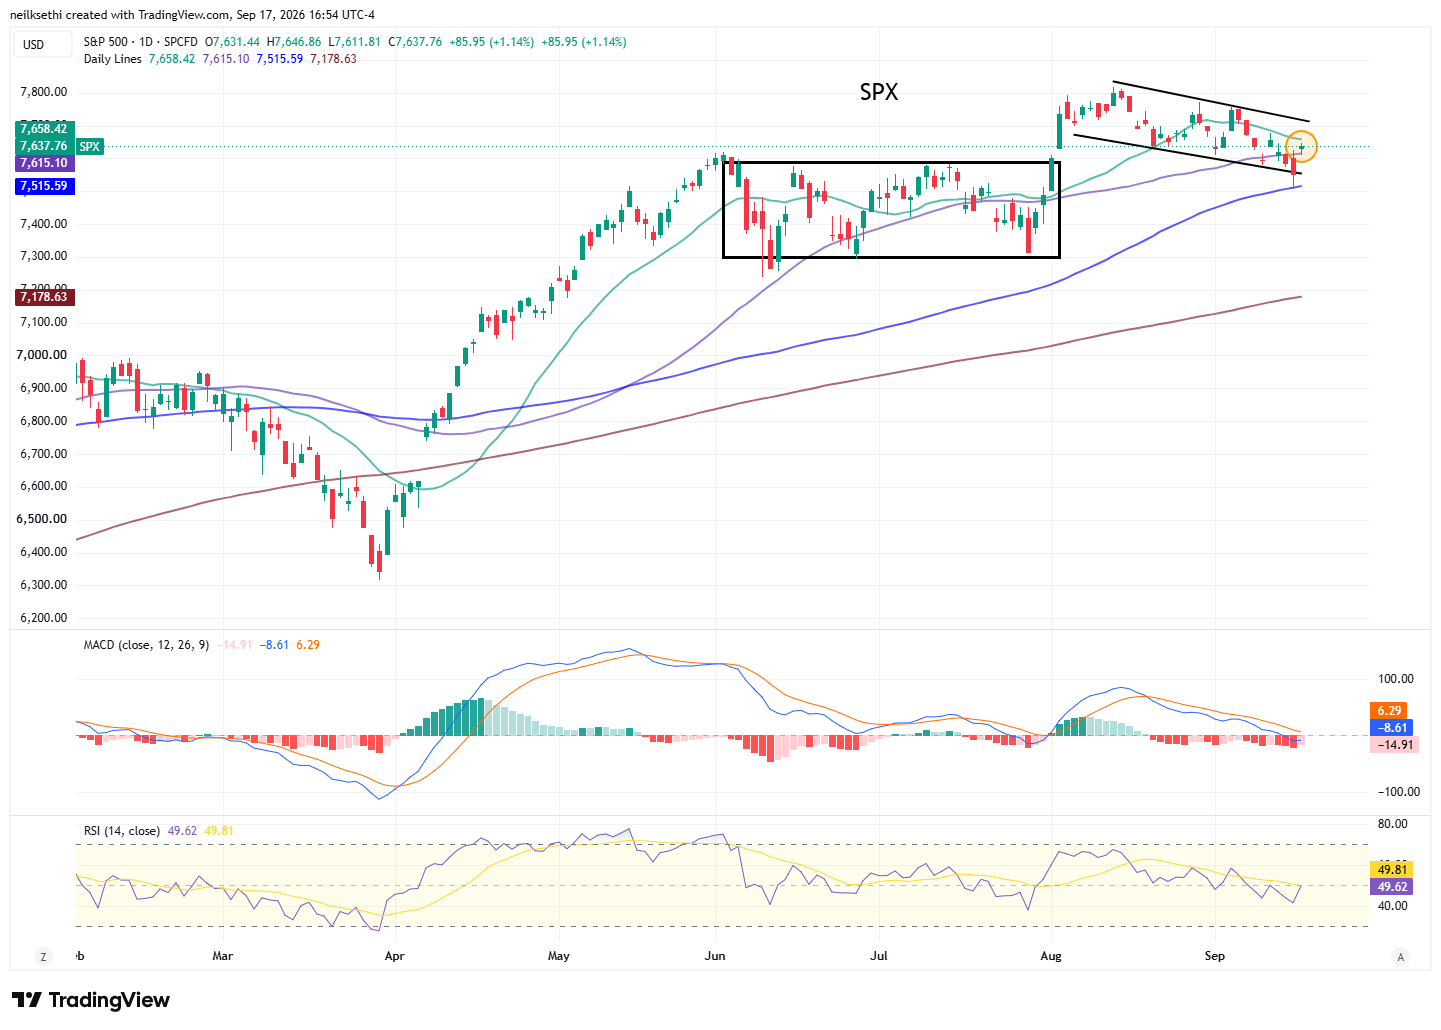
SPX continued its bounce from the 100-DMA now back in its short-term downtrend (or bull flag depending on your viewpoint), back over the 50-DMA. The daily MACD remains in “sell longs” positioning, but the RSI is back near 50. As I mentioned yesterday “I had said a breach of 7575 would see me sell, and I did, but then added some back at the 100-DMA. While I wouldn’t necessarily buy into such a poor technical situation, the thinking is the FOMC decision either acts as a clearing event and we can move higher or we break the 100-DMA, then I sell with a small loss until things stabilize.” Holding for now. Would add on a break above the channel.
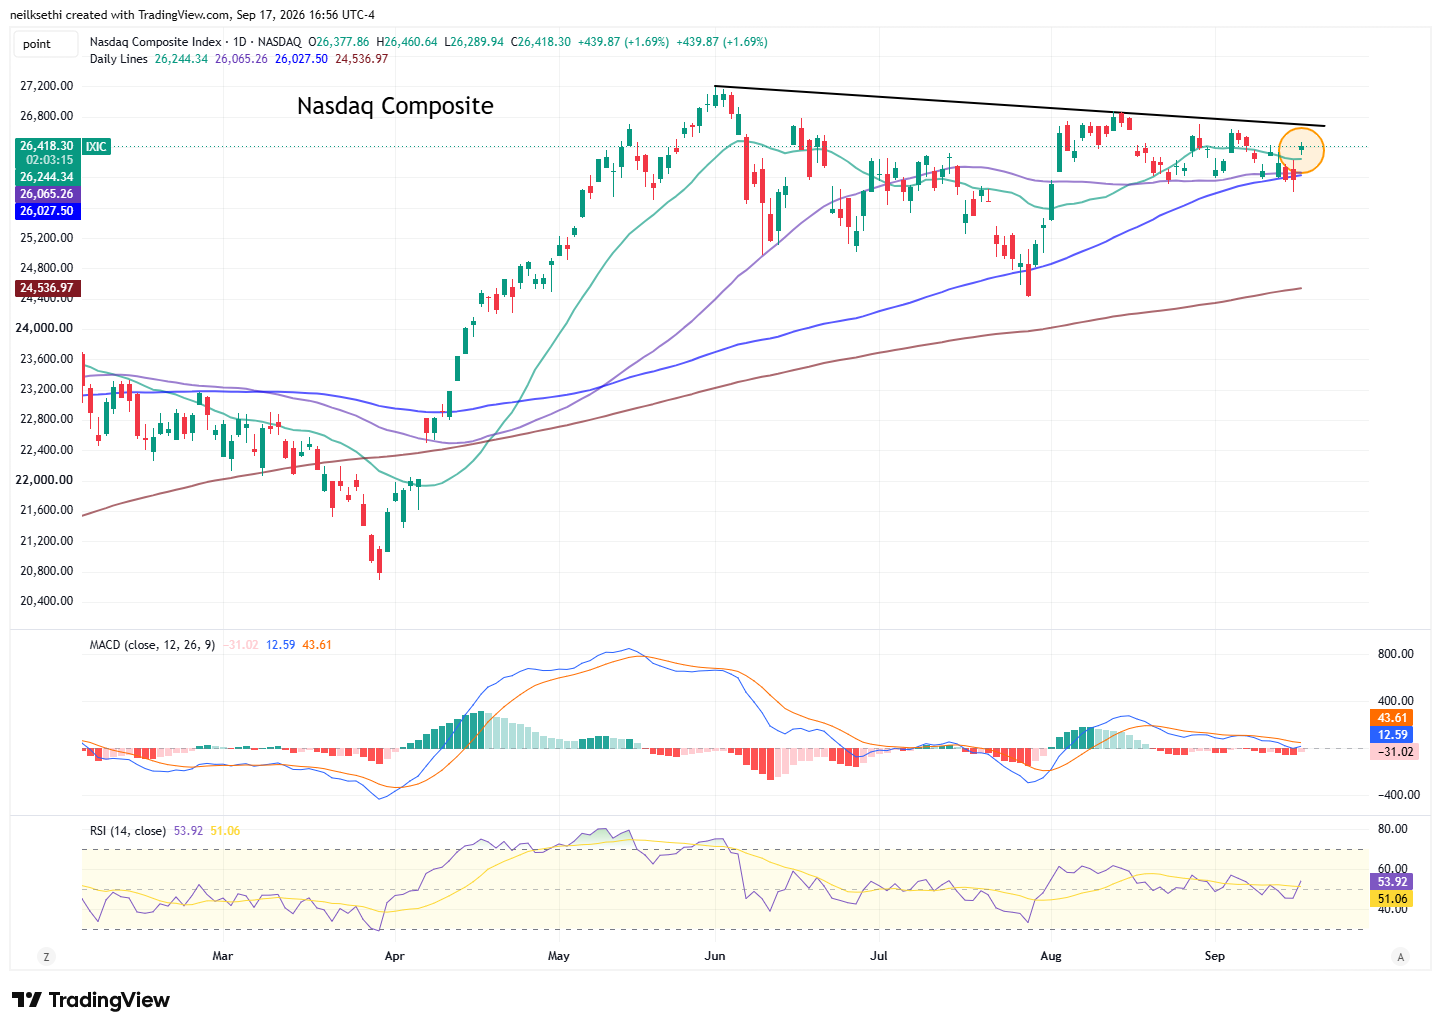
Nasdaq Composite I said Wednesday “I’m a little less positive on but it seems to be hanging in there.”
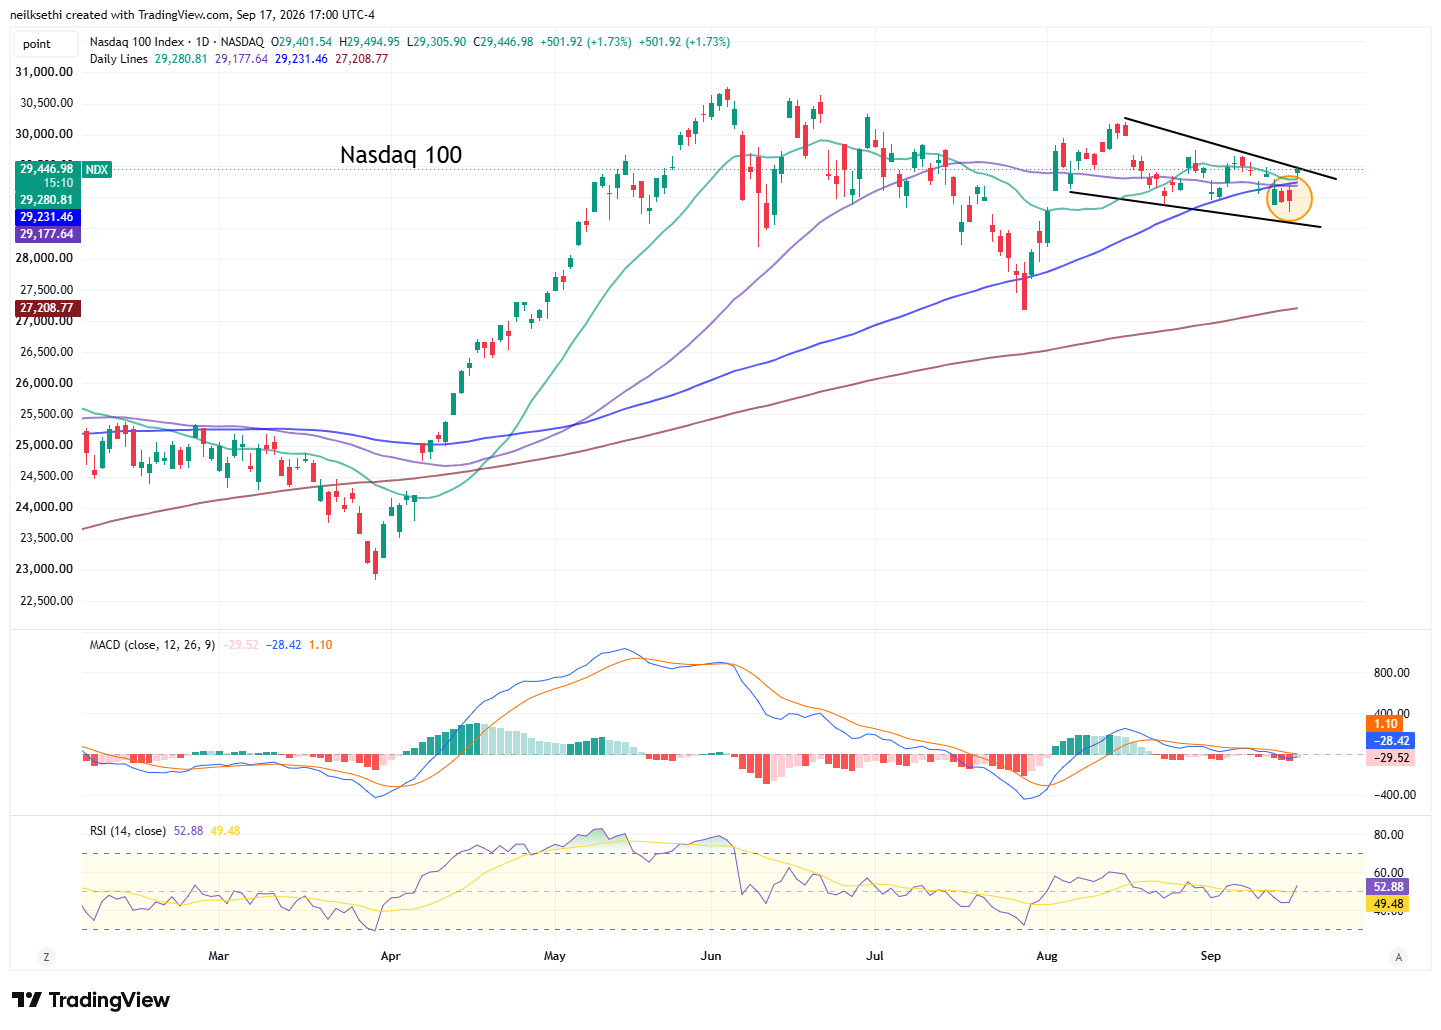
In terms of the Nasdaq-100 (QQQ) I said I “sold half my position. I will buy it back on strength or sell the rest on a break of today’s low.” I did buy back at the open, and might add again on a break above 29,700. Daily MACD is close to flipping positive, and the RSI is over 50.
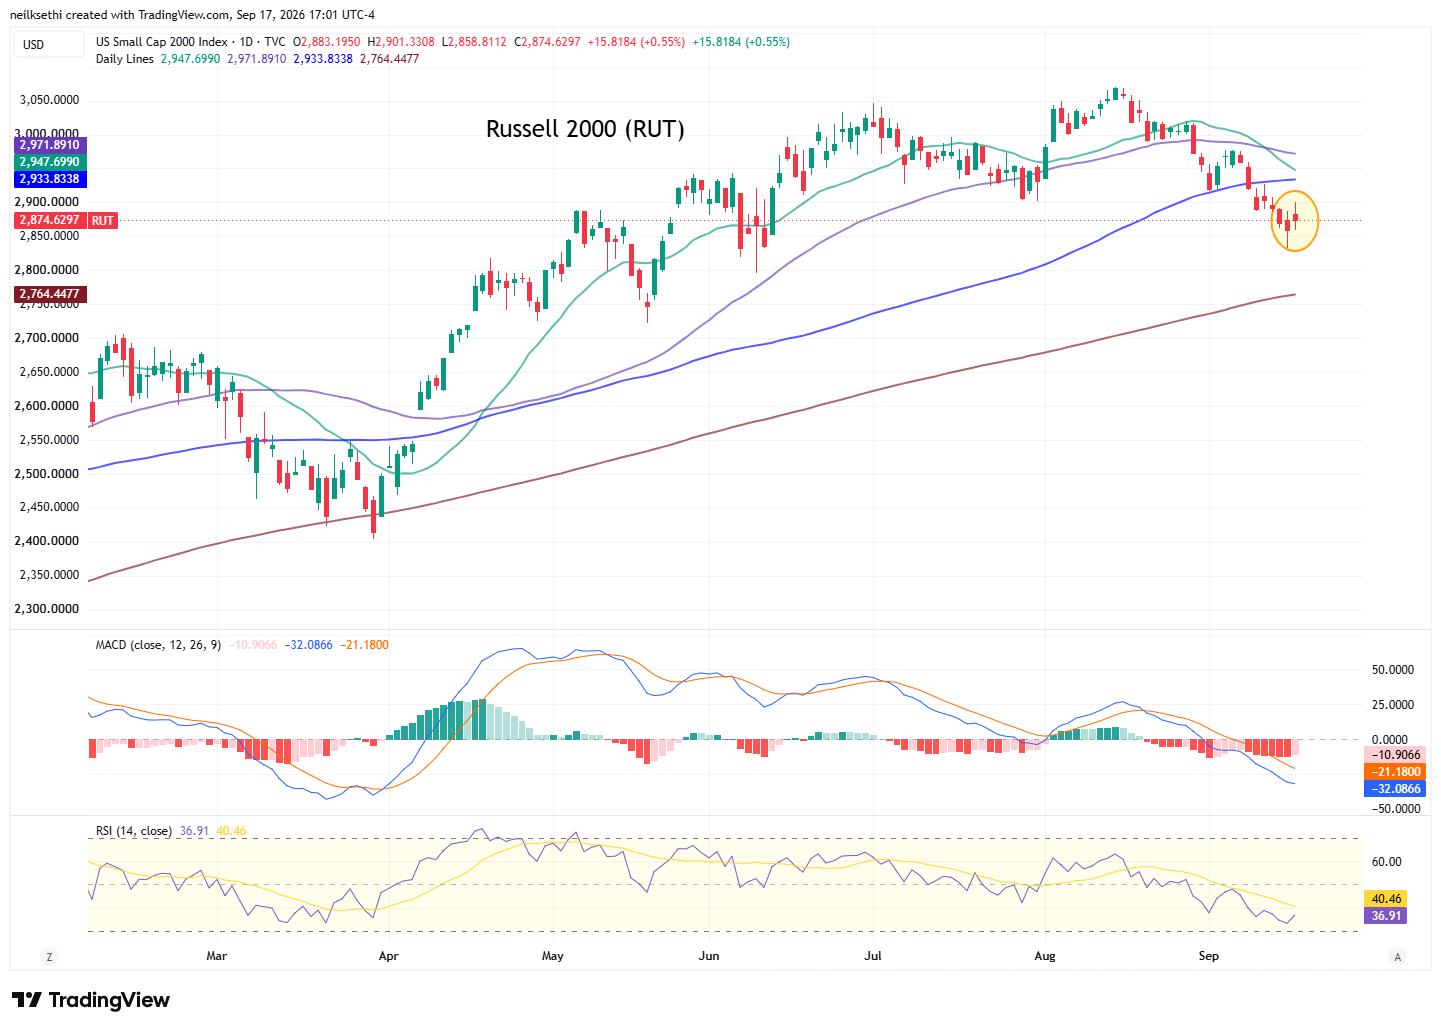
The Russell 2000 (RUT) I said last Wednesday was “much more problematic,” and that remains the case although it at least did bounce (even as it finished with a red candle meaning lower than it opened). As mentioned early last week its MACD is now in “go short” positioning, and its RSI is now below 40. As I said last week “I am not long this index, but … I’d be out until it at least recovered the 100-DMA.” I noted this week “200-DMA is a fair bit away, but that might provide an interesting risk/reward as it served as a floor in March.”
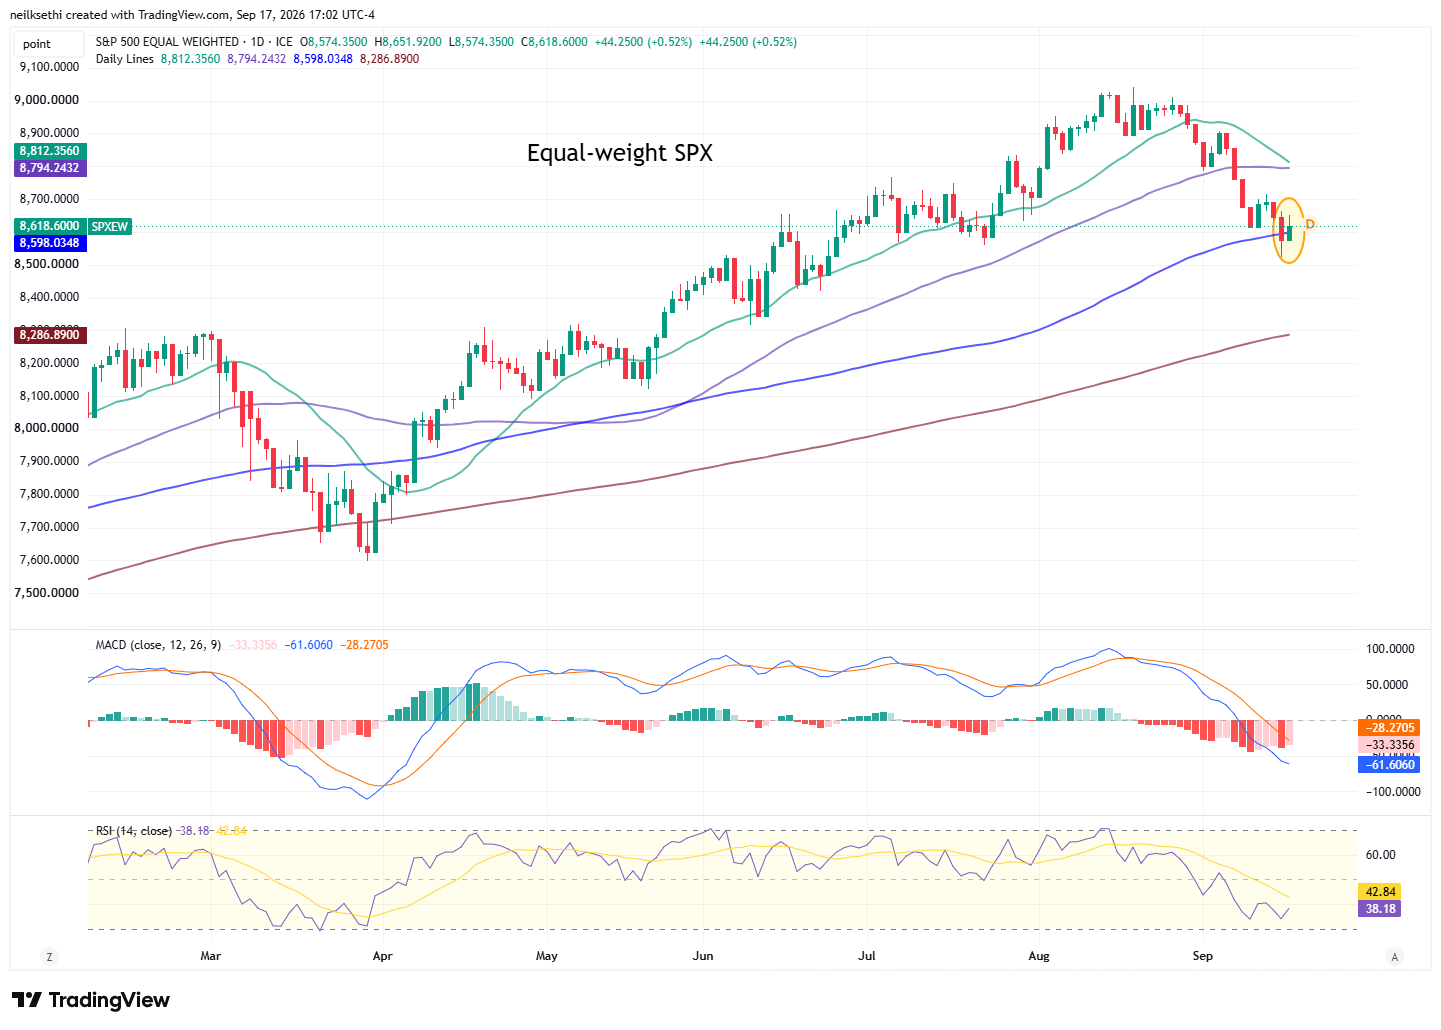
The equal-weighted SPX I said Wednesday is “back to concerning.” I mentioned early last week “I did take off most of my holdings in (RSP) for now. I’ll be looking for a tradeable bottom to form.” It did at least get back above the 100-DMA but daily MACD and RSI are weak.
Treasury yields pulled back across the curve with the largest move at the 10-year duration:
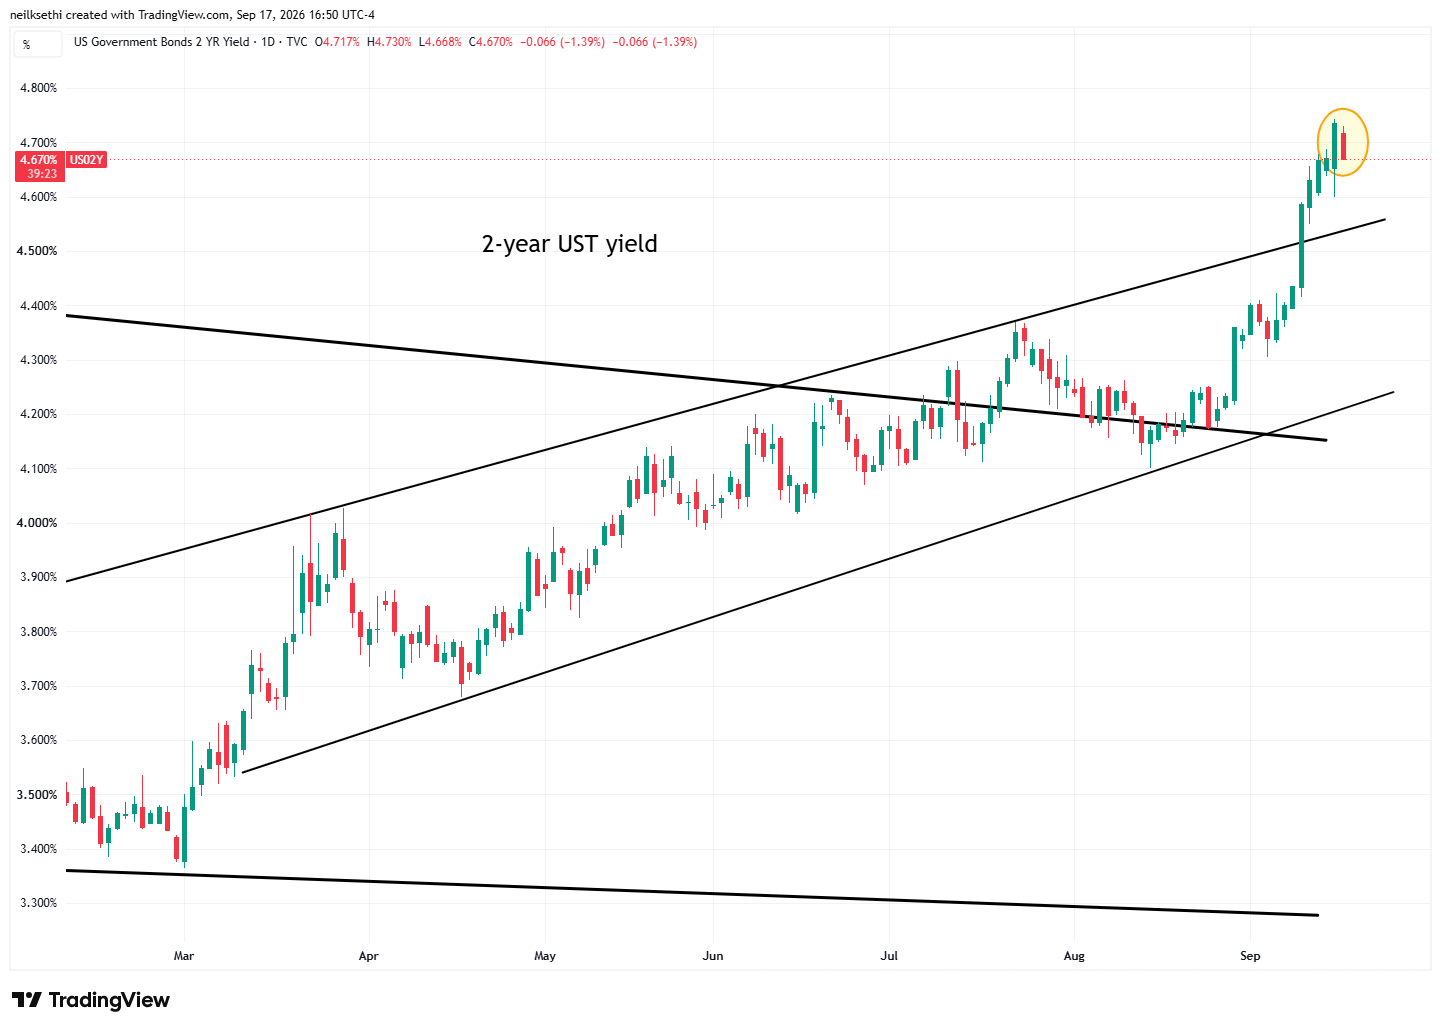
The 2-year Treasury yield gave back Wednesday’s increase ending at 4.67%, down seven basis points from the highest close since July 2024. I had mentioned I would pick some up and did so yesterday after the close.
It is still ~88 basis points above the Effective Fed Funds rate, so still yelling for rate hikes.
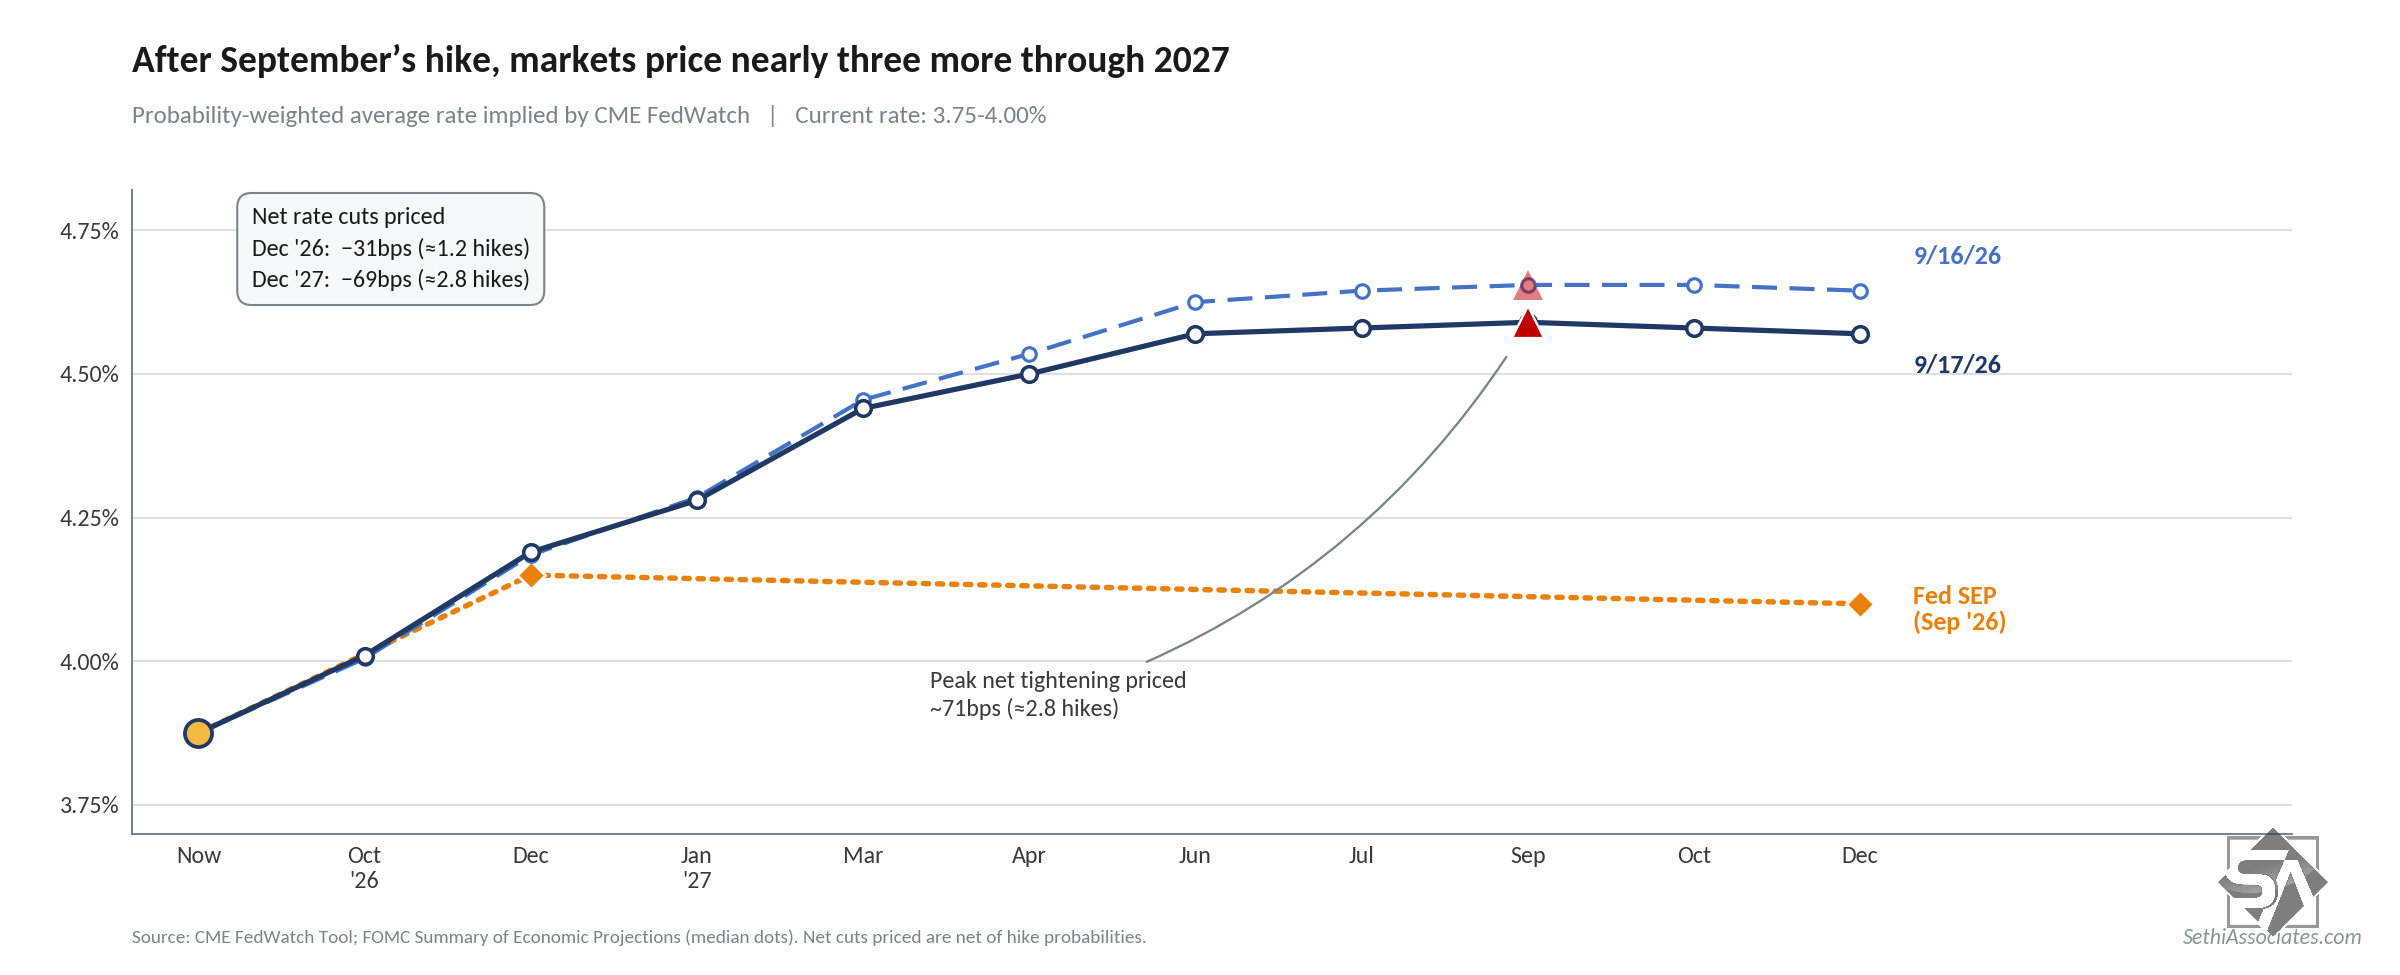
In terms of FOMC rate hike expectations from CME’s Fedwatch tool, chances of an October increase firmed to better than 50/50 but interestingly eased down the line with now just ~70 basis points of additional tightening priced in through next year down from closer to 80 Wednesday.
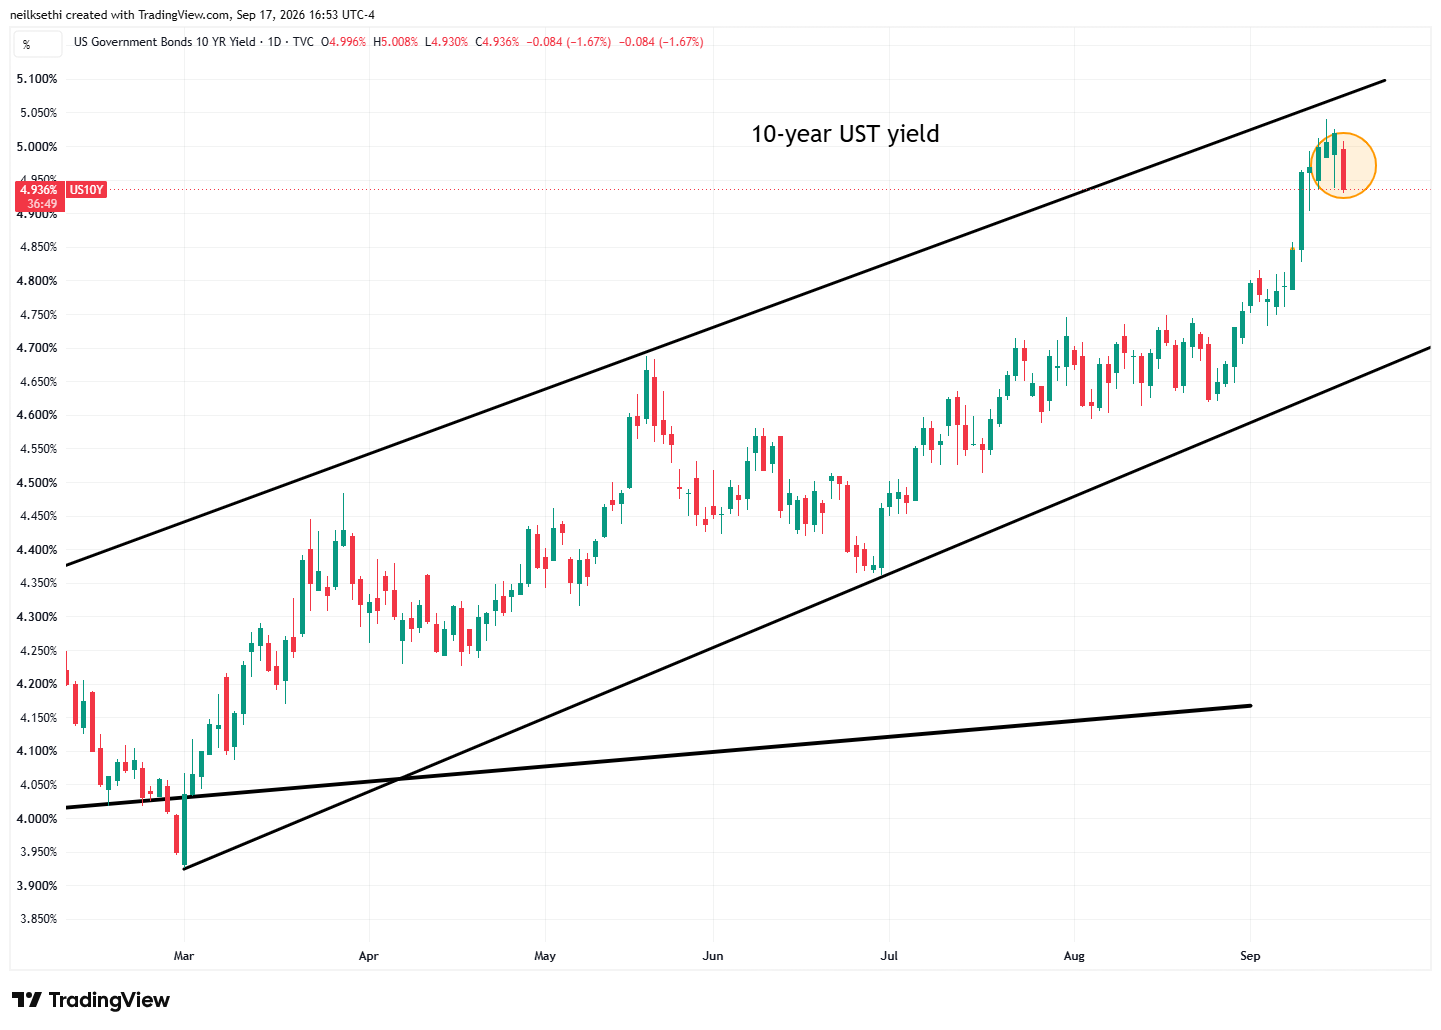
10-year yields as noted saw the biggest pullback, eight basis points to 4.94% down from the highest close since 2007 Wednesday.
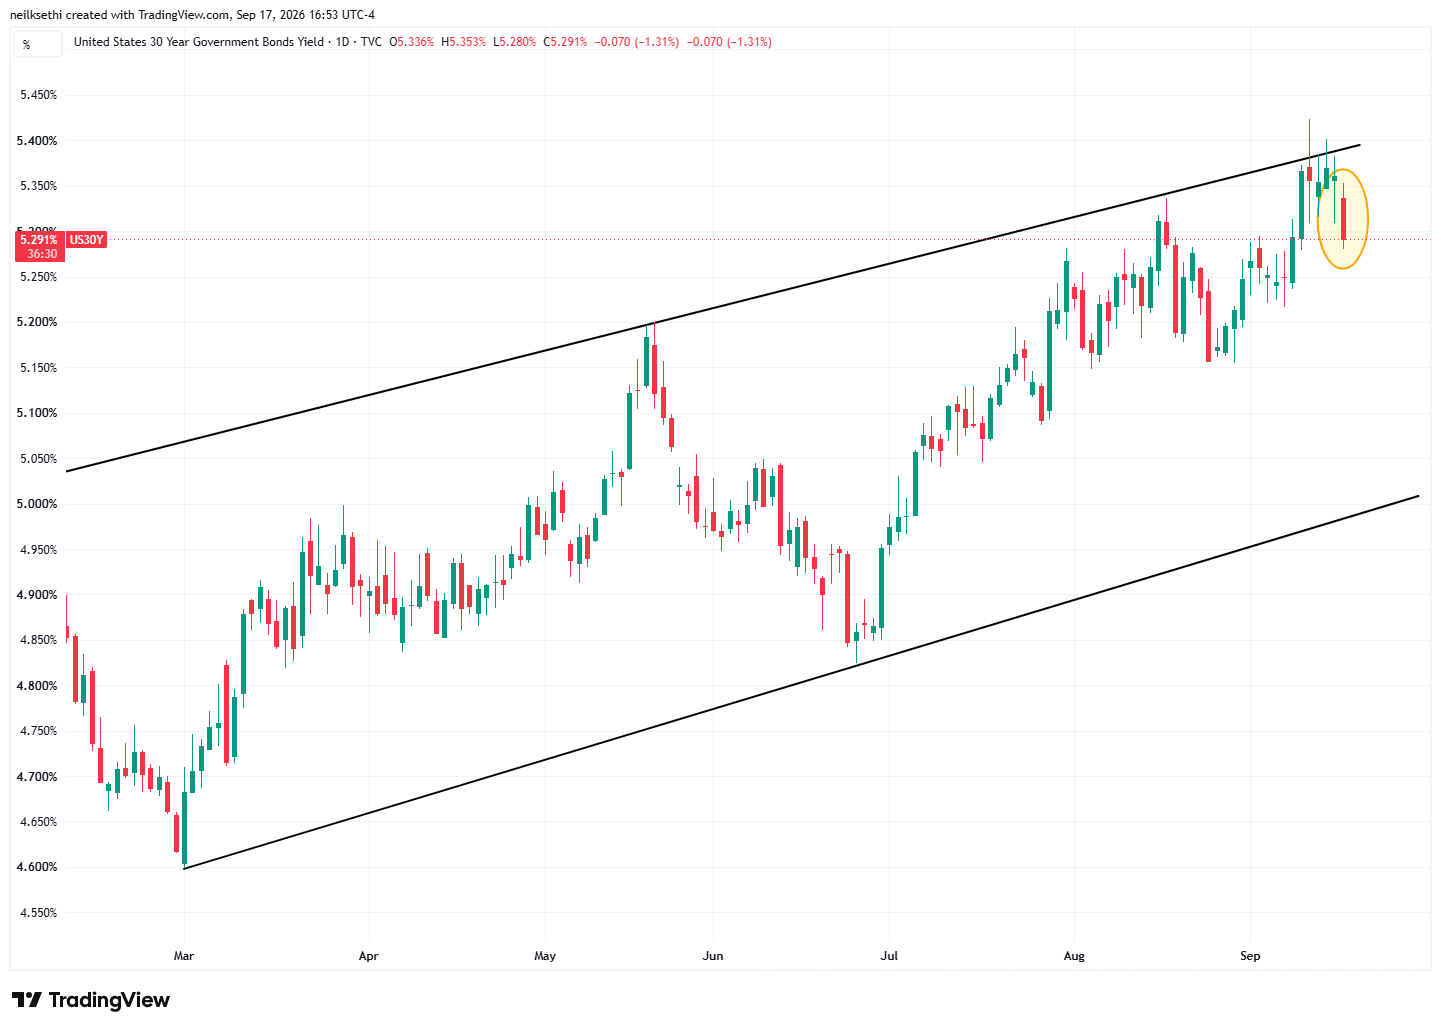
30-year yields down seven basis points to 5.29%, a one-week low.
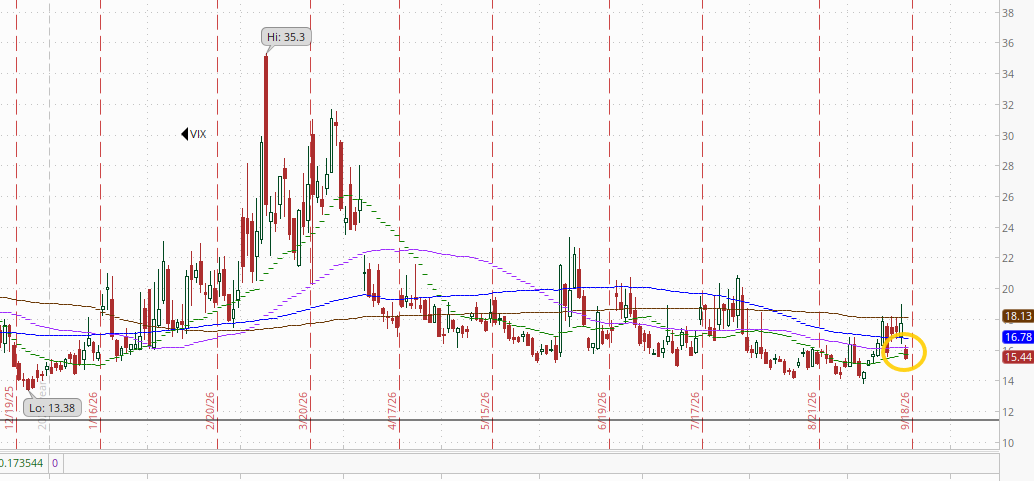
VIX eased back to the lows of the week at 15.4. That’s consistent with ~0.96% average daily moves in the SPX over the next 30 days.
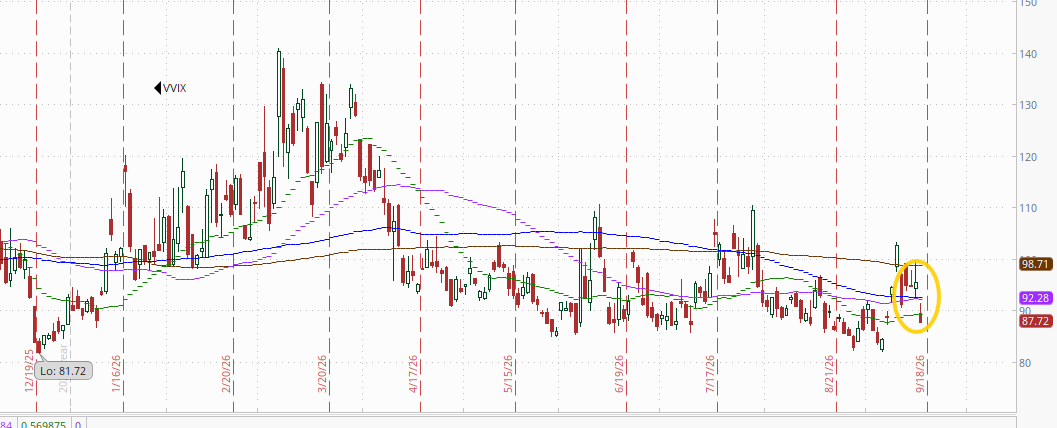
The VVIX (VIX of the VIX) also eased back to 87.7, now surprisingly not that far from the lows of the year.
The current level is consistent with “moderate” daily moves in the VIX over the next 30 days (historically, normal is 80-100). Above 100 is the level flagged by Charlie McElligott as indicating higher stress.
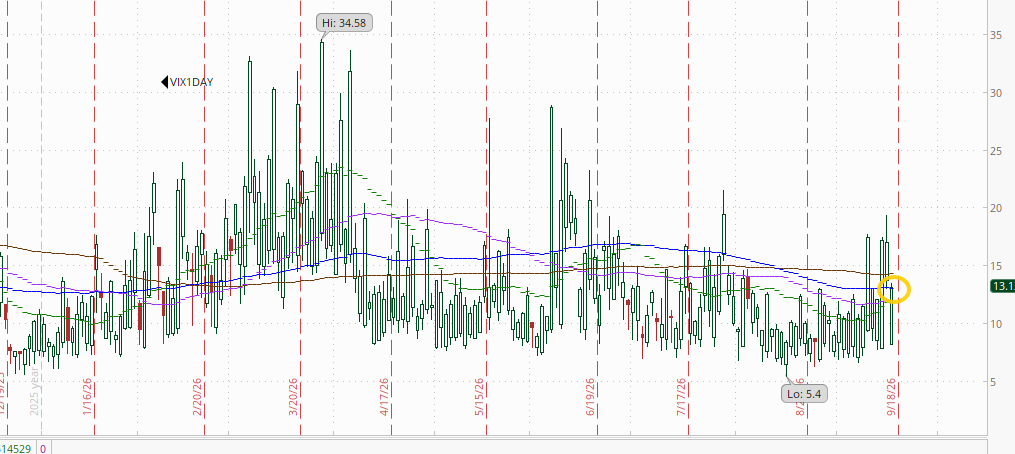
The 1-day VIX eased back, but unlike the VIX or VVIX, remains more elevated than what we saw in August and the first half of September at 13.1. The current reading isconsistent with a move of 0.83% in the SPX next session.
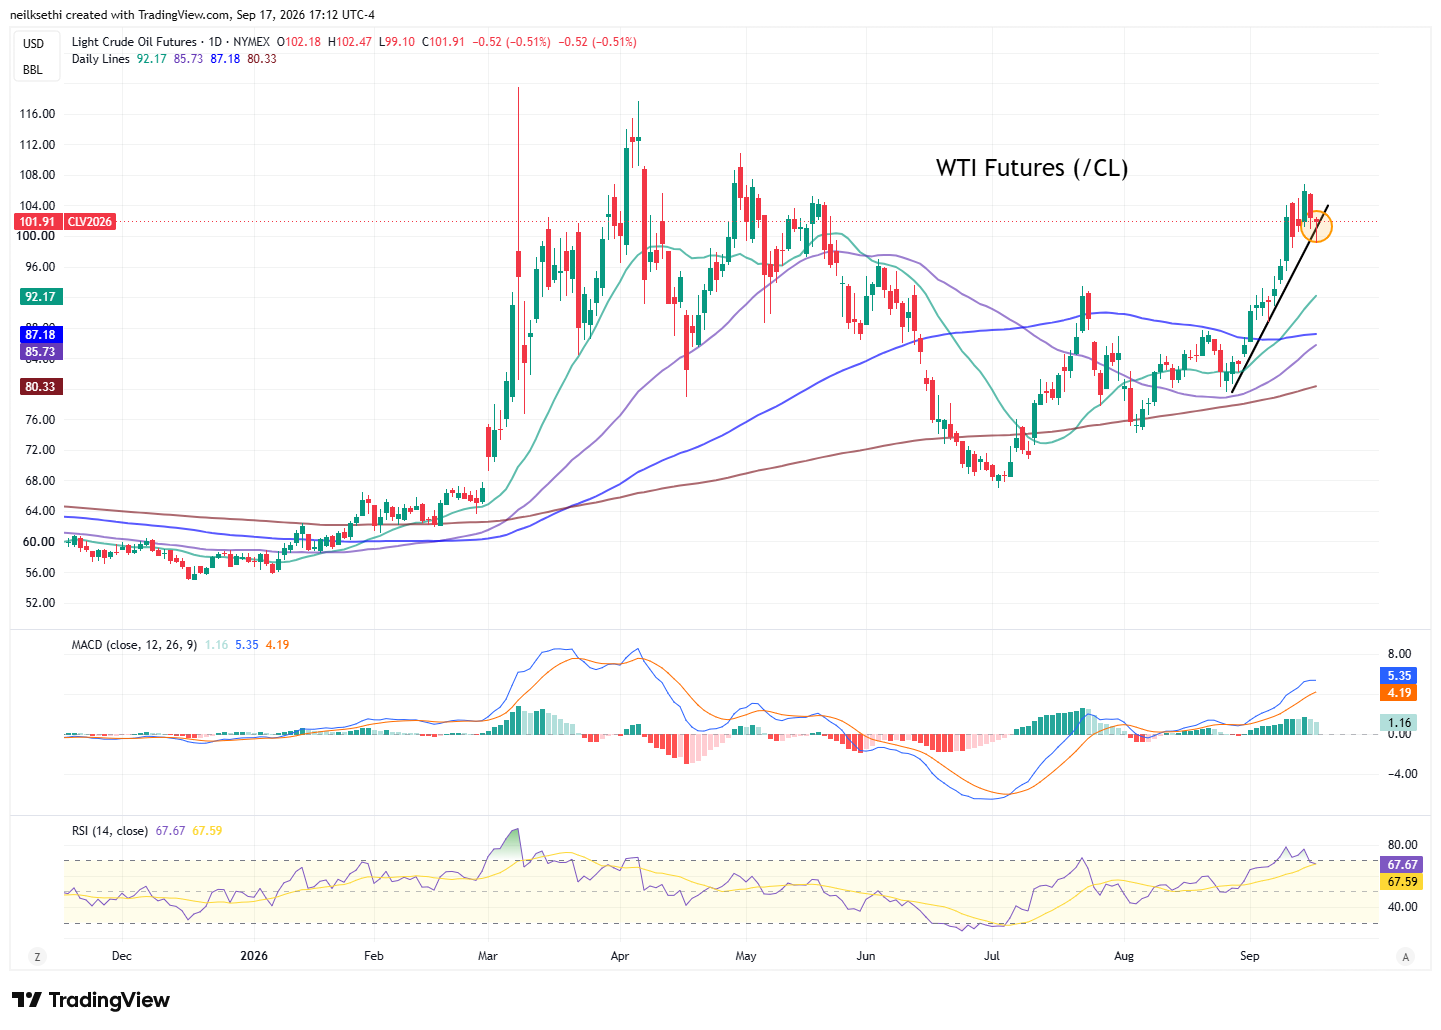
WTI futures (/CL) cut back early losses to end down just a half percent just holding for now its uptrend.
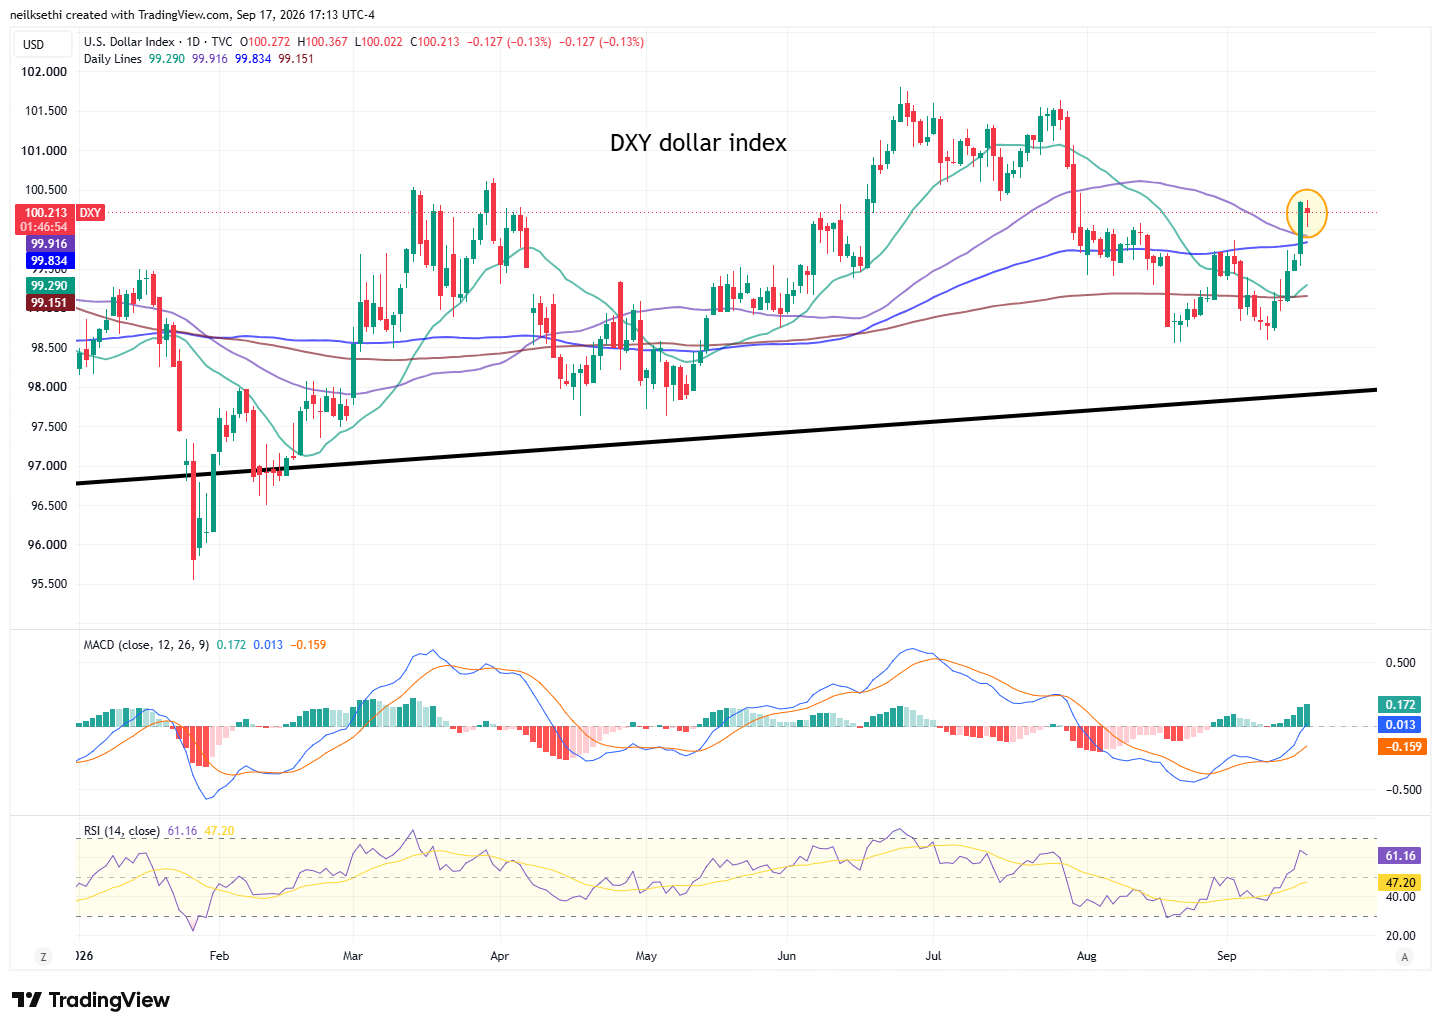
The DXY dollar index (which is fixed weighted with a heavy (57%) weighting vs the euro), eased back with bond yields.
While the move Wednesday “opens up a run back up to the highs of the year,” as I mentioned then, seems to have stalled out here. The daily MACD remains positive and the RSI is above 60 so still has strong technical support.
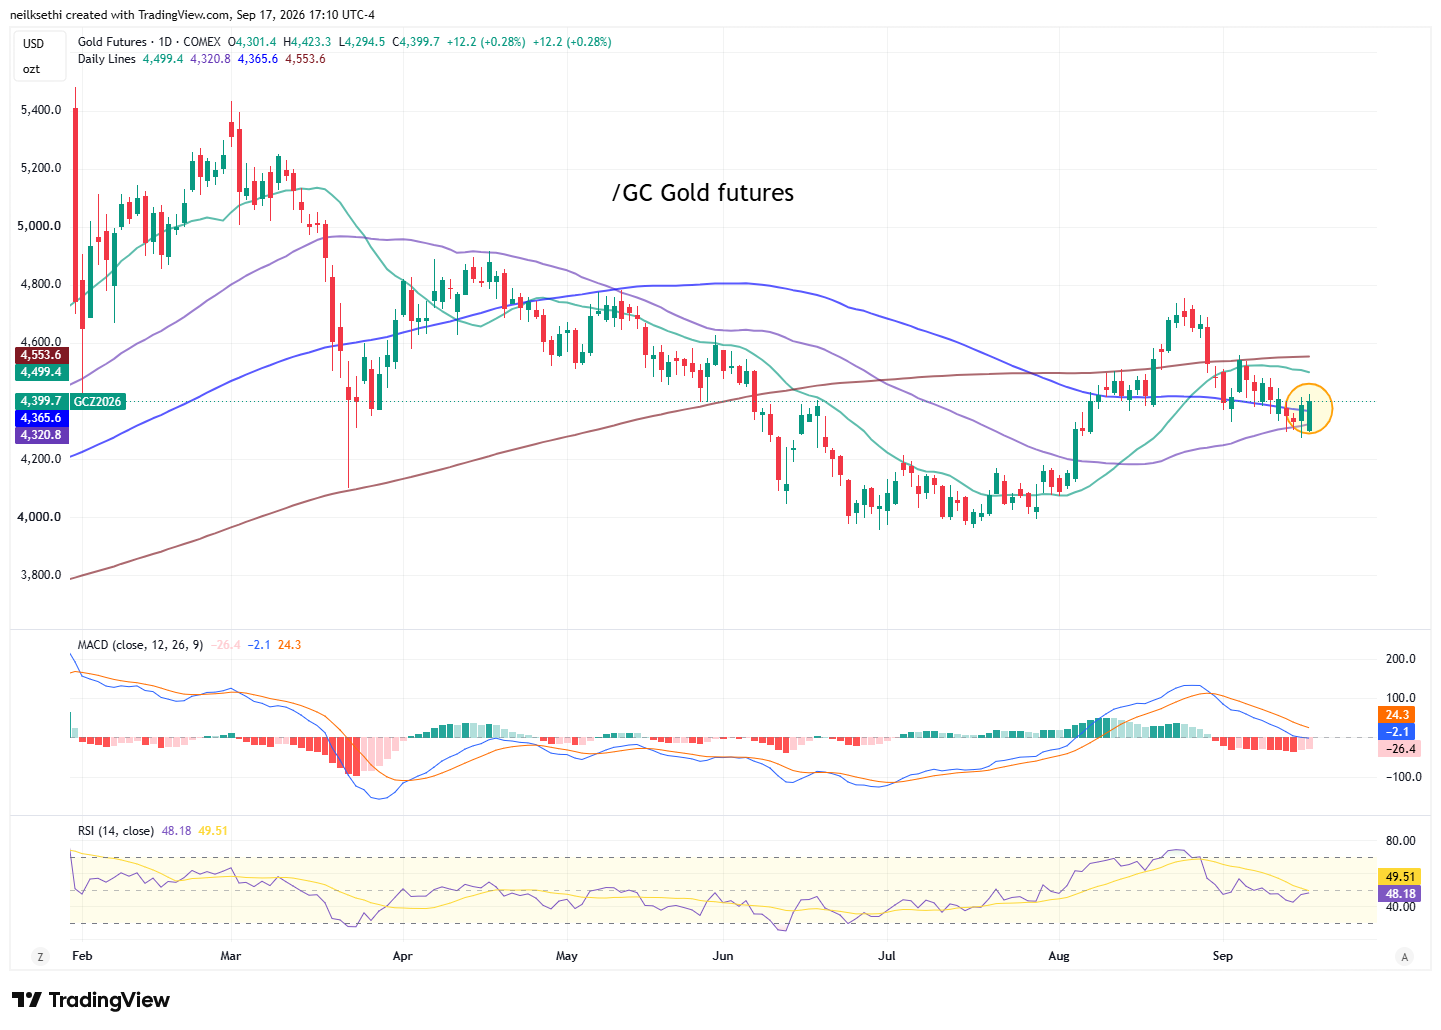
Gold futures (/GC) continued their bounce moving over their 100-DMA. The daily MACD remains negative and the RSI is under 50, so I’m still holding off for now. As I said Tuesday though “if it can continue to hold here and the technicals firm up, I may take a shot.”
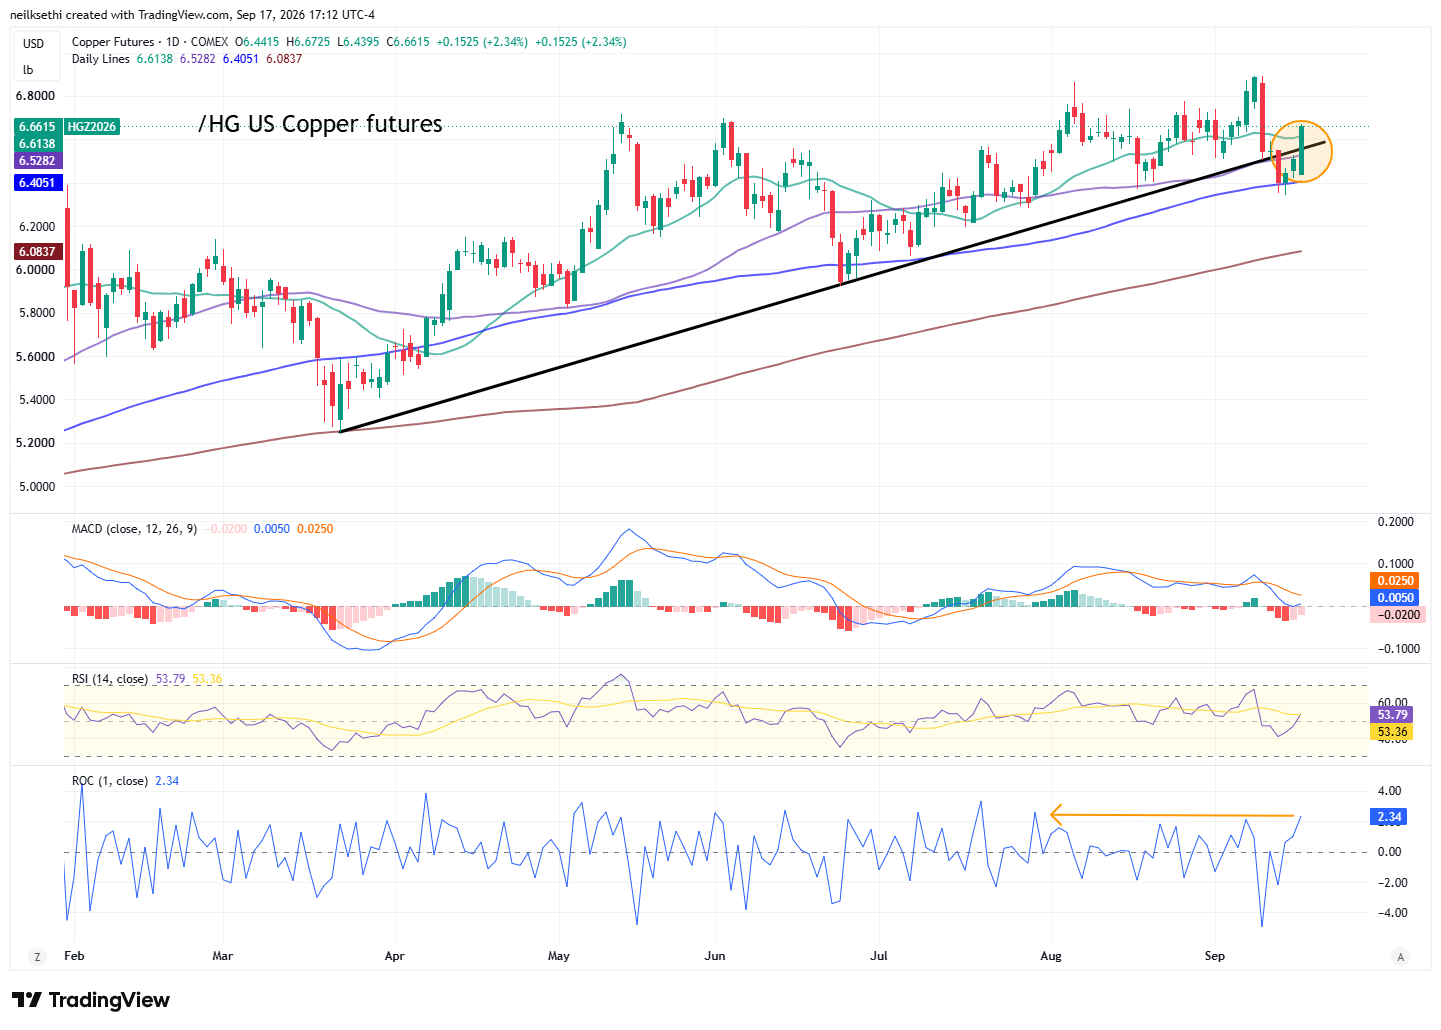
US copper futures (/HG) got a third day of bounce with the best day but now to the underside of support turned resistance. I’ll wait until it gets back over the 50-DMA and trendline before adding back what I took off.
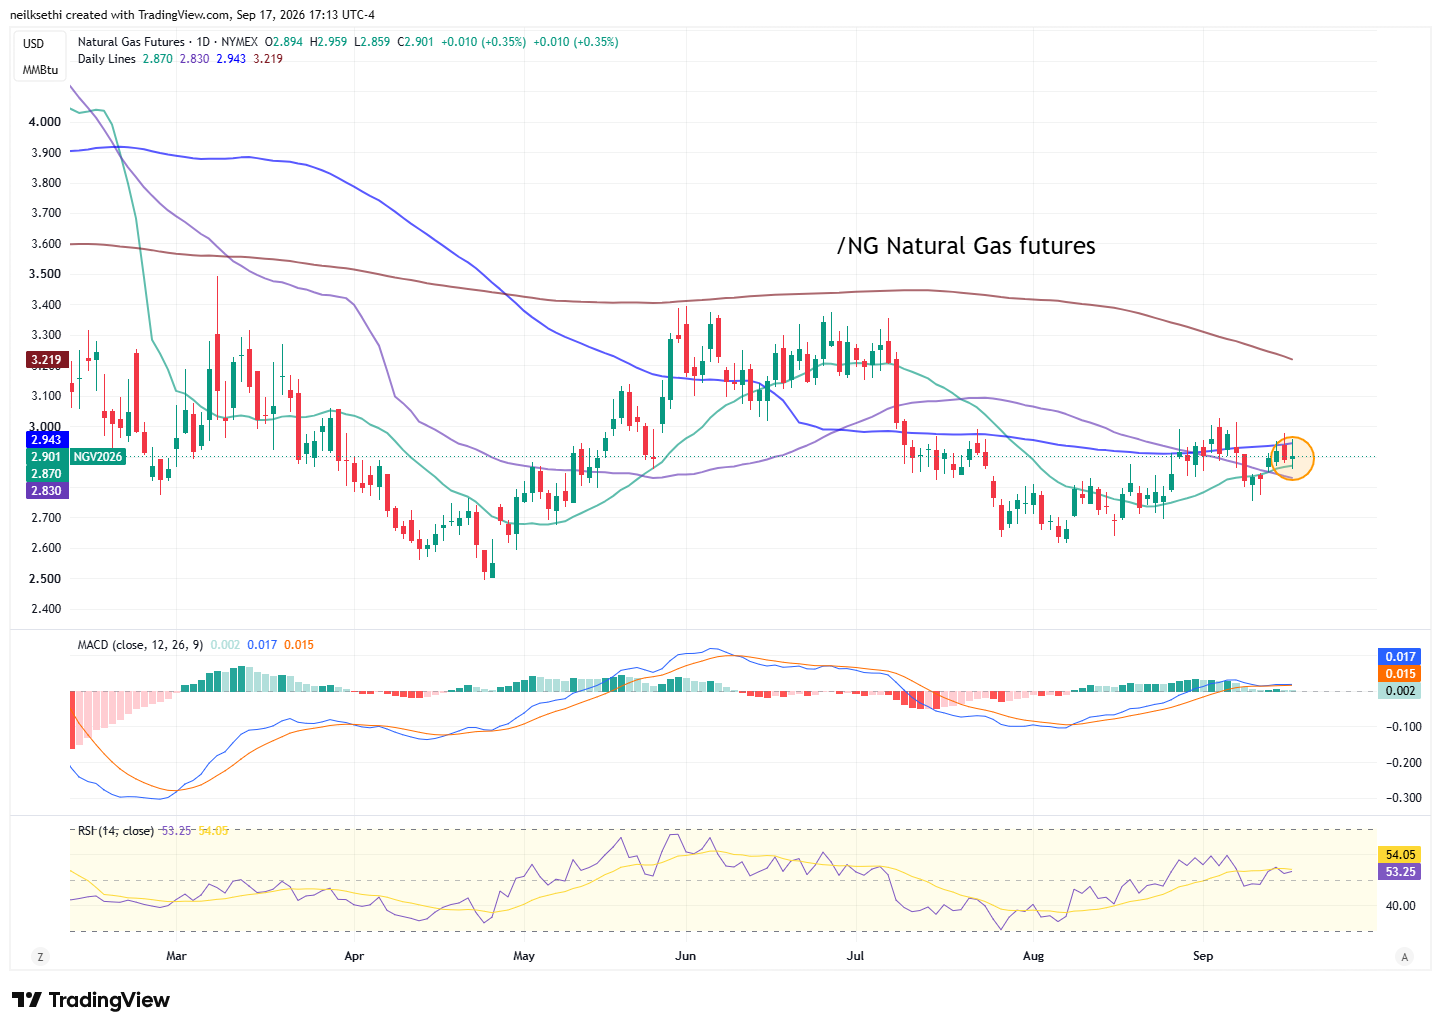
US natural gas futures (/NG) as noted last week “now back to trading in their range since the start of July.”
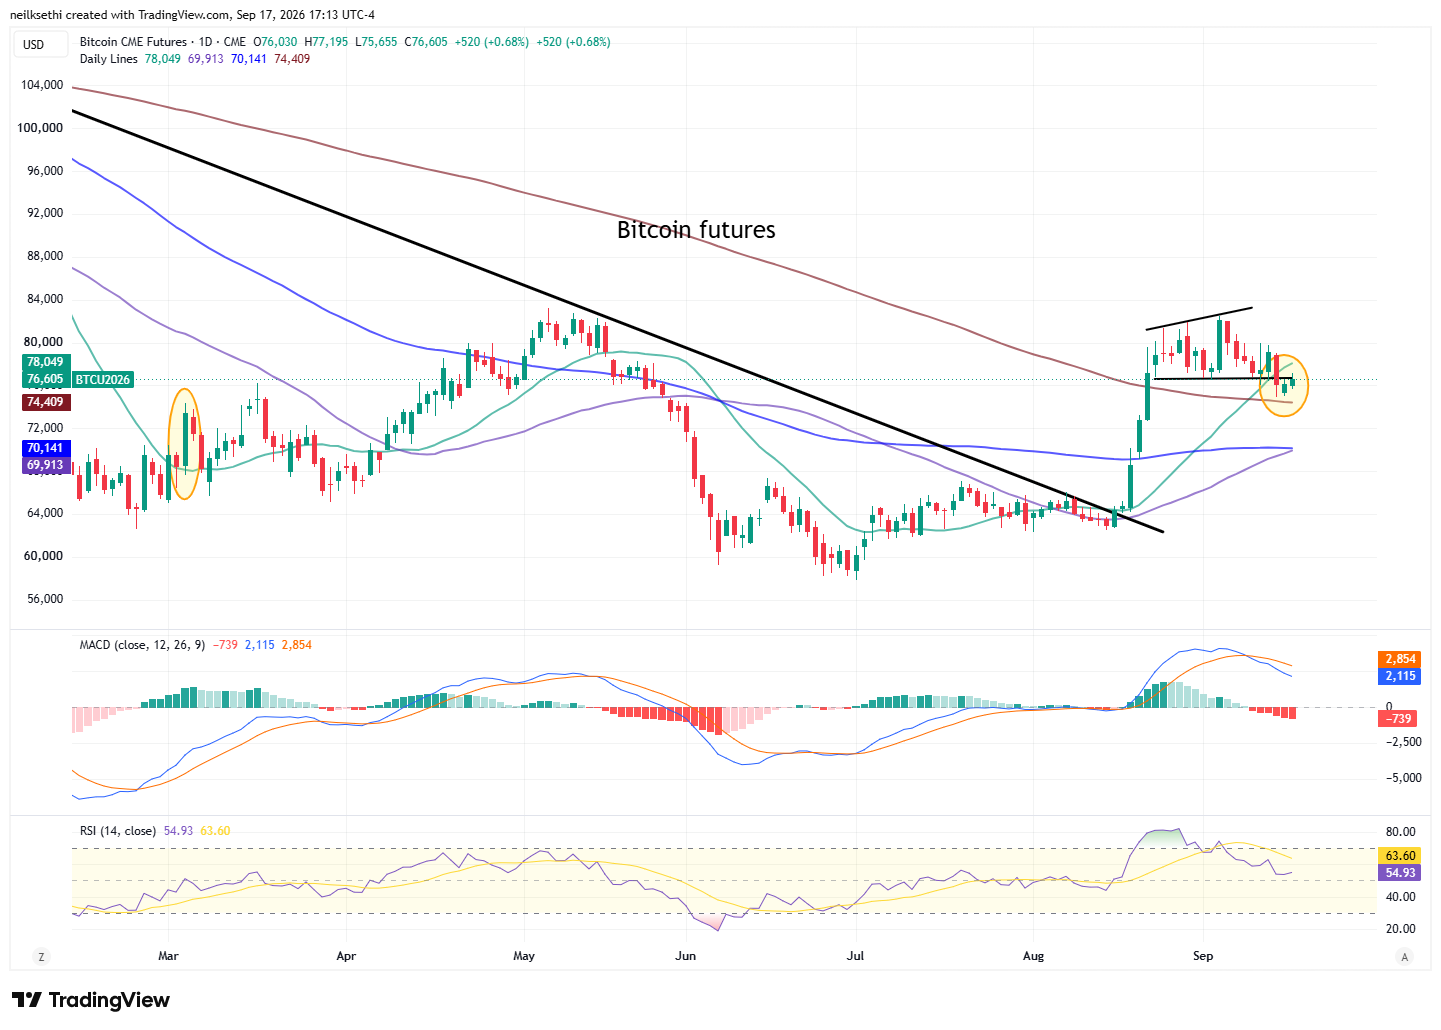
Bitcoin futures edged higher. As I noted Tuesday “I had said I would sell if they broke the bottom of the bull flag, but they seemed to find support at the 200-DMA, so I trimmed a little but kept most of the position to see if they can regather strength. Daily technicals are deteriorating though so it won’t take much to convince me to exit and wait for a better reentry spot.”
More From TheStreet Pro:
- James “Rev Shark” DePorre – Calm Action Attracts Investors as Fed Fears Subside
- Peter Tchir – After the Fed, Let’s Return to Regularly Scheduled Programming
- Chris Versace – VIDEO: Fed, Oil and AI Are the Key Market Forces
- Alex Frew McMillan – Fed Not Alone as Asia Braces Itself for Higher Rates
- Ed Ponsi – Diesel Crisis: Stalking Amazon, Selling Hunt and Warsh’s Fresh Approach
And From Me If You Missed Them:
Miscellaneous:
Wrap-Up – The Market Again Bends but Doesn’t Break
I noted yesterday:
while we did get the clearing event today, it seems markets are still not quite certain of what to make of it. We’re three years removed from the last hiking cycle, and this will be a much less aggressive affair than that one, so it’s really been since before the pandemic that markets have had to navigate something like this. It will take more than a day or two for them to find their feet.
Most disappointingly, despite Warsh’s best efforts, long term yields still did not seem satisfied (at least not enough to ease back). There’s not much more the Fed can do outside of actually buying the long end, so it will be up to the administration and market participants to decide where long-end yields should settle out. Personally, I have been incrementally adding, but there are many who wouldn’t touch long-term yields with a 10-foot pole seeing us in a new secular bull market for yields (bear market for bonds).
Regardless, markets overall are clearly still jumpy as judged by no softening in the 1-Day VIX, and we remain in that “fragile” situation not far from key support levels. Perhaps traders will have a more positive outlook after getting a chance to digest things. We’ll find out soon enough.
And we find out today that, in fact, after having the night to “sleep on it” they decided things weren’t all that bad, particularly with the AI trade that has been gathering momentum all week. But the gains were broad, even if not as broad as I would like, and it moved indices away from those important support levels I have been flagging all week.
As they say, “one day does not make a trend,” so we’ll see where traders take us in coming days. While the calendar is light, tomorrow might not be the greatest day to take a signal from though with options expiration, but we’ll see what we get.
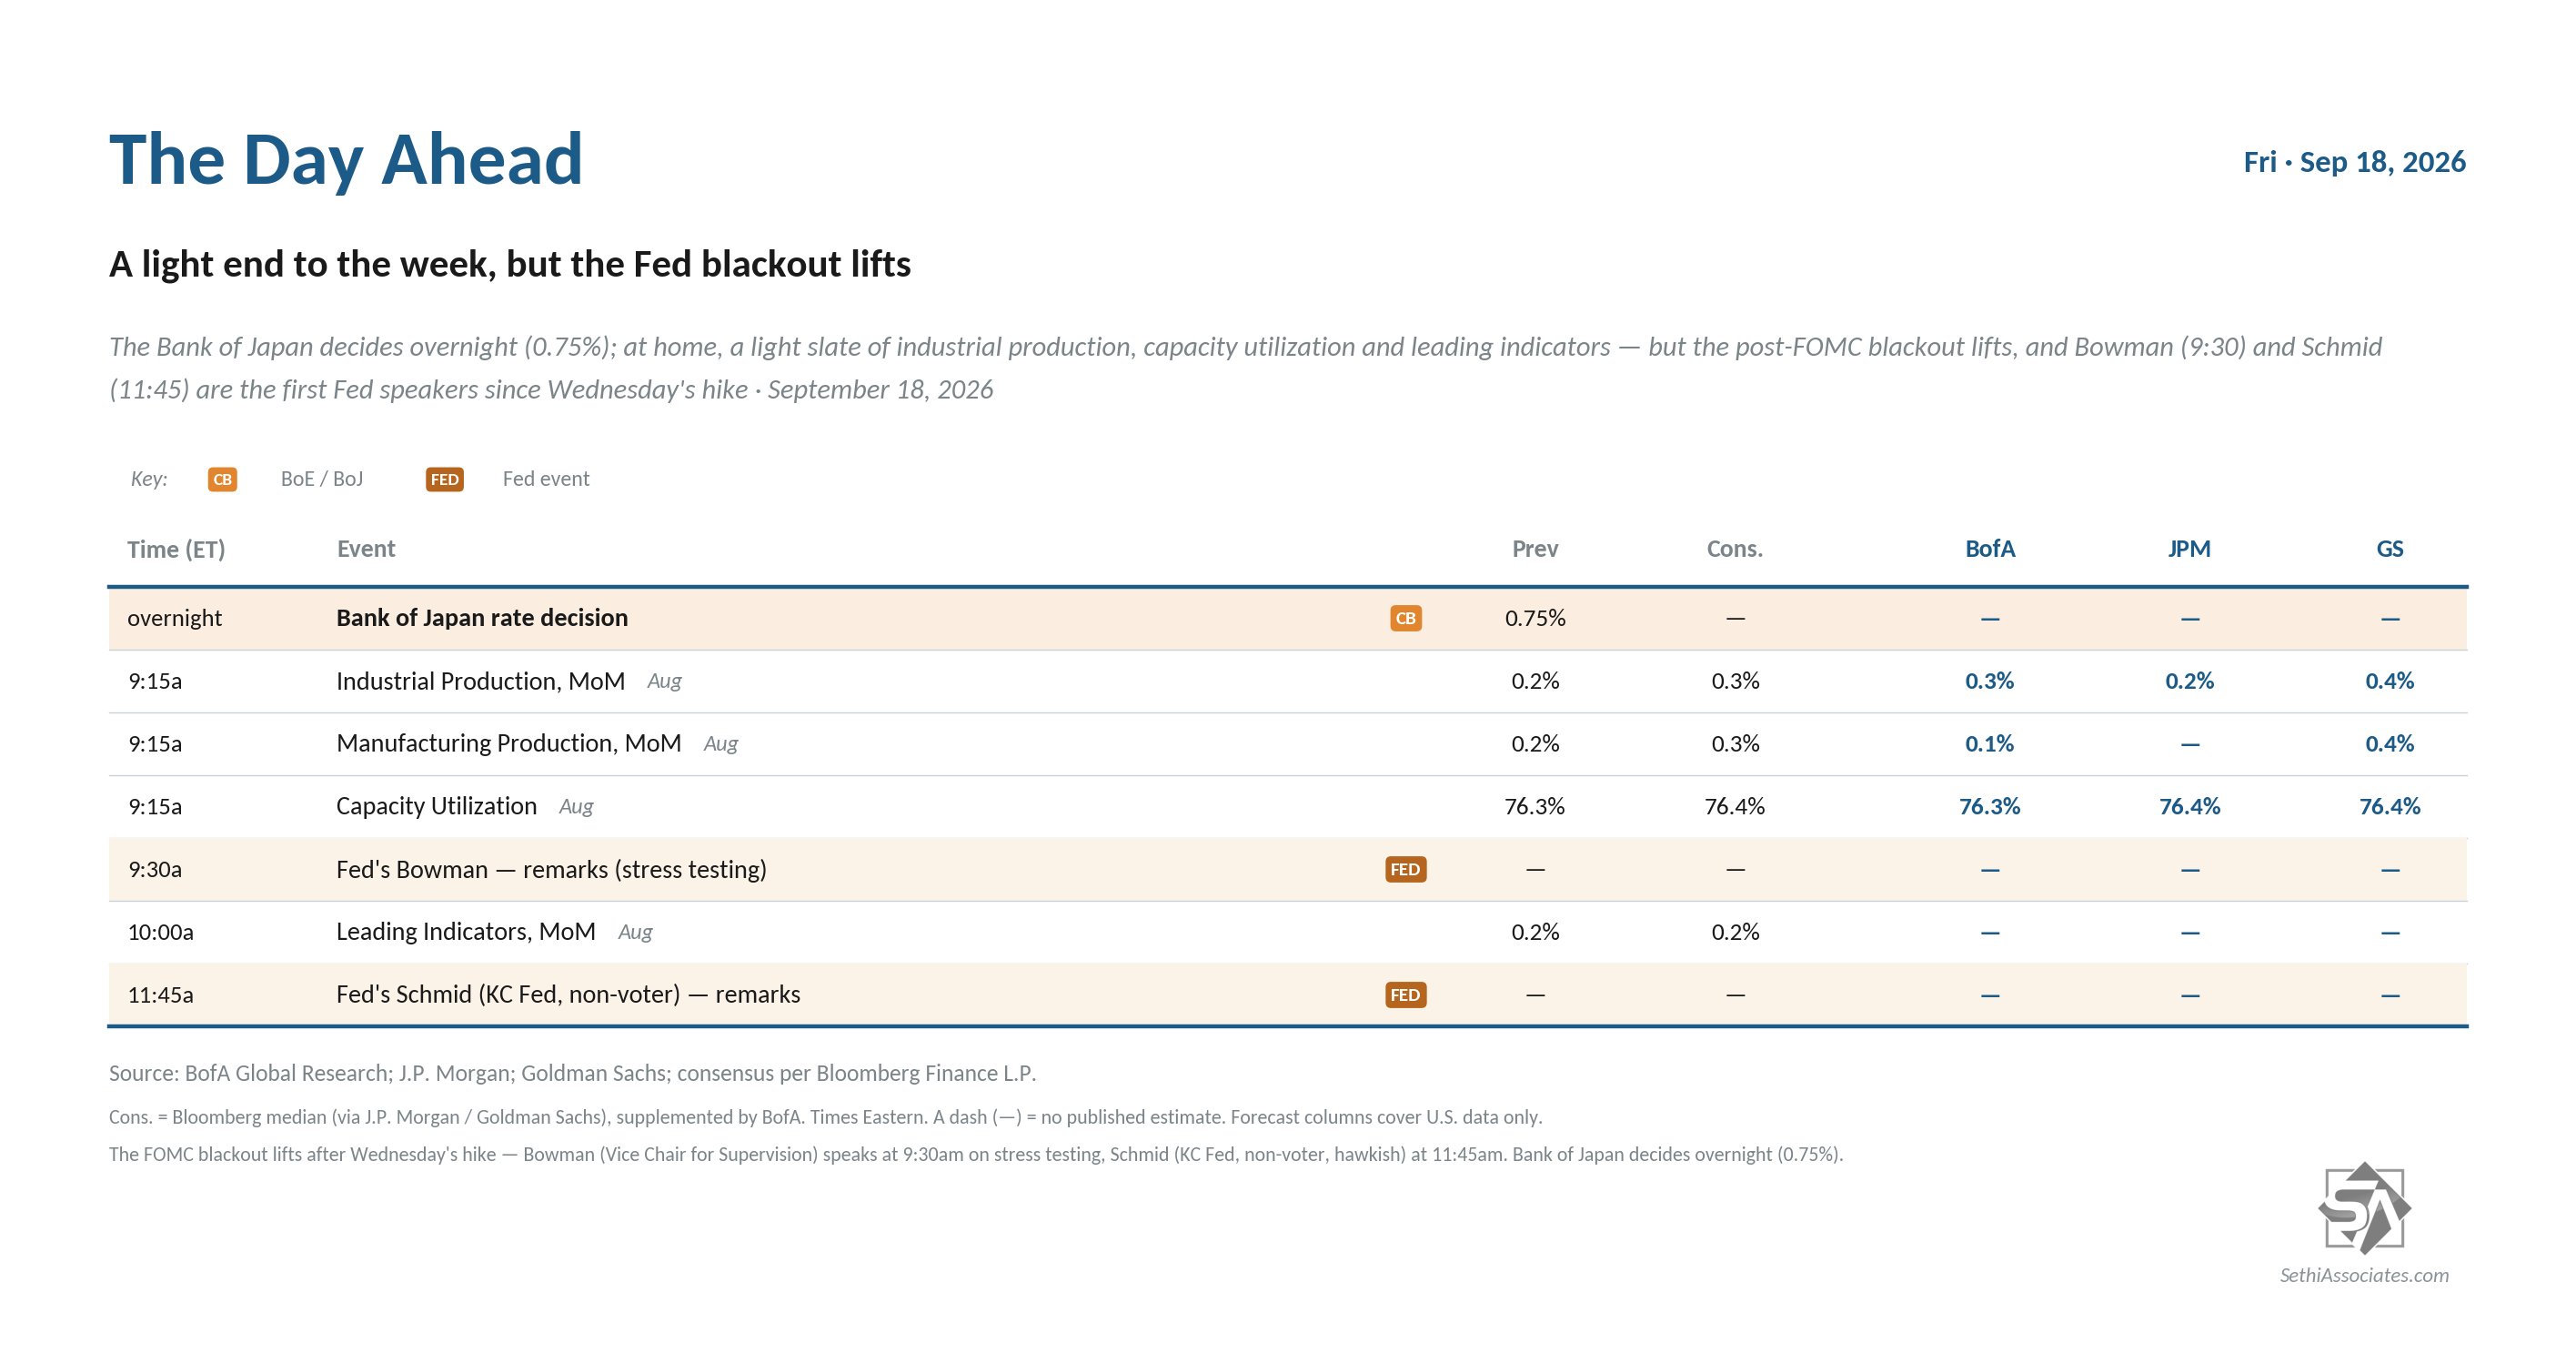
The Day Ahead – A Lighter End to the Week But Fed Blackout Is Over
US economic data lightens up with just August industrial production (an important report though — our most wholistic look at the manufacturing sector) and leading indicators (which are not much use as currently constructed but the coincident indicators have a high correlation with current GDP).
The Fed speaking blackout ends at midnight tonight and we did already have two speakers on the calendar in Governor Bowman (who is thought to be one of the few remaining doves) and Kansas City Fed President Schmid (a hawk).
Non-Bill (>1yr in maturity) US Treasury auctions done for the week.
No SPX component reporting.
Ex-US highlight is the Bank of Japan policy decision. While a hike is widely expected, especially with the Fed having hiked, there is a high bar for Chair Ueda to meet to keep the yen from seeing a big drop. Other highlights are UK September GfK consumer confidence and August retail sales and Japan August national CPI.