Housing Starts, Permits Fall on Multifamily Weakness
Both starts and permits fell in August, but the headline masked the a multifamily giveback underneath.
You've reached your free article limit
You've read 0 of 1 free Pro articles.
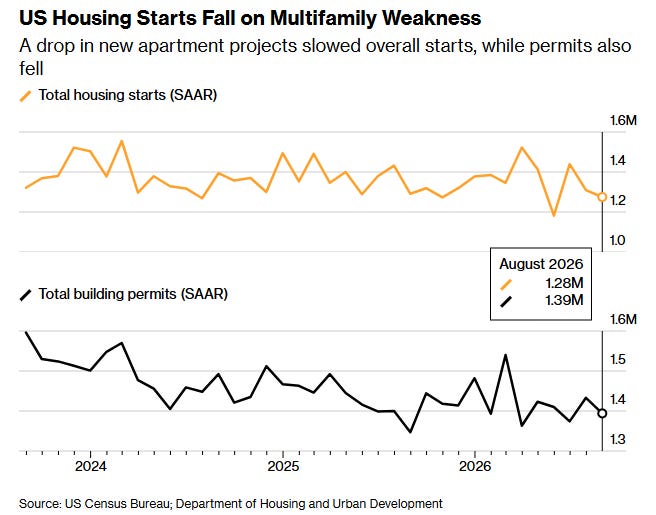
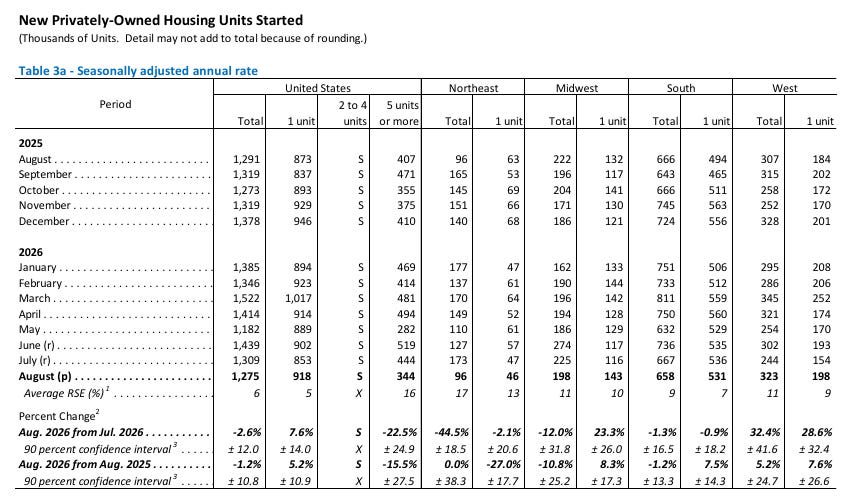
- Housing starts fell to a seasonally adjusted annual rate of 1.275 million in August, down 2.6% from a revised 1.309 million in July and short of the 1.32 million median forecast in a Bloomberg survey of economists.
- Building permits declined 2.7% to 1.394 million, below expectations for a smaller decrease.
This post will go through housing starts, then permits, then completions and finally units under construction. All figures m/m unless noted. SF = single-family (1 unit); MF = multi-family (5+ units). Seasonally adjusted annual rate (SAAR) basis. Note this report is subject to significant revision — the 90% confidence interval for housing starts m/m for example is ±12.0%.
Starts
Total starts slipped 2.6% m/m to 1.275mn SAAR — but only after a sharp upward revision to July and a nearly 22% drop in multifamily masked a 7.6% rebound in single-family to 918k, the fastest pace since March. Per a Bloomberg survey, the median forecast had been for a rebound to 1.32mn, so the print missed badly on the headline — though the composition is more encouraging than the number, since single-family is the component that matters for GDP.
As noted July was revised up sharply, with total starts lifted to 1.309mn from the 1.239mn first reported (single-family 808k → 853k).
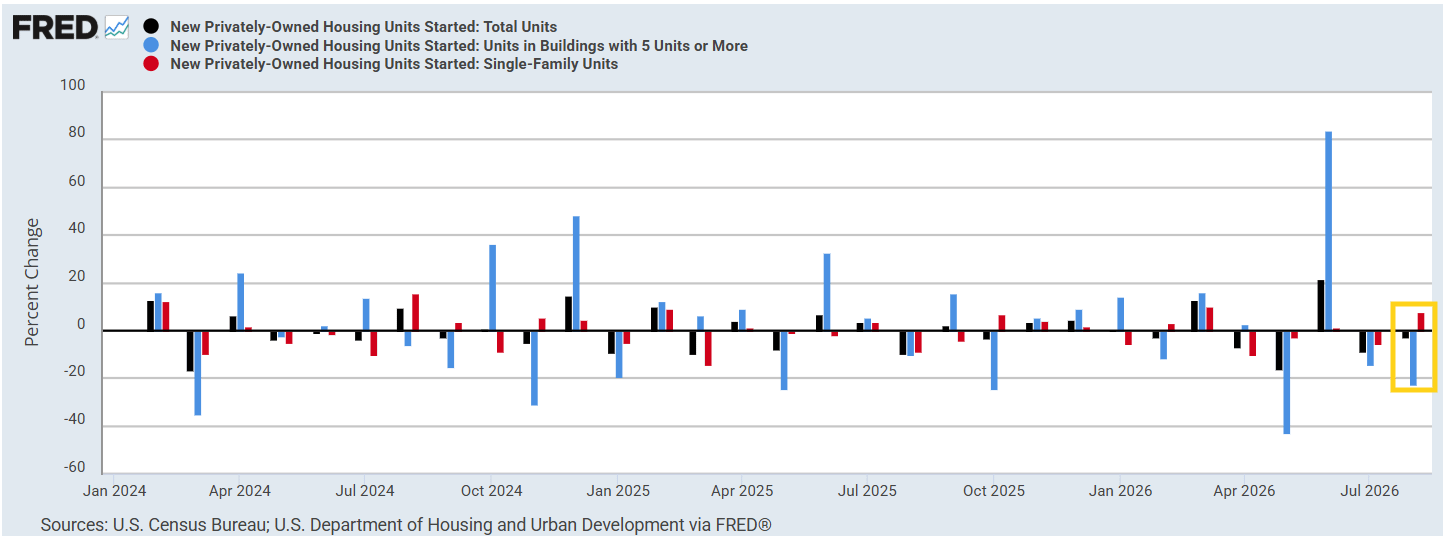
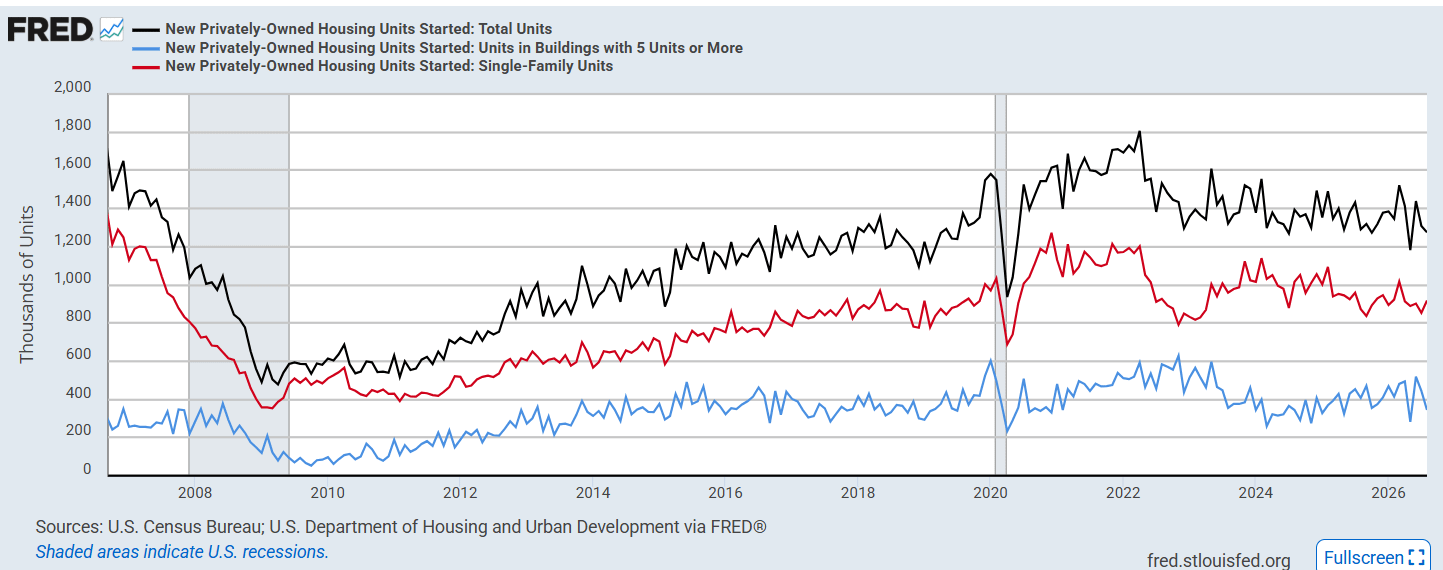
Starts are -1.2% y/y, with SF +5.2% but MF -15.5%. The data remain volatile: the Census Bureau put 90% confidence that the monthly change ran anywhere from -14.6% to +9.4%.
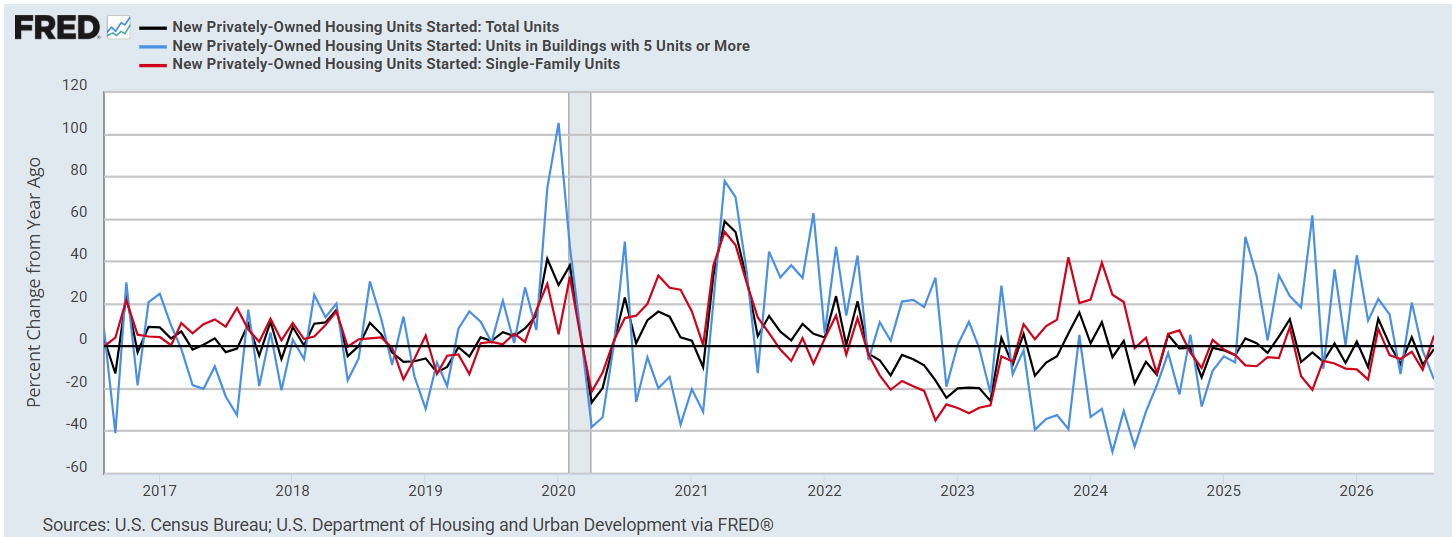
Regionally, per the Census data, the West jumped +32.4% (SF +28.6%) to what Bloomberg notes was a five-month high, while the Northeast cratered -44.5% on multifamily (SF -2.1%). The Midwest fell -12.0% overall even as single-family rose +23.3%, and the South — the largest region — was roughly flat at -1.3% (SF -0.9%), a three-month low.
Notably, on the point that single family starts are more economically impactful, Goldman Sachs raised their Q3 GDP estimate:
While total housing starts declined in August, single-family housing starts—the component of the report relevant for GDP tracking—increased by 7.6% and the July growth rate was revised up by 4.5pp. We boosted our Q3 GDP tracking estimate by 0.2pp to +3.2% (quarter-over-quarter annualized).
Permits
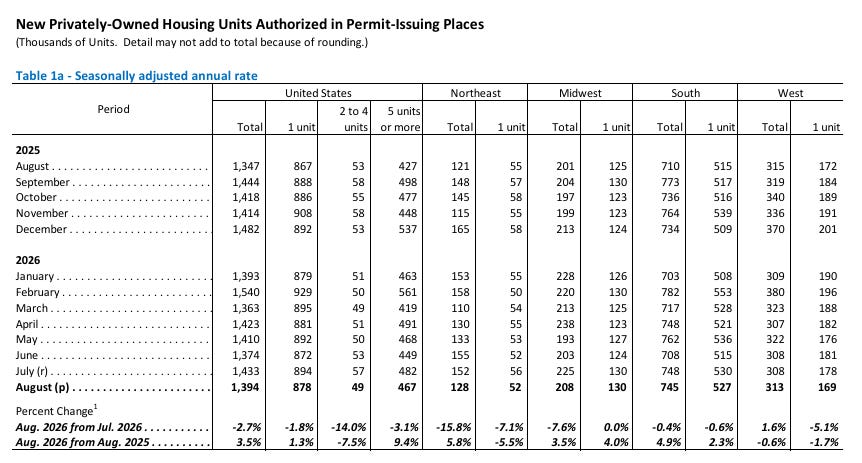
Permits fell 2.7% m/m to 1.394mn, giving back some of July’s gain, though they remain +3.5% y/y. Both cohorts were lower, with single-family off -1.8% to 878k and multifamily -3.1% to 467k. This is the more forward-looking series, so a second soft month tempers any read-through from the single-family starts bounce.
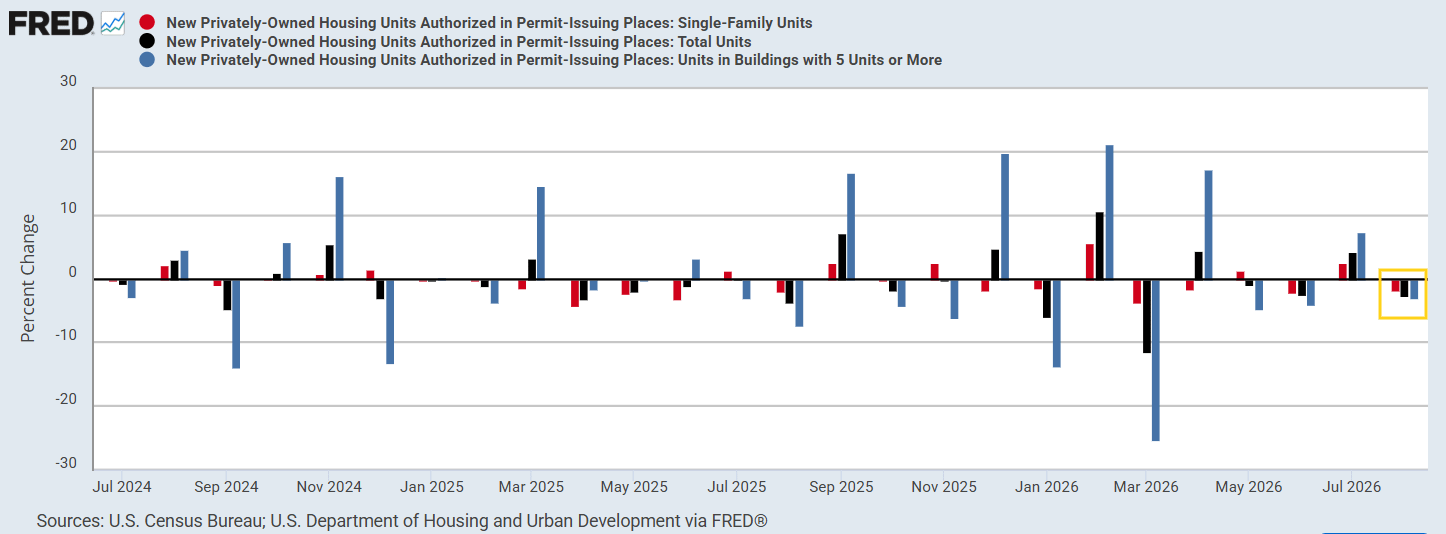
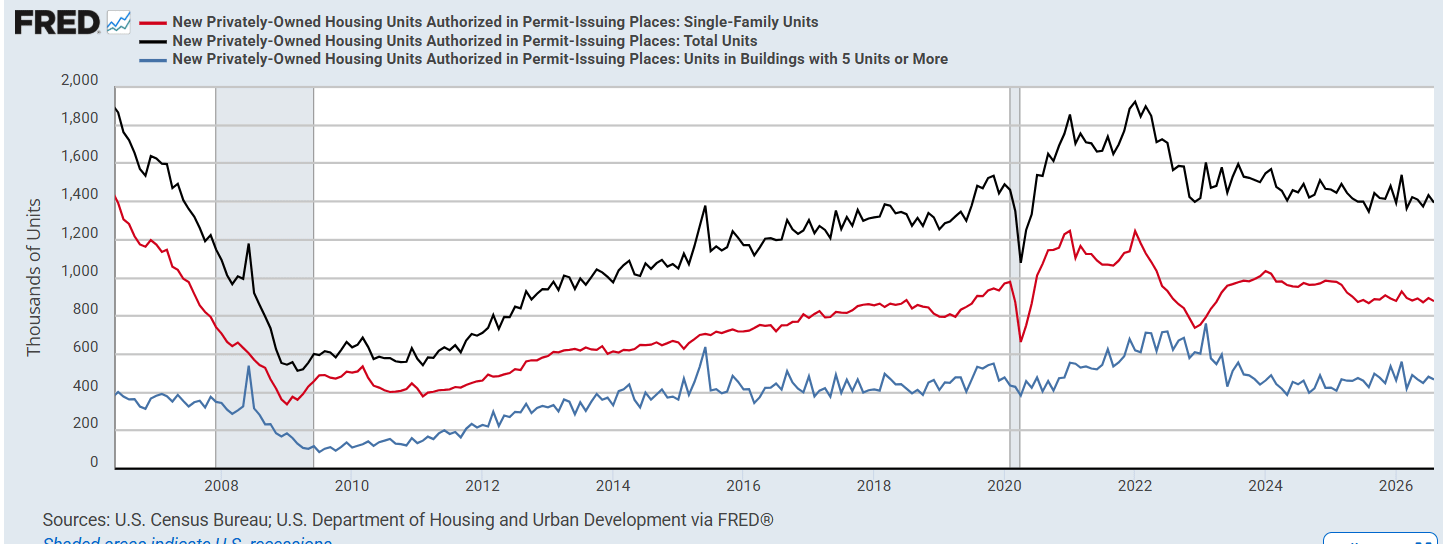
As noted total permits are +3.5% y/y (SF +1.3%, MF +9.4%).
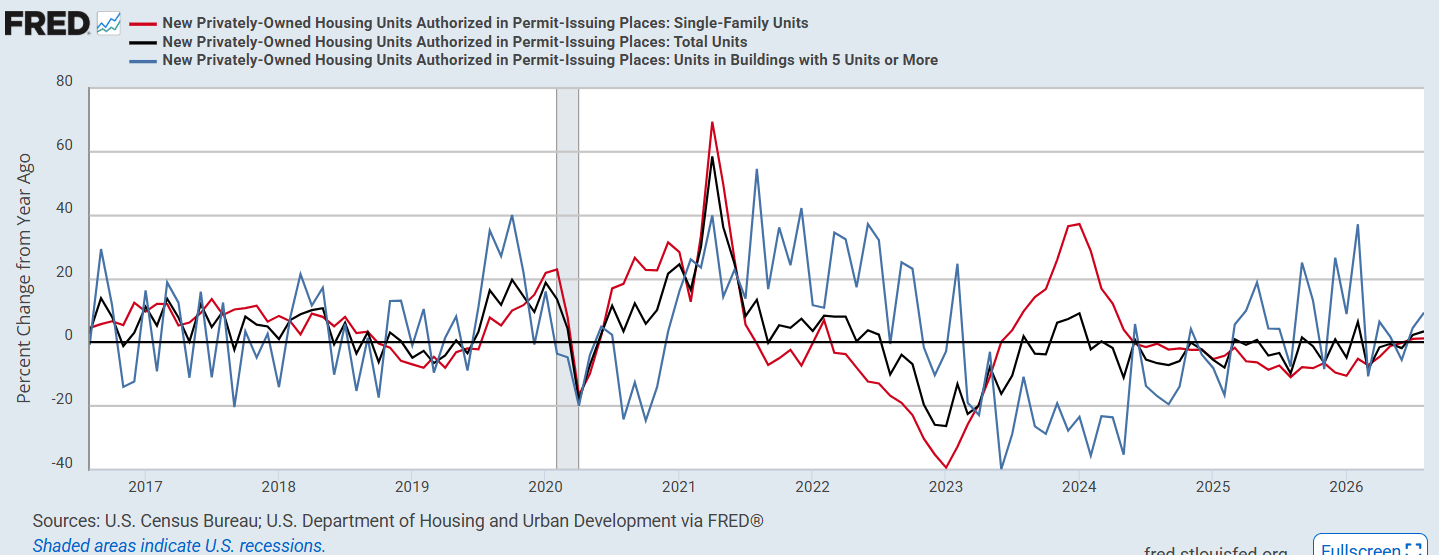
Regionally, per the Census data, total permits fell in the Northeast -15.8% and Midwest -7.6% and were roughly flat in the South -0.4%, while the West rose +1.6%. Single-family permits were softer across the board: South -0.6%, Northeast -7.1%, West -5.1%, and the Midwest flat.
Completions
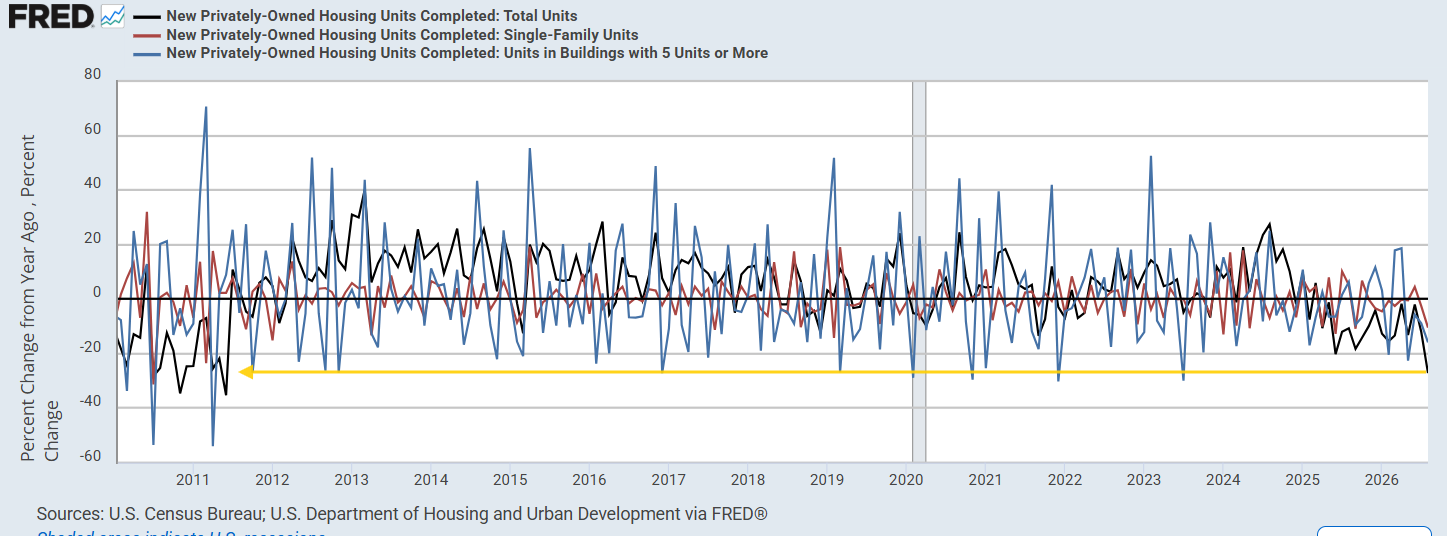
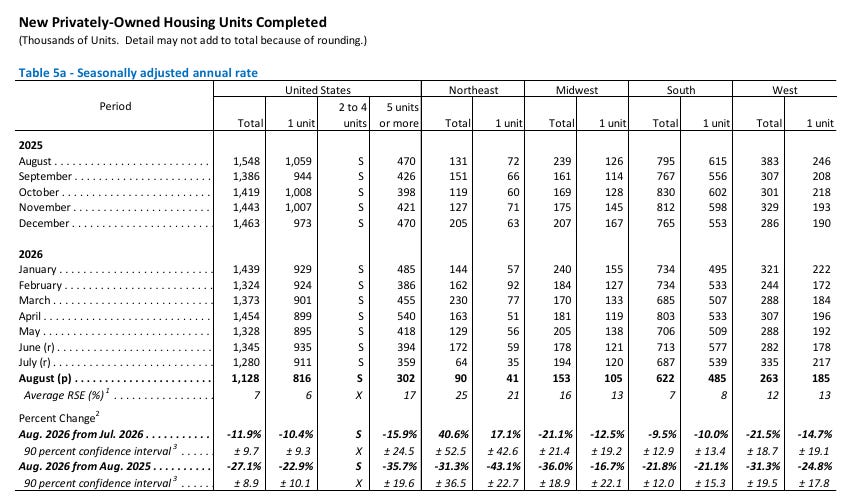
Completions plunged 11.9% m/m to 1.128mn — the slowest pace since the end of 2018. Single-family completions fell -10.4% to 816k, the least since 2019, while multifamily dropped -15.9% to 302k, the least since March 2022.
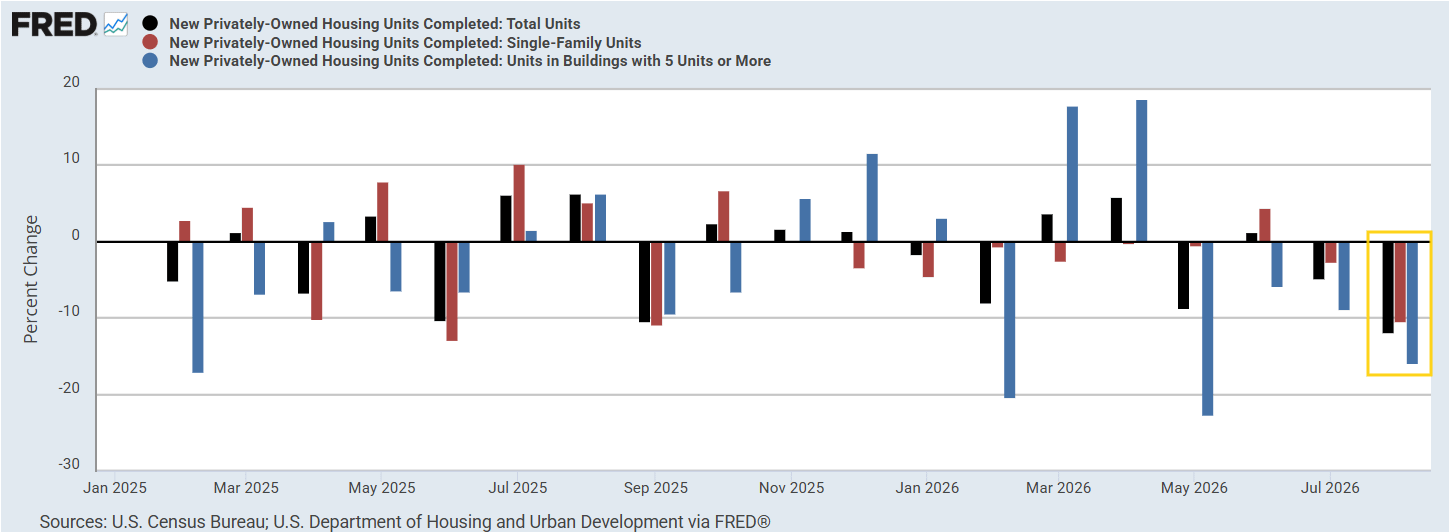
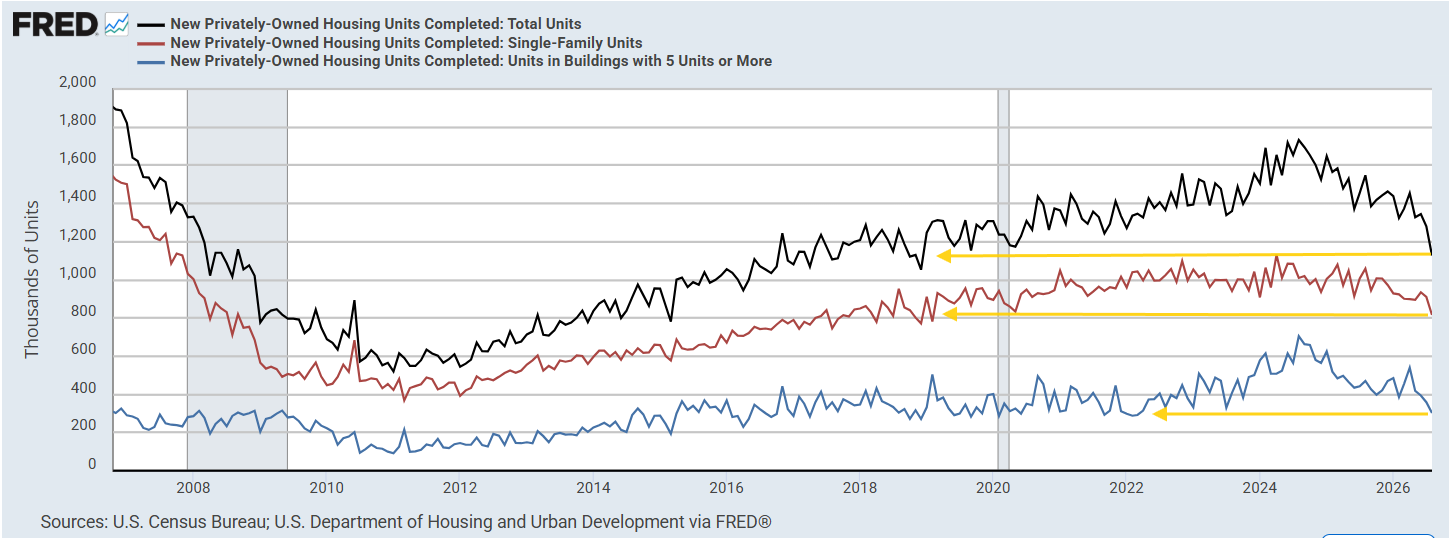
Completions are -27.1% y/y (SF -22.9%, MF -35.7%), the biggest annual drop since 2011, though some of that y/y magnitude reflects an unusually high August 2025 base of 1.548mn. July completions were also revised up (1.212mn → 1.280mn).
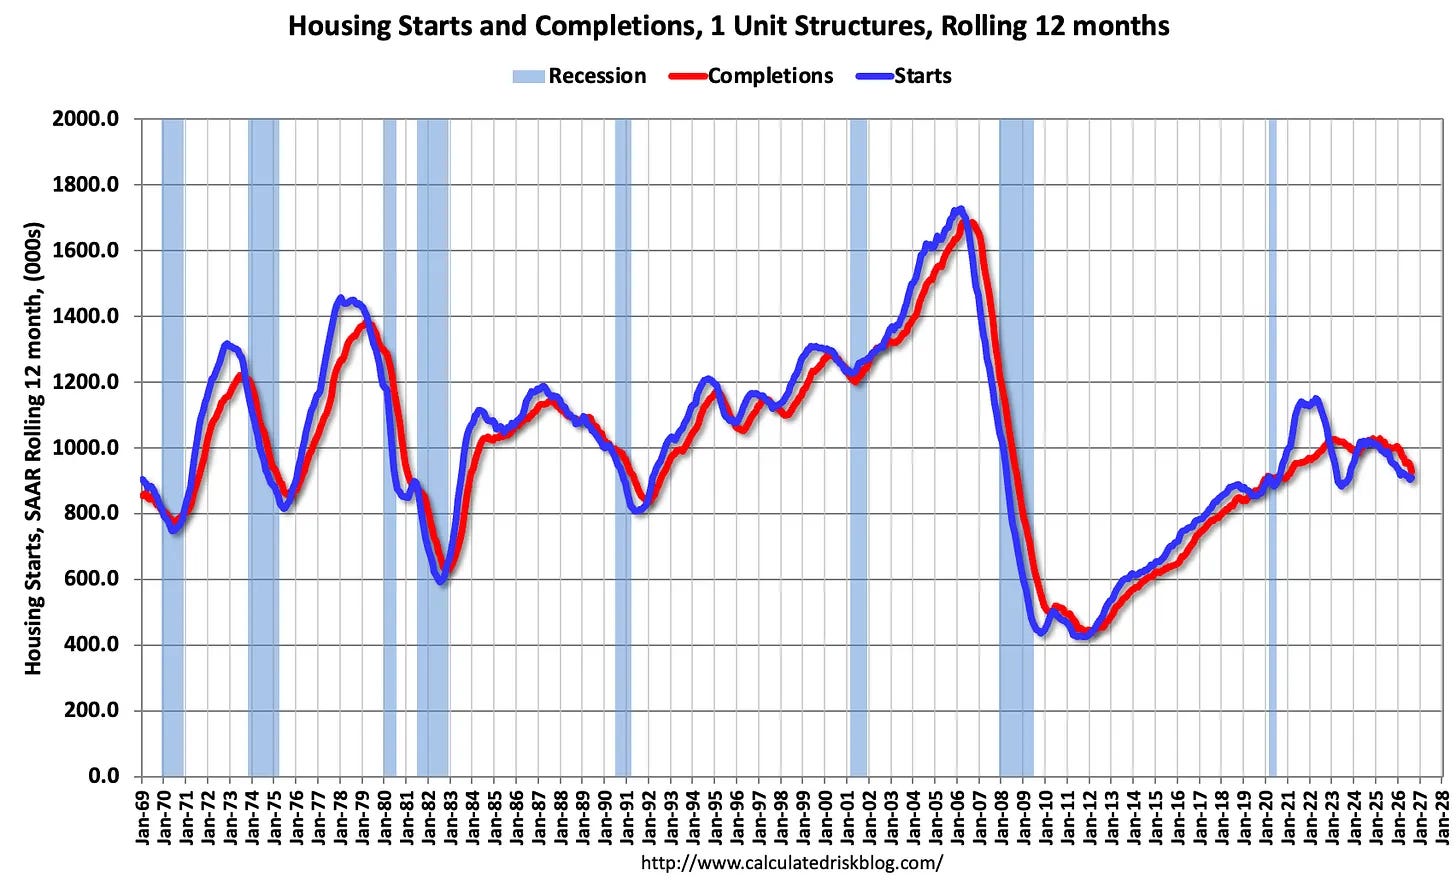
Housing expert Bill McBride of Calculated Risk points out that “builders are now completing slightly more single-family homes than they are starting on a 12-month basis (reducing inventory). Both starts and completions are trending down.”
Under Construction
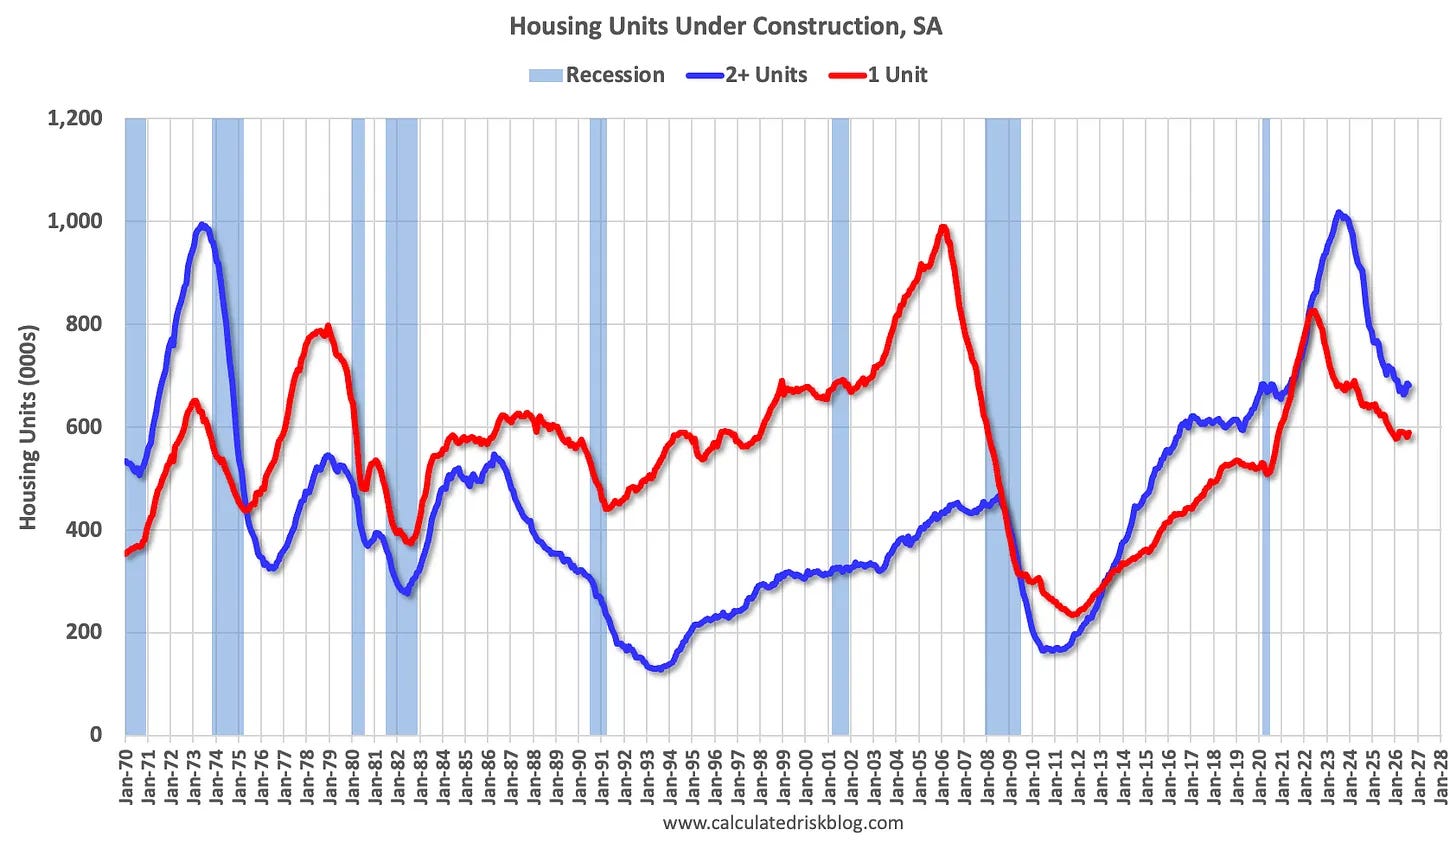
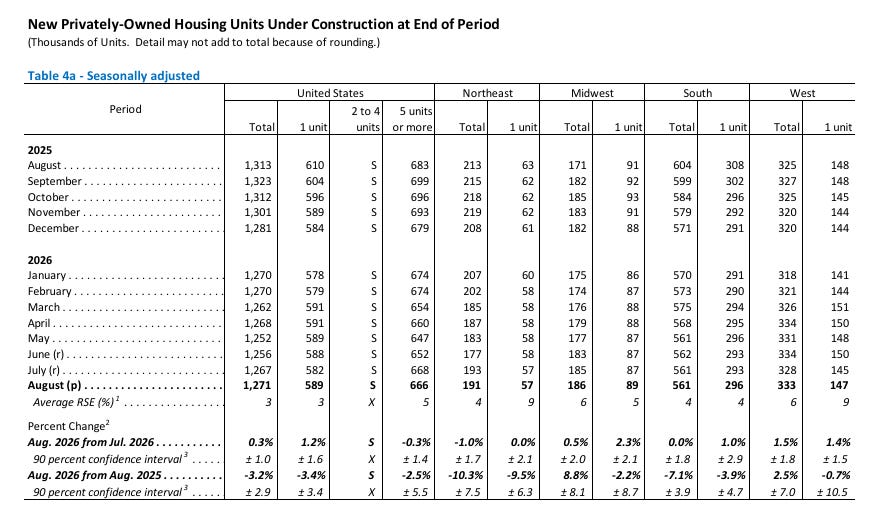
The construction backlog edged up 0.3% m/m to 1.271mn, its third monthly gain after hitting the least since 2020 in May, though still -3.2% y/y. Single-family under construction rose +1.2% to 589k while multifamily slipped -0.3% to 666k.
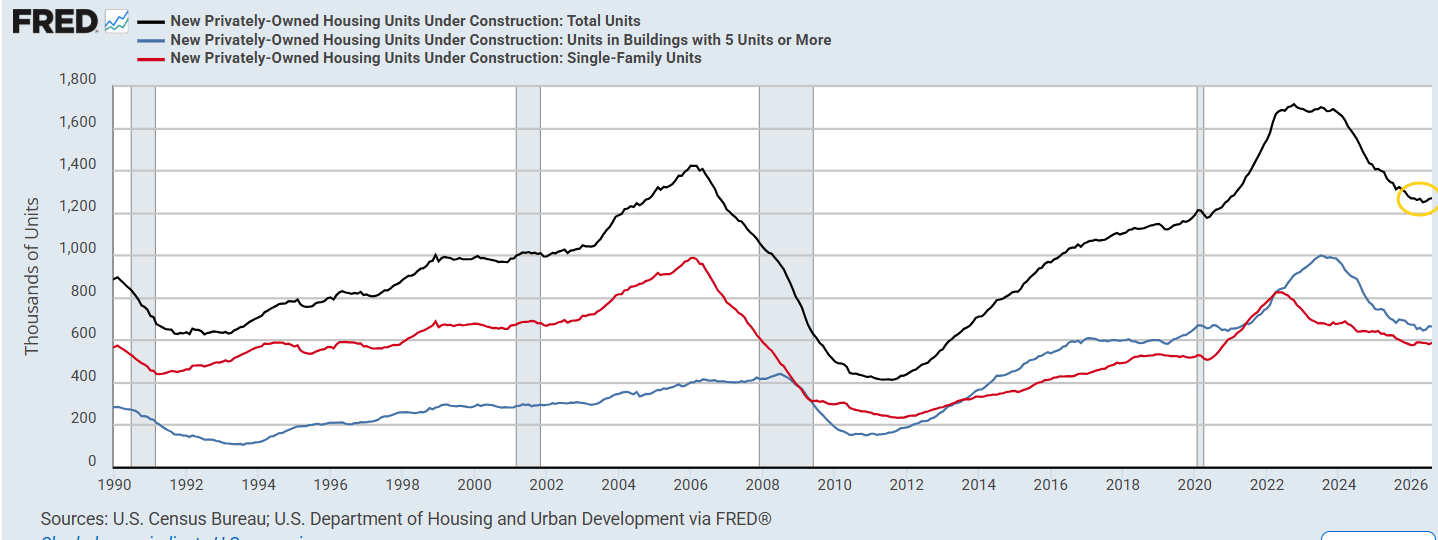
Per Calculated Risk, that leaves the combined total roughly 443k below the October 2022 record of 1.714mn, and multifamily about 336k below its July 2023 peak — but the level has been little changed for most of this year, and still modestly above the 1.1-1.2mn that prevailed in the three years before the pandemic. The bulk of the pipeline remains concentrated in the South and West.
Analyst Reaction
As Bradley Saunders, North America economist at Capital Economics, put it in a note, “The big picture remains that elevated and rising borrowing costs are holding developers back,” which supports his view that the downtrend in starts has further to run. It’s showing up in the builders’ own results — Lennar Corp. (LEN) reported revenue and new orders down year-over-year on Wednesday, with margins squeezed by price cuts and incentives.
https://www.census.gov/construction/nrc/pdf/newresconst.pdf
