The Bulls Are Using Margin Again. Here’s How Well That Has Ended in the Past.
Let’s look at today’s indicators with an eye to the past to get a look at a possible future scenario.
You've reached your free article limit
You've read 0 of 1 free Pro articles.

The Market
Today was a bit of a Realization Day. Not a huge one, just a minor one.
You see, today was the day everyone realized that when NVDIA rallies, it does so at the expense of most other stocks. That is the Either/Or Market. It’s NVDA alone, but NVDA is responsible for the lion’s share.
Everywhere I turned, folks were quoting how bad everything else was. Something like 11 of the 12 sectors of the market were red while NVDA was green. What’s more—and this seemed to really irk some folks—the rally wasn’t in ALL of the semis. It was even selective among them.
I will reiterate that the same way the software stocks have begun to differentiate themselves, I expect the semis to do the same. That is standard after a massive drawdown. They are selective on the way down until all of a sudden, all at once, they all go down together. That’s when you get the panic.
Then the rebound off of the panic also tends to be all-encompassing. It is when it comes back down, and the bases build, they sort themselves out.
Did you notice the drugs backed off pretty good? Did you notice the banks continue to be sloppy? Energy wasn’t terrific. And so on. However, for the most part, very few of the indicators changed.
Here are the ones that changed. The VIX DSI finally broke 15 and is now 13. That’s enough for a yellow light to be light. As a reminder, under 10 is a red light.
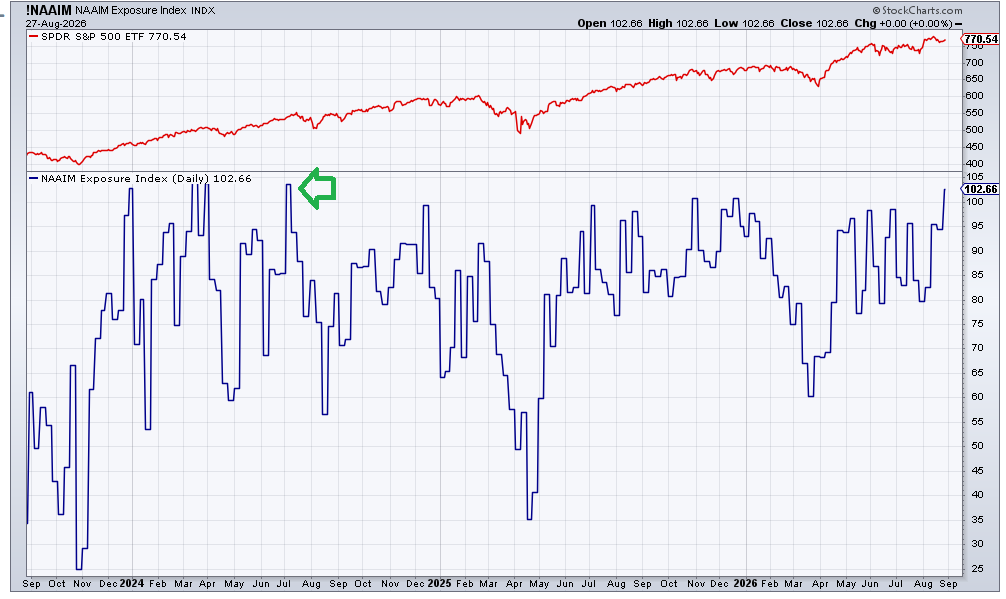
The folks over at NAAIM increased their exposure to 102.66, which means they are now on margin. That is the highest exposure they have had since July of 2024. It’s hard to see on the chart, but the S&P then corrected about ten percent (arrow). In fact, the only time it did not correct about ten percent after getting over 100 is in January 2024. Oh, it had a few days of whack, but that was that.
I think we just have to expect a bout of volatility now.
New Ideas
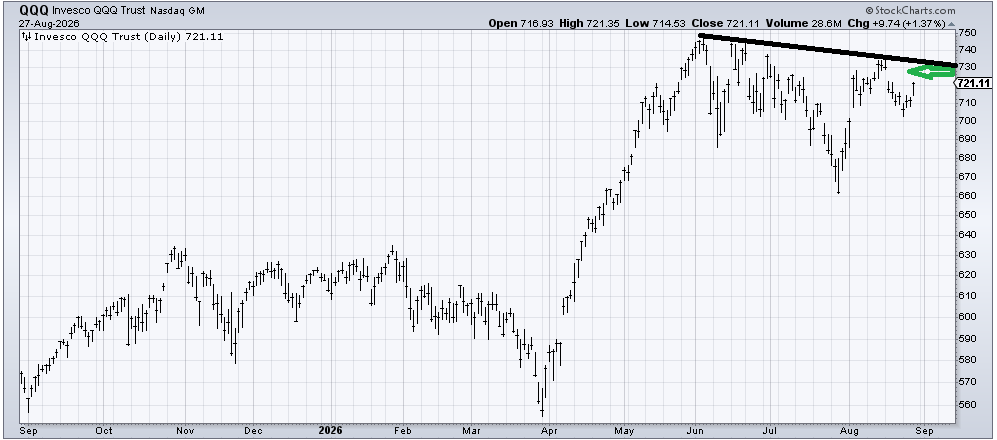
I was asked my view on the QQQs. A few days ago, I said a gap fill near 700 would probably take us into the short-term oversold condition. We didn’t quite get all the way down there, but we got close. Now I would say that resistance at 735-ish, coupled with a fap fill at 730, is what I think caps this rally.
Today’s Indicator
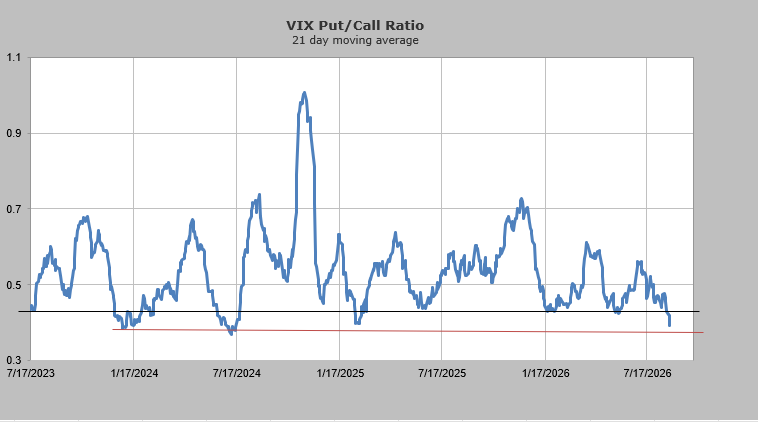
The 21-day moving average of the put/call ratio for the VIX is now at .39. The red line on the chart shows us this is about as low as it has gotten in the last few years. You can see that July 2024 timeframe on the chart.
Q&A/Reader’s Feedback
Helene welcomes your questions about Top Stocks and her charting strategy and techniques. Please send an email directly to Helene with your questions. However, please remember that TheStreet.com Top Stocks is not intended to provide personalized investment advice. Email Helene here.
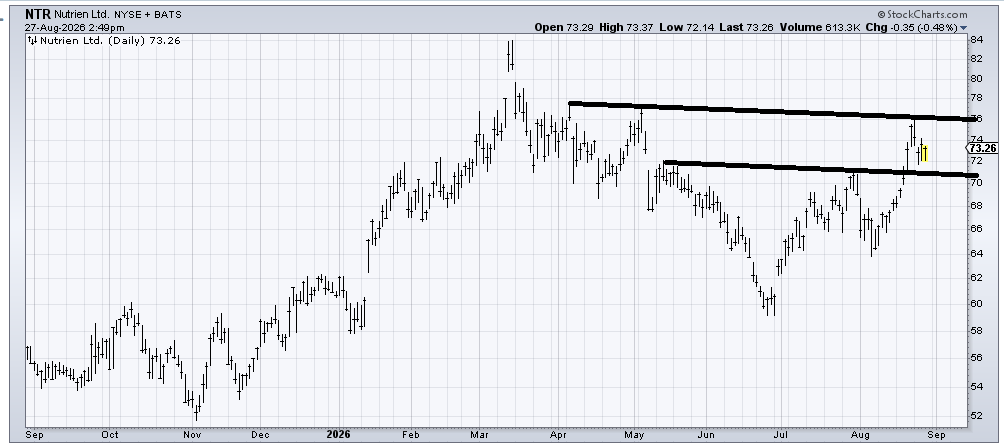
Nutrien (NTR) is enjoying a pullback after a nice run-up. As long as it stays over 70, it ought to be okay. Getting over 76 would obviously be a big plus.
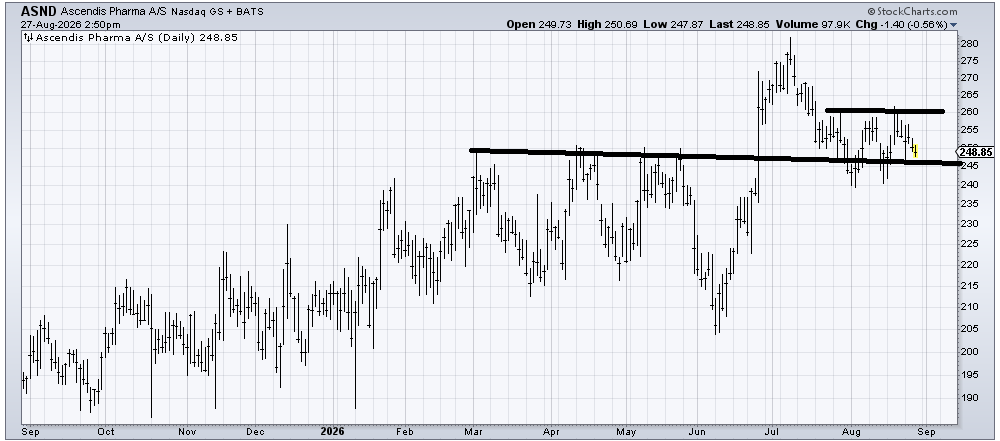
Ascendis Pharma (ASND) is probably just consolidating after a big run to a new high, but it did not participate in the healthcare rally in August, which makes it a bit suspect. Use a stop under 240. Also, a reminder that it trades very thinly.
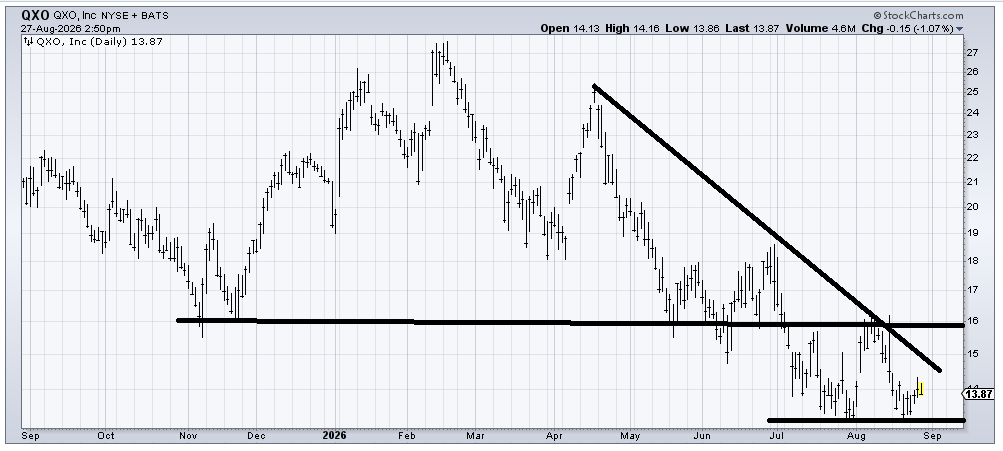
QXO (QXO) is a bit early to say it is bottoming. It tried in June, and you can see it failed to do so. For that reason alone, I would wait until it first crosses that downtrend line and then can get up and over 16. We are heading into the time of the year where first we get some tax loss selling, followed by tax loss buying, so I’d keep this on the radar.
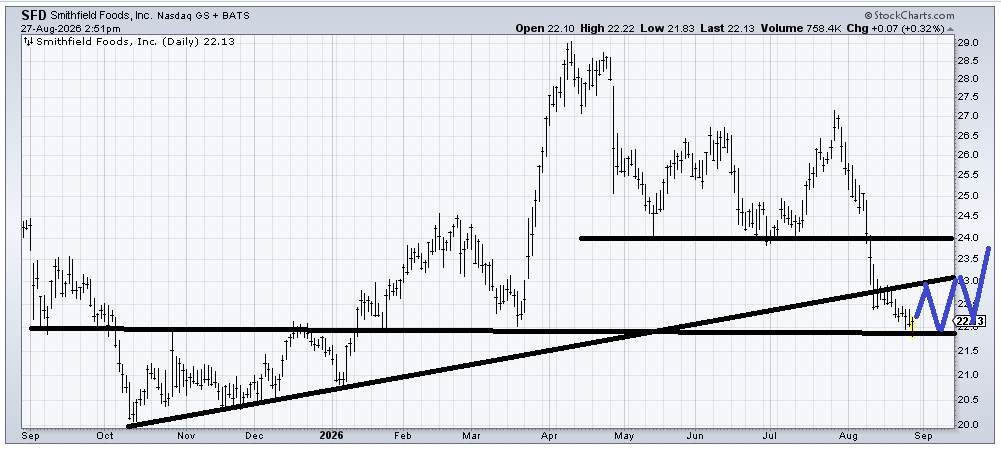
When I look at these down-and-out food stocks, I seem to always check on their yield first. Smithfield Foods (SFD) yields just over 5%. But I would never buy a stock just for the divvy. SFD is at support and has met a first target. I know I sound like a broken record, but I think SFD would be a great tax loss selling candidate in the fourth quarter. I have drawn in blue how I imagine it playing out.
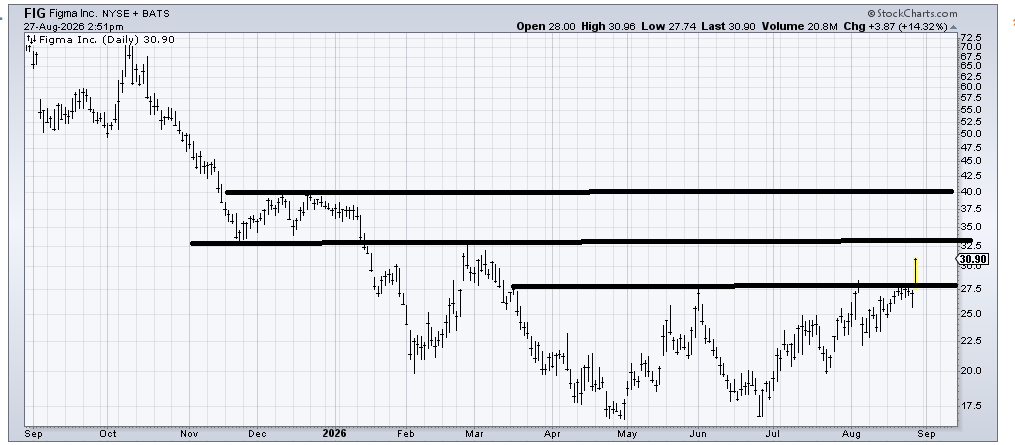
Figma (FIG) looks like a bottom. I would never chase a stock that is up nearly 15% in one day, and it has some decent resistance in the 32.50-33 area. That having been said as long as pullbacks in that 27.50 area hold, it’s a good chart.
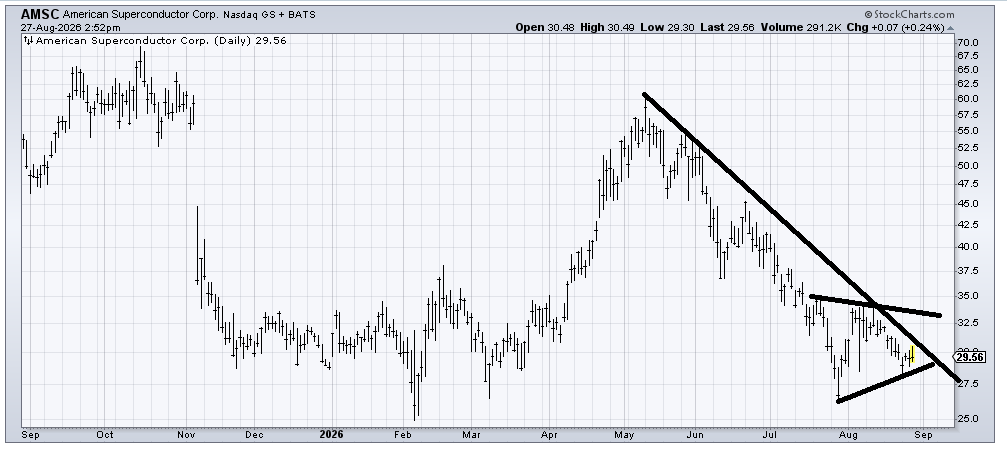
American Superconductor (AMSC) is probably oversold down here, but the sideways action is too short for my taste. If you have patience, I would use a stop under 28.
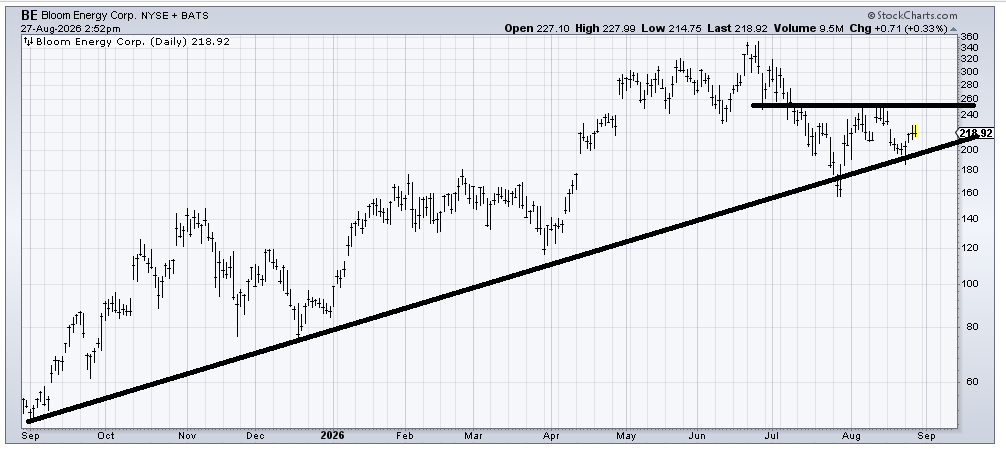
Bloom Energy (BE) looks like a coin toss to me. Resistance at 250 and support at that uptrend line. I’d be very concerned if it breaks that uptrend line.
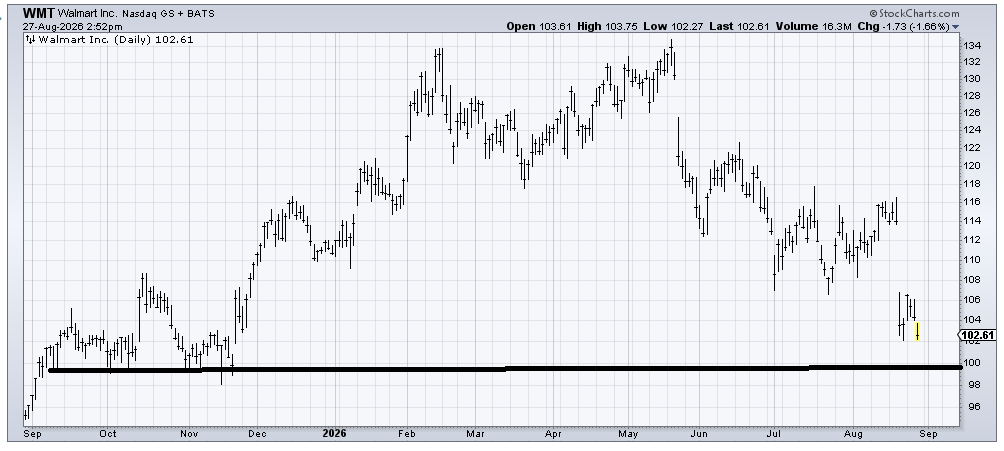
I had thought Walmart (WMT) was searching for a bottom when it was at 112, but the earnings report proved me wrong. There is a measured target in the 100-105 area, so I suspect WMT finds some support soon. But is it buyable? For a trade. This would be yet another tax-loss selling candidate.