A Surprising Index Is Beating the S&P 500
Has breadth begun to take a turn for the better? Here’s what the indicators are showing me.
You've reached your free article limit
You've read 0 of 1 free Pro articles.

For more than two months, I have been harping away at the market’s poor breadth. For more than two months, I have called nonsense on this broadening out theme that everyone was so wedded to in early August. Now that I am back from vacation, I see the major investment banks, as well as social media, are filled with charts showing this terrible breadth situation.
They cite all sorts of statistics. My favorite being (and I am paraphrasing) that if we removed the AI-related stocks from the S&P, the S&P would be down six percent on the year. Anyone who owns individual stocks could have told you that. In fact, they might be surprised it was only six percent.
Yet I look at the sentiment indicators, and they all show a ton of complacency, even bullishness. I mean heck, even the old folks at AAII have more bulls than bears now. But I suspect that is because the indexes like the S&P and Nasdaq that are so heavily weighted to tech, namely big cap tech, are up. Even the bulls know breadth stinks, but they are okay with it.
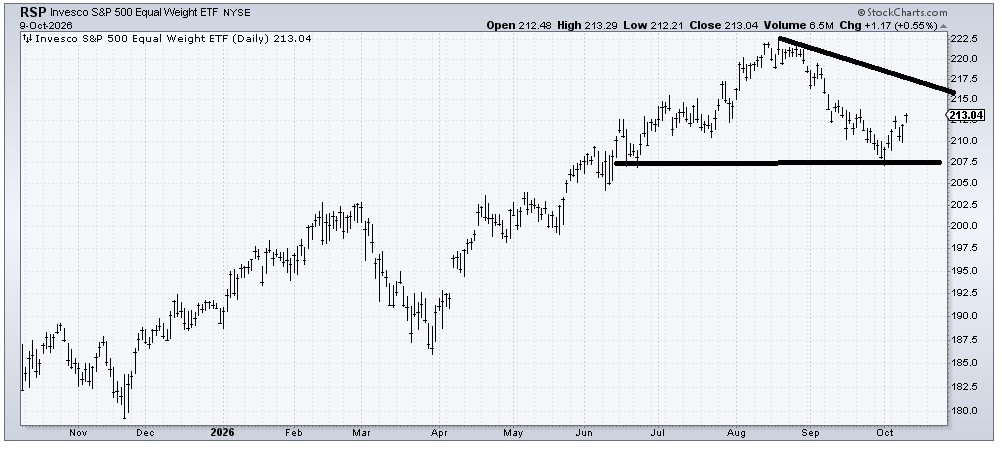
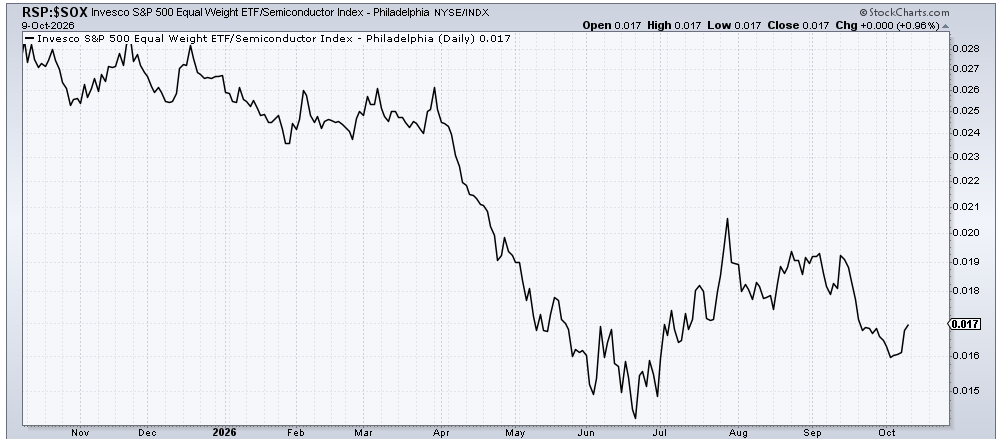
So what if I told you that in the last week, the RSP—you remember the RSP, the equal-weight S&P that everyone adored in early August but by the end of September had fallen by seven percent, so they had gone silent about the broadening out trade—has bounced nicely since the calendar turned to October? What if I told you that in the last week, the RSP has outperformed the S&P?
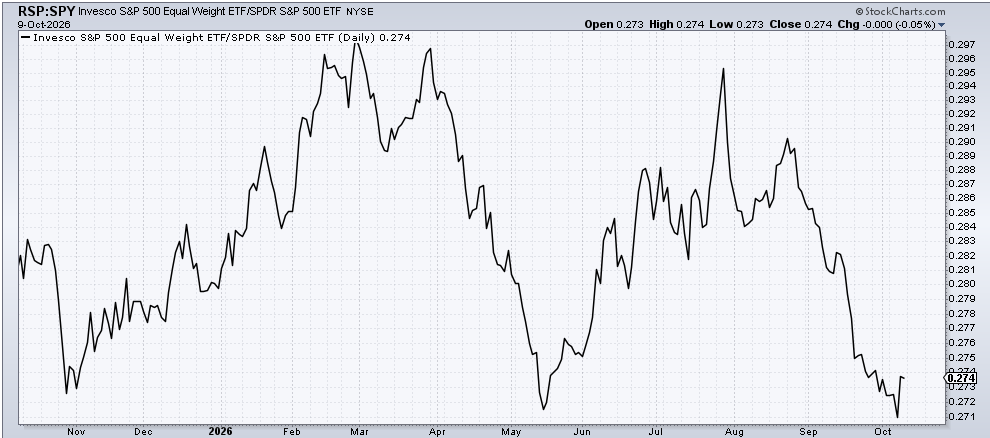
What if I told you that since the calendar turned to October, the RSP is outperforming the SOX—gasp! Oh, it’s had small little forays of outperformance before, but not since everyone finally realized the ‘others’ have been terrible.
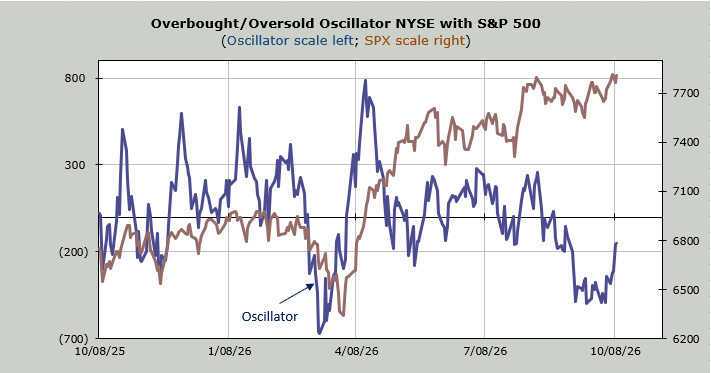
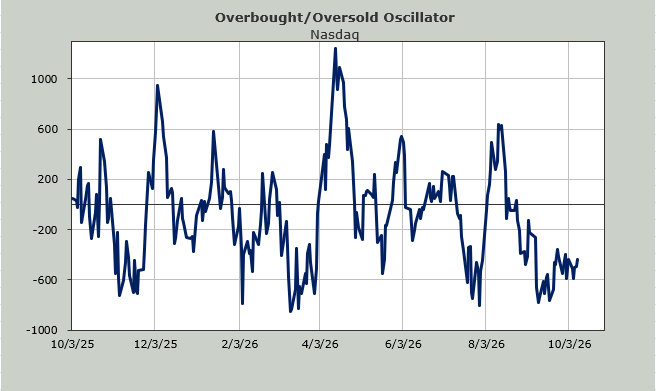
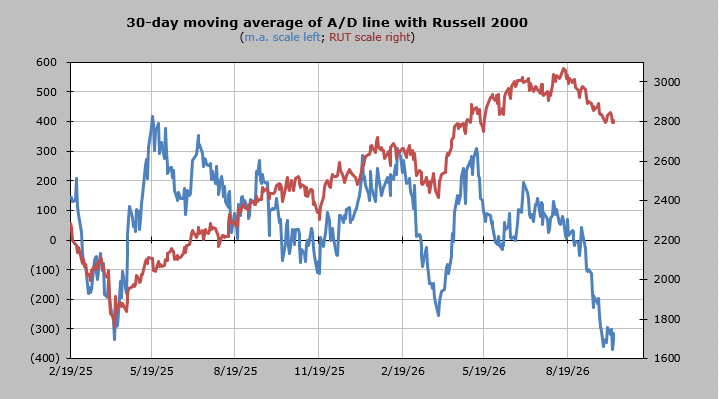
For the first time since mid May, I can tell you the market (others) is deeply oversold.
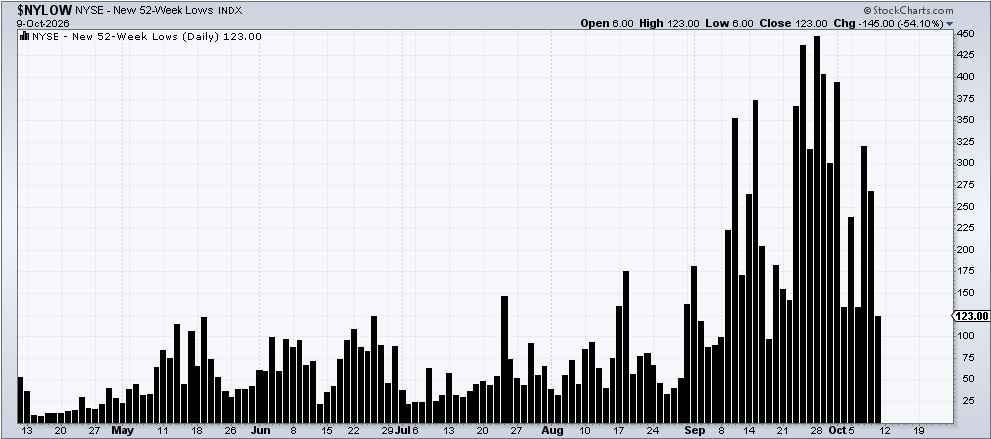
The number of stocks making new lows on the NYSE peaked (at least so far) at 447 on September 28th. On that day, the intraday low on the S&P was 7666. The Russell’s intraday low was 2807.
A few days later, on October 1st, the S&P had an intraday low of 7616 (thus, lower than 9/28’s low). On that same day, the Russell had an intraday low of 2775, also lower than 9/28’s low. On October 8th the intraday low for the Russell was 2762, again lower than the previous readings.
Yet on October 1st, the number of stocks making new lows was 394, fewer than the 447 on 9/28. Our first such positive divergence. On 10/8, when the Russell made an even lower low, the number of stocks making new lows on the NYSE was 268.
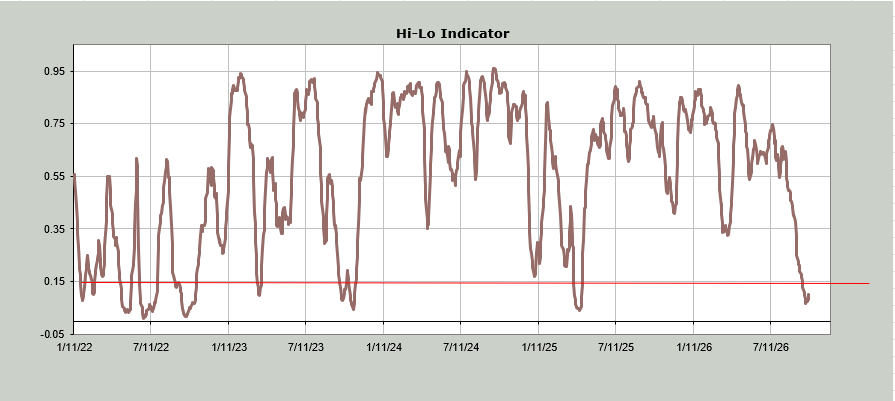
If we use the Hi-Lo Indicator, we can see it got oversold (under .15, the red line) and is desperately trying to turn upward.
If sentiment indicators were showing bearishness, I would think all of this is quite bullish for the others. But that is not the case, thus, I suspect we see a bit more rallying, but by midweek, we’re short-term overbought again. My view is that into a short-term overbought pullback, especially if it is led by the semis (the SOX did fail to get over 13,000, so I am no longer a fan of the SOX), we ought to see some of the others hold up, and maybe sentiment will change. Well, at least we can hope sentiment changes! Either way, it’s time to look at the others again, especially if they can’t go down anymore on bad earnings news.