These 3 Stocks Are Breaking Down. Here’s How Low They Could Go
Flashing bearish technical signals right now, here’s how we’d play these names.
You've reached your free article limit
You've read 0 of 1 free Pro articles.

Welcome to another edition of TheStreet Pro’s Bearish Bets, our weekly feature where we identify three stocks that look bearish from a technical perspective and may present interesting investing opportunities on the short side.
While we will not be weighing in with fundamental analysis on these issues, we hope this piece will give investors interested in stocks on the way down a good starting point to do further homework on the names contained herein.
Argenx Breaks a Big Support Level
It’s not bad enough a stock breaks an uptrend pattern, but when it fails to hold the 200-day moving average you know there is trouble. Argenx (ARGX) had been in the middle of a modest correction but then suddenly this past week on some news the stock cratered.
This chart is very bearish and with more downside to go.
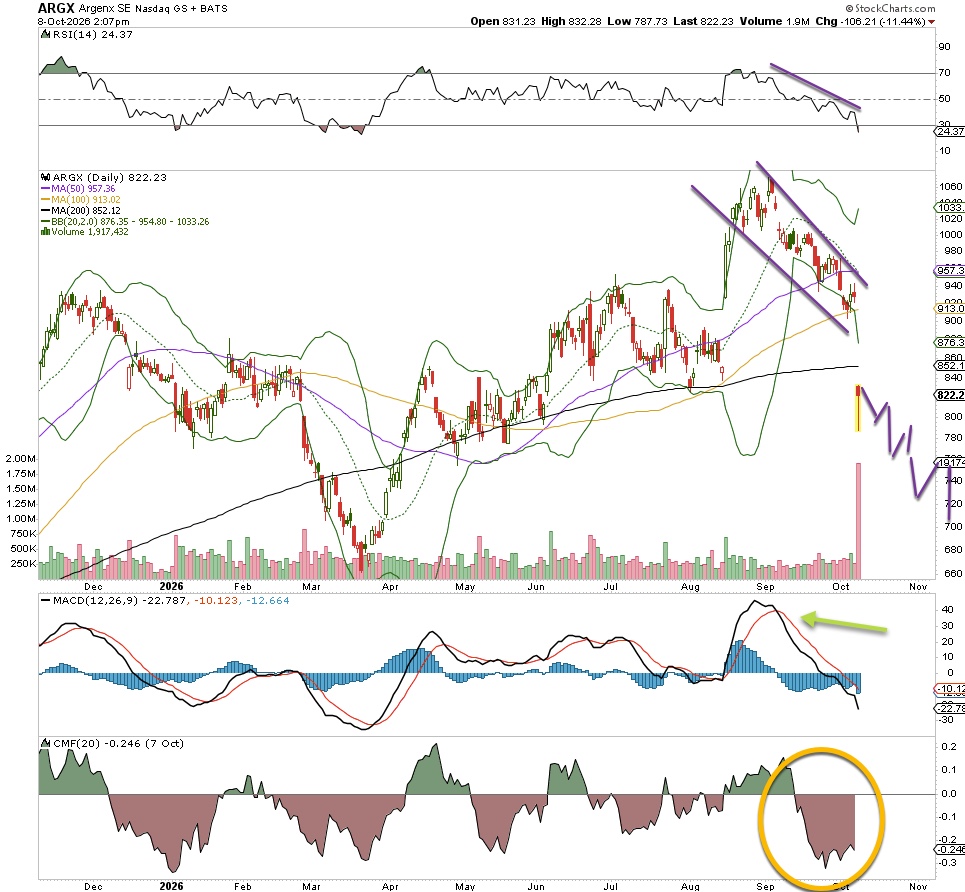
MACD has been on a sell signal for weeks, money flow is bearish and now the RSI is oversold. None of these are a reason to buy yet, but certainly the March lows are in play down at $500.
Let’s first target the $740 transition (from April), then look for the $500 target. Put in a stop at $910 just in case.
Applied Opto Cannot Retain Its Old Glory
What a magical run by Applied Optoelectronics (AAOI) late last year into the summer. From about $20 the stock went on a massive run, gaining more than 1,000% over an eight-month period. That is stunning, but for a speculative name like this the old mantra stands: What goes up, must come down.
The pain from the recent slide has been felt by the bulls, and while on a few occasions the stock has looked to break the downtrend, sellers have been coming out of the woodwork.
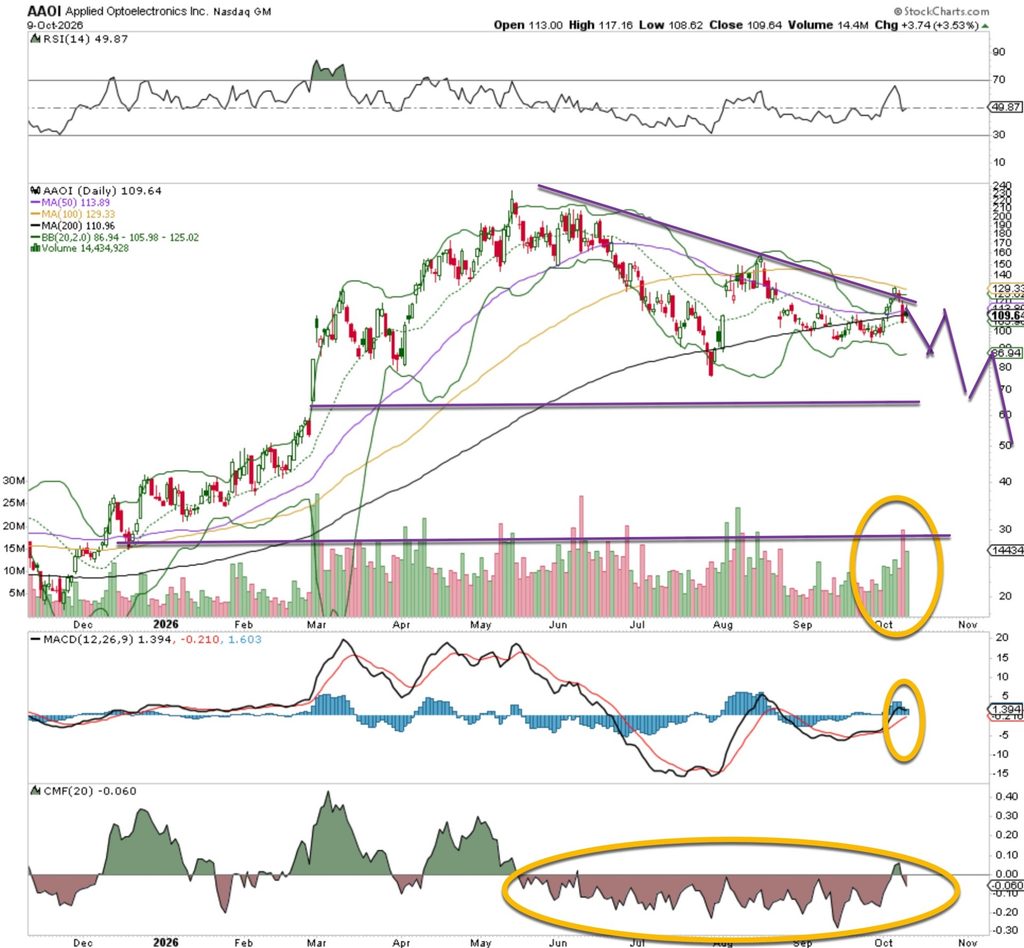
Notice the straddle near the 200-day moving average. That is not a good characteristic for a growth stock. Money flow had been bearish for months, as a series of lower highs and lower lows plague the stock. RSI tried to get overbought recently but the bulls ran into trouble.
We see a first move down to $90, then potential to $75. Put in a stop at $120 just in case.
Revolution Medicines Shows a Topping Pattern
It is not too difficult to find a topping pattern in a stock. First, you look for lower highs and lower lows, at least the start of the pattern. Next, you check the indicators and the volume. Is there excess turnover on the down days? Check and check for Revolution (RVMD), which is now just starting to move lower. The 200-day moving average comes into view here at $143, but this could really get dismantled with more downside action.
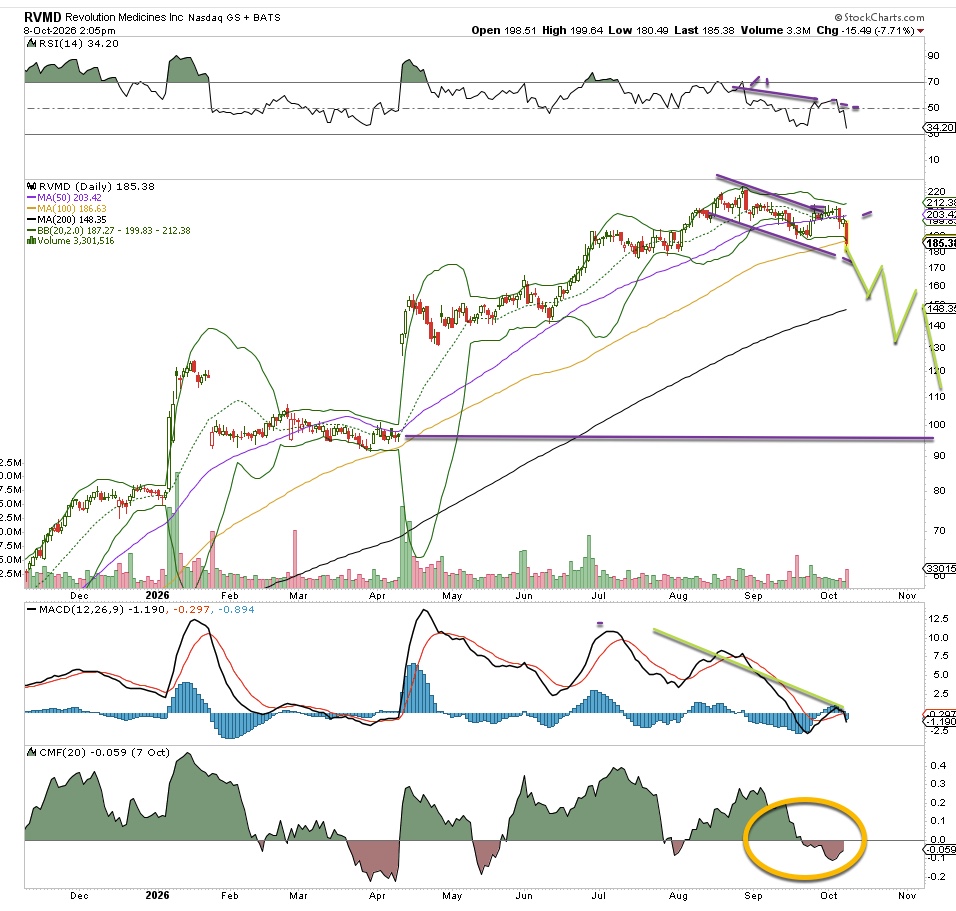
Money flow is negative, MACD is on a sell signal and the RSI just rolled over. Perfect for a short play.
Let’s target $143 and if it blows through there we could see a move way down to filling the gap around $92. That’s a huge move, so be patient. Let’s put in a stop at $200 just in case.
