A Glimmer of Light for the Rank and File Stocks
As I got back into it following my return from vacation, I began to notice that the statistics are showing improvement for the “others.” Could they be about to make a turn for the better?
You've reached your free article limit
You've read 0 of 1 free Pro articles.

The Market
It’s a funny thing when you take a week or two off from the markets, at least for me it is, because when I return, I am not sure if I should start by doing my (hand-drawn) stock charts or updating my spreadsheets on the statistics I keep. One provides a bottom up view (stock charts) and the other is a top-down (statistics).
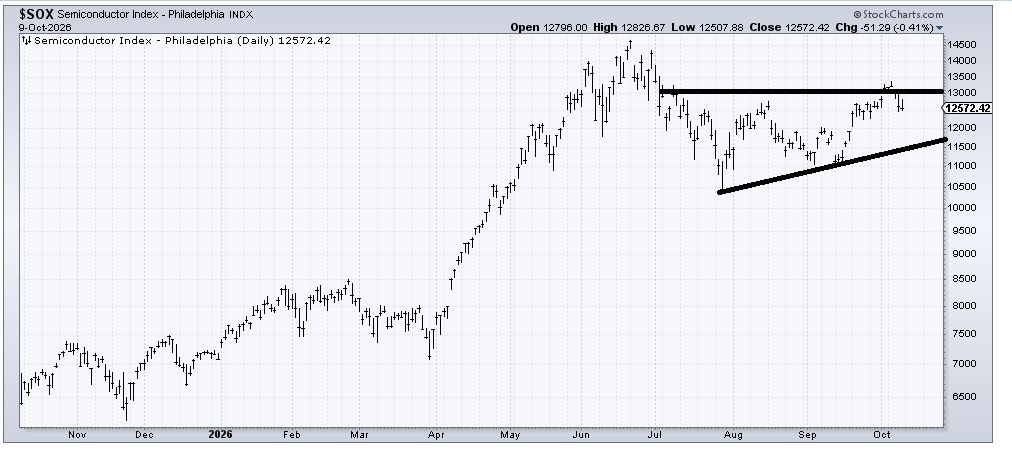
This time, I opted to start with the statistics. My take-away, was the others are grossly oversold, and there is even some glimmer of light and hope for them. This is new for me, considering in late July/early August, I turned bearish on the others. The flip side of this (of course) is that the semis are tired. I would not say I am bearish on them, but I would now lean toward profit taking rather than sticking with them.
Let’s start with the SOX. When I left, I said I was watching for a move over 13,000. If the SOX could not get over 13,000 in the next week or so, it would change my positive view. It did push over 13,000, but quickly gave it up. With the S&P and Nasdaq pushing up at new highs and the SOX at a lower high, and unable to get over 13,000 and hold it, that is a sign to me of tiredness in that group.
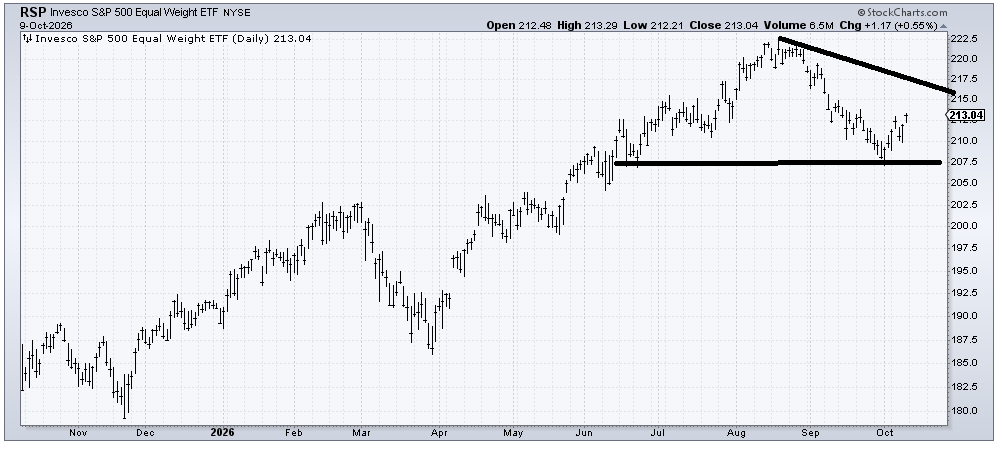
Naturally, that forced me to look toward RSP. You do recall how excited everyone was over the broadening out theme in early August, don’t you? I was not on board for that trade, and that proved the correct stance. But now I look at RSP and I see it is the only chart (away from the big cap tech/index stuff) that eked out a higher high on Friday vs. last Tuesday. You need to squint to see it but, unlike the Russell 2000, this has been pushing higher since the calendar turned to October.
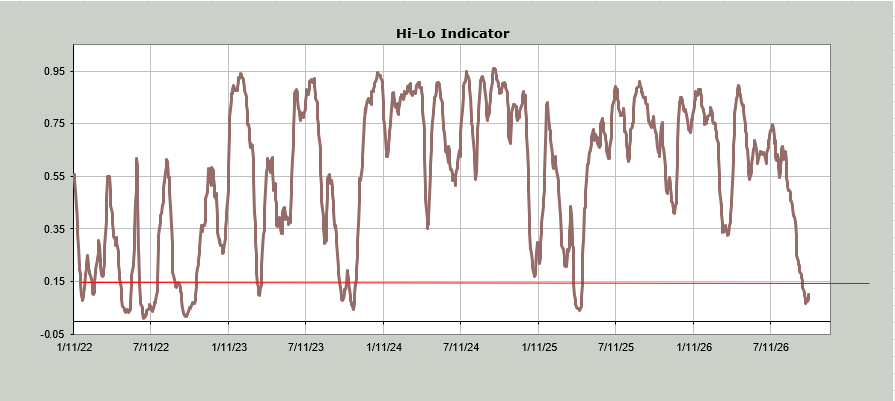
Now I have been away, so my sense on anecdotal chatter is not great, but a quick glance at social media and headlines tells me no one is talking about broadening out anymore. In fact, it’s like a daily barrage of ‘see how bad breadth is’ charts. And hey, it is bad, it has been awful. But it was awful two months ago, and no one wanted to acknowledge it. So perhaps we’re having a Realization Day when it comes to breadth. The number of stocks making new lows peaked on October 1st with Nasdaq at 528 and the NYSE at 447 on September 28th. Since then, the Russell went on to make a lower low, but the new lows contracted. The chart of the Hi-Lo Indicator is shown below.
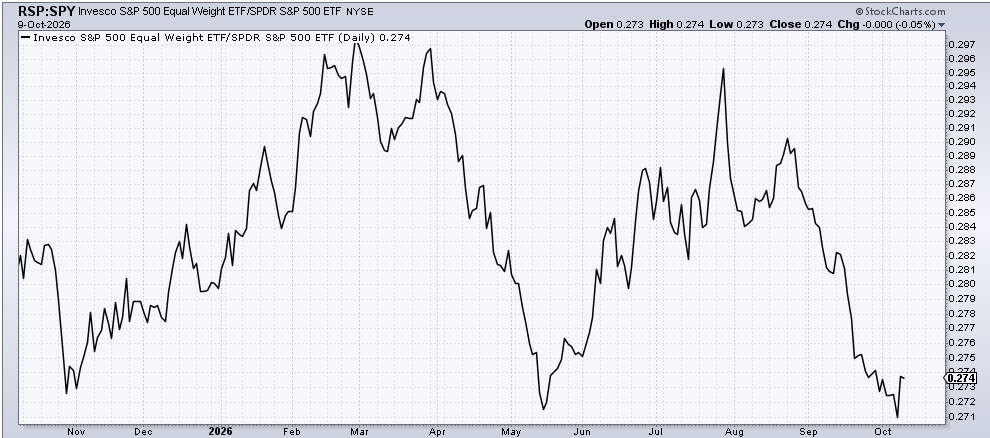
That, of course, brought me to the chart of the RSP relative to the S&P. It is lifting off a similar level to May, and the turn—if it is to be a turn—is the sharpest turn upward we’ve had since late August.
Now let me note that sentiment is not only complacent, it leans bullish. That remains a problem for me. Even the dour voters at the AAII had more bulls than bears this past week.
Then there are the charts. They are terrible. Having seen the top-down view feel a bit rosier for the ‘others’ I expected I would see individual stock charts that caught my fancy. That list is slim pickings.
I am inclined to think by midweek this week the rally that started last week runs out of steam, but my hope is that into whatever pullback we get, we start to see some charts of the others shape up.
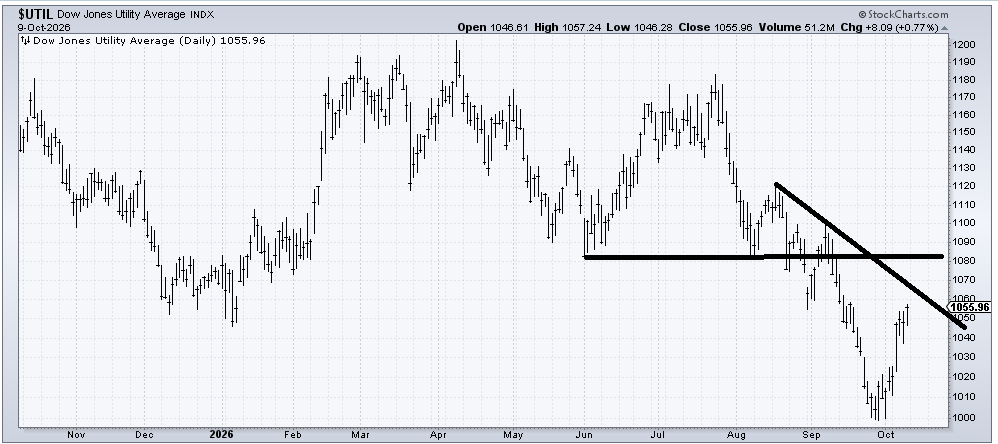
I will finish with the fact that the Utes finally rallied. They are up four percent, having made their low the day I left on vacation. There is resistance overhead, but this is the sort of move I thought we’d get in September (and was clearly very wrong).
New Ideas
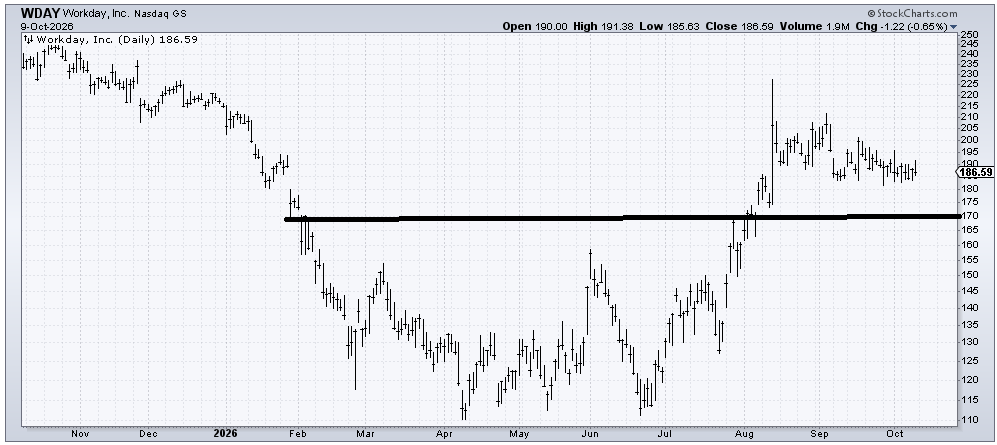
Software, unlike the semis, has been cranking upward. It’s hard for me to get excited over stocks that are up so much already (as a reminder, my pick in software has been Microsoft (MSFT), which is up against resistance, but that’s the worst you can say). But I did notice that Workday (WDAY) did not rally with the other software names. There had been a rumor about a takeover back in August that petered out. I think I would nibble at WDAY, especially if we see it drop near 180 or even toward that gap fill around 170-ish.
Today’s Indicator
The Hi-Lo Indicator is oversold and squint hard…it is turning up.
Q&A/Reader’s Feedback
Note: if you requested a chart and do not see it here, please put in another request because your stock probably got lost in the mess that is my desk.
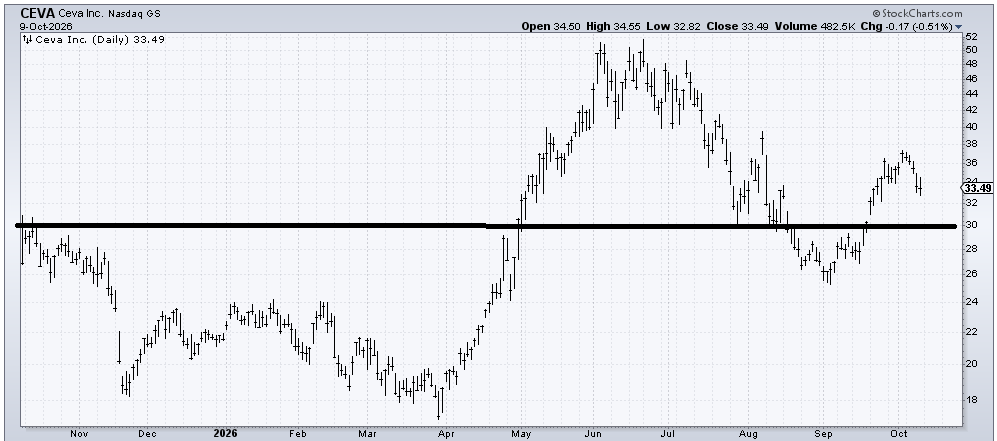
I don’t love the chart of Ceva (CEVA) because it looks like a failing rally. However, I suspect that if it gets into that 30 area, it will bounce from there and make another attempt at a rally, so the risk/reward is decent near 30.
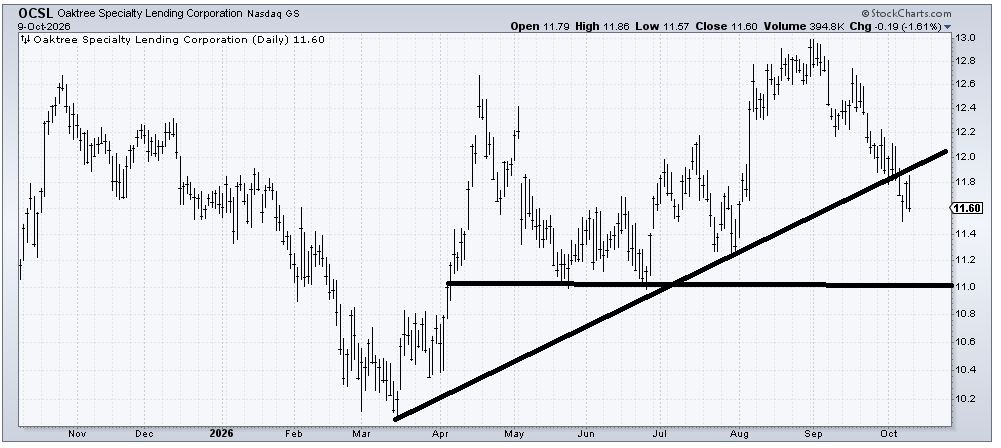
Oaktree Specialty Lending (OCSL) is coming into support. It has support all the way down to 11, but with the break of that uptrend line, I would say that unless it can recapture 12 in a hurry, it is more apt to languish between 11 and 12 than anything else.
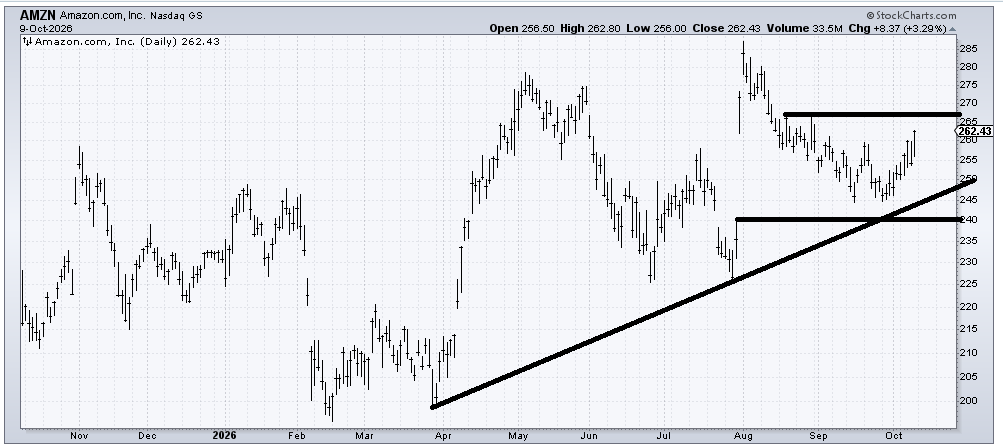
Amazon (AMZN) looks a bit stretched, or it certainly will if it gets to 265-270. However, the rounding under it did in my absence is a positive, so dips into that 250-255 area should be okay to buy.
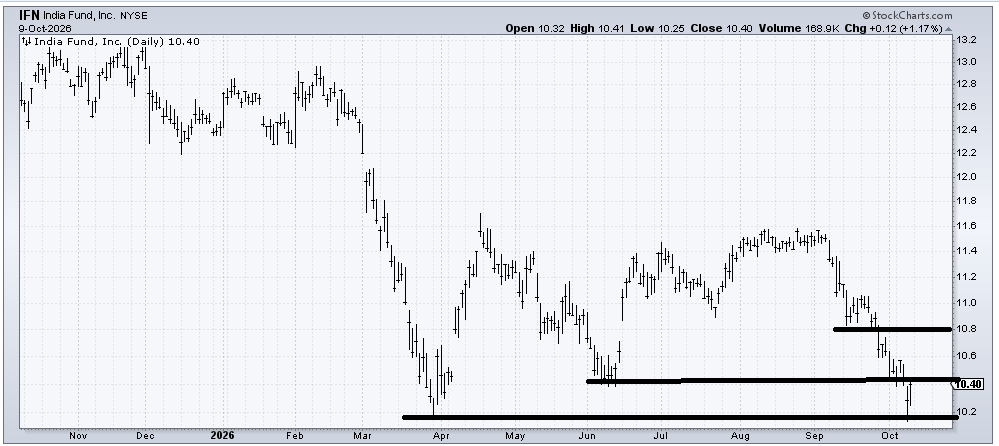
If India Fund (IFN) can get over 10.40 then I think it runs into trouble at 10.80-11. In other words, at best I see a trade right now, not much else.
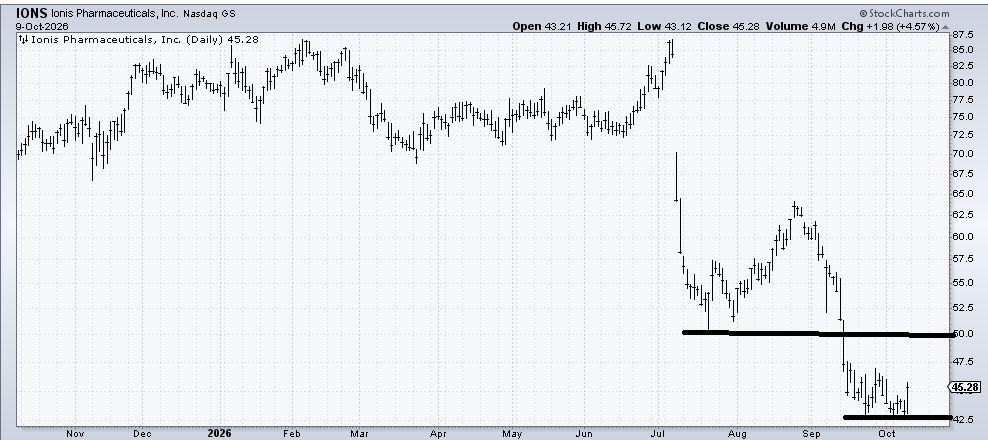
Ionis Pharmaceuticals (IONS) looks like a decent trade to me, especially if it can get over 47.50 because then 50 is the trouble spot. It’s not much but a move to 50 would be about ten percent.