Nvidia Against the World
The real question lies with the indicators.
You've reached your free article limit
You've read 0 of 1 free Pro articles.

Well, it wasn’t an either/or market unless you consider it was (NVDA) against the world. The real question is if the rally can continue.
There are those who have these statistics and data that tell us that the action we have seen over the course of the last week is bear market action. They say wild swings like we’ve seen tend to show up in bear markets. It probably is because the majority of stocks are in a bear market. Not the indexes, but stocks. But I will leave that to those who like to label the markets.
I can only share with you what my own work says. My own work says we can easily give back some of Monday’s rally on Tuesday. In fact, I think it would be rare for there to be much follow through on the upside after a day like Monday. So, what I want to discuss is if the indicators have changed.
The answer is no, they have not. We got a mini capitulation last week. I do not think we got full blown panic. But we were set to be short-term oversold early this week and we have seemingly run in every short now. As I always note, short covering is great but it takes real buying to keep us going.
How do we know Monday was shorts running for cover? The number of stocks making new highs is my tell. Last Wednesday, the NYSE saw 150 new highs. On Monday, it saw 55. Nasdaq is similar in that last week saw 258 new highs and Monday saw 120. The lower number of stocks making new highs tells us the majority of the upside action was in stocks that were down, not those that were up (i.e., no one was rushing to buy stocks that were still up last week).
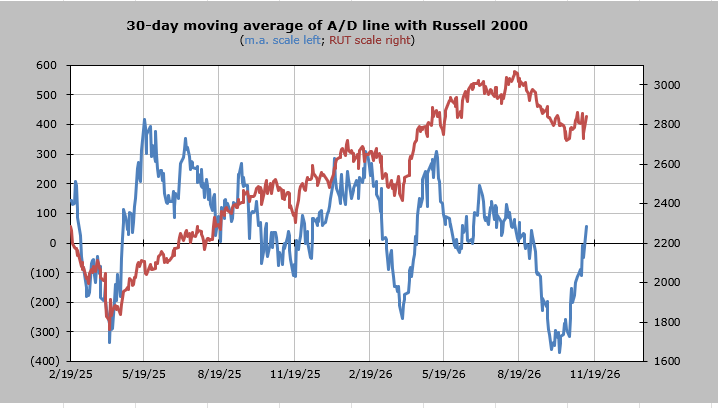
That having been said, breadth was good and the McClellan Summation Index is still rising. Yet I would not be surprised to see some downside on Tuesday. Down below you will see that the 30-day moving average of the advance/decline line (what I use as an intermediate term overbought/oversold oscillator) has finally gotten back over the zero line. I wouldn’t call it overbought now (having gotten oversold in late September/early October) rather I would just say it is no longer oversold.
New Ideas
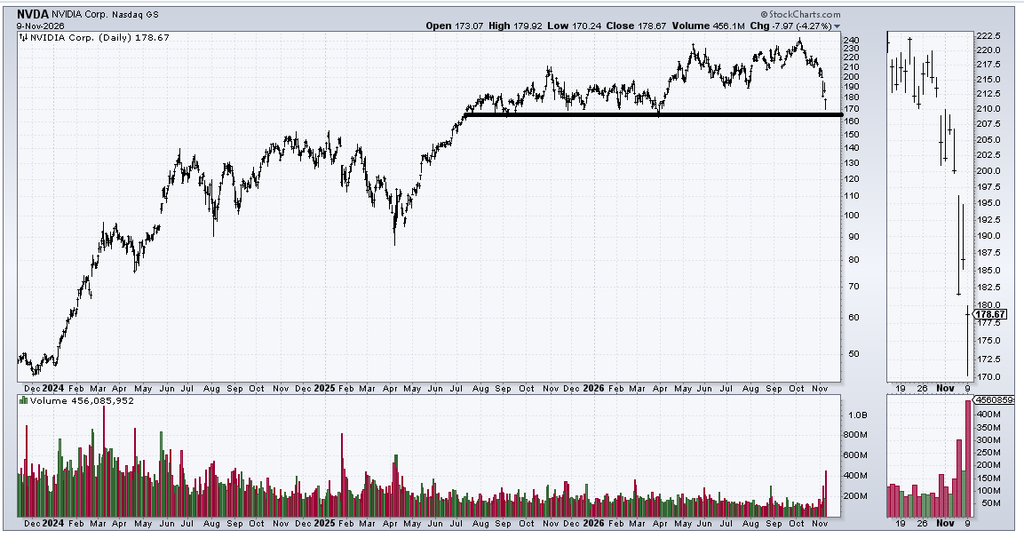
Let’s talk about NVIDIA, since it has come all the way down to support in the 165 to 170 area on this news. The volume was quite high but you can see, it is far from a record. There are a few options for the chart now.
First is, it gaps up over 182 on Tuesday leaving Monday as an island. I would give that a 15% chance. That is the bullish option. Another option is that it does something like Google (GOOG) did a few weeks ago, we give it three days to settle down and then it rallies (I give that a 70% chance). The third is that it can’t rally at all and instead breaks down under 160 (I give that a 15% chance).
There is one more option that I’m not sure what type of chance to give it: it has a lethargic rally — so no gap up, just creeps up into that 185 area with no energy — and then heads back down. That sort of action would be very bearish because that gives it a running start to break under 160.
My best guess is we wait three days and it starts to rally.
Today’s Indicator
The 30-day moving average of the advance/decline line is discussed above.
Q&A/Reader’s Feedback
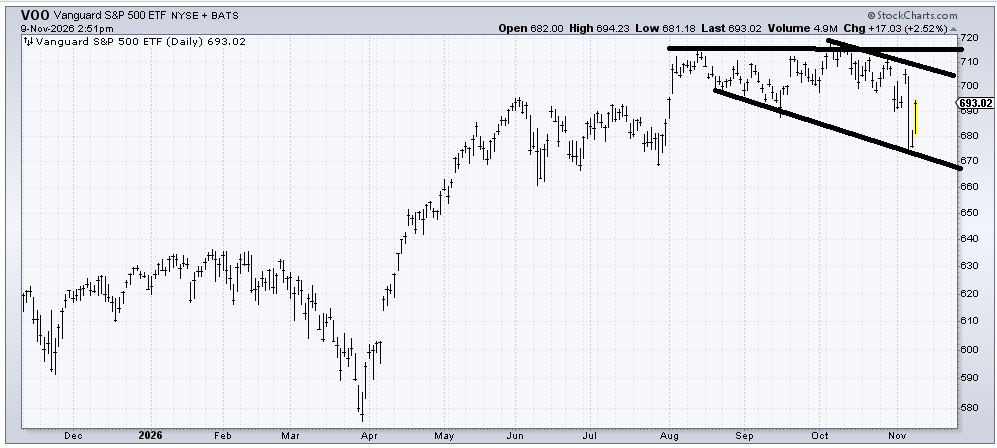
The chart of (VOO), an ETF to be long the S&P, is not a great chart and long time readers know I prefer to use the indicators on the indexes rather than the chart. With that having been said, I would say a rally into that 700 to 715 area is doable over the next week or two.
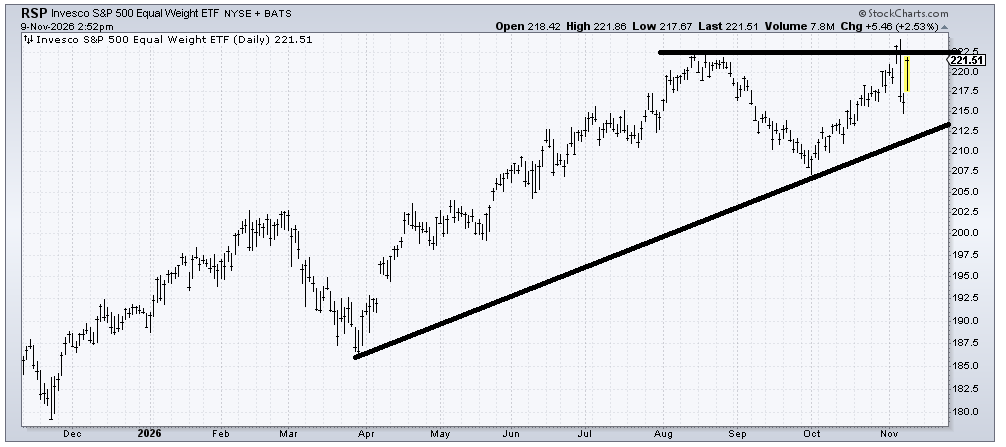
(RSP), an ETF to be long the others (equal weight S&P), is still OK, but I’m inclined to think a breakout right now is going to be a little difficult. Mostly as long as it stays over 210, I think it’s OK to hold.
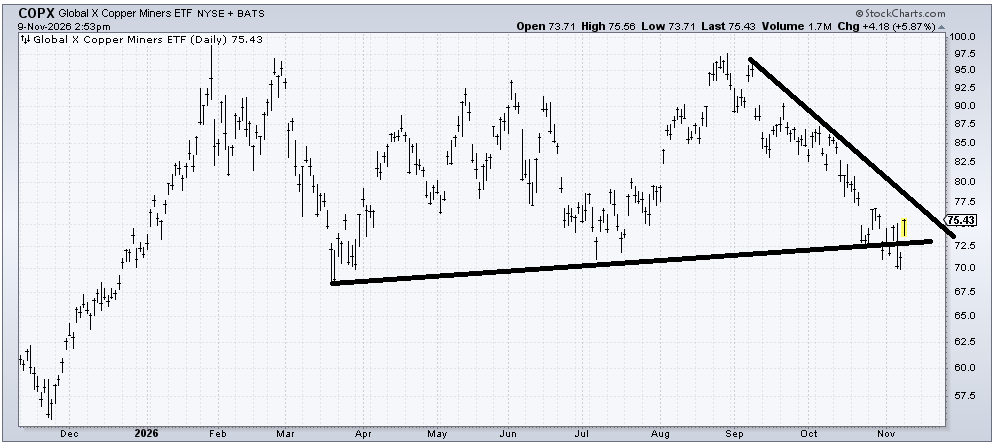
(COPX), an ETF to be long copper miners, is still not a great chart but it is oversold. If it breaks 70, I would head for the hills because that would complete the top.
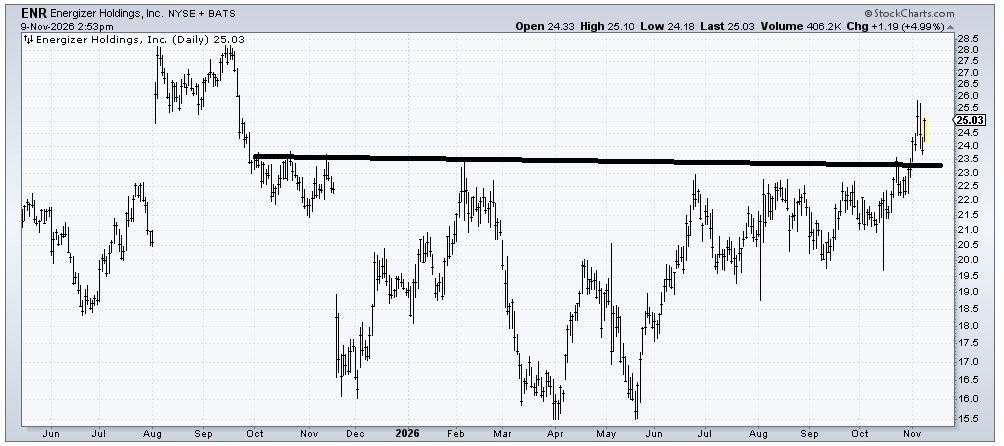
Energizer (ENR) on a short-term basis is overbought but as long as it stays over 23-ish I would stick with it because that is a base it broke out of. I just can’t chase it with the stock up 20% in the last few weeks.
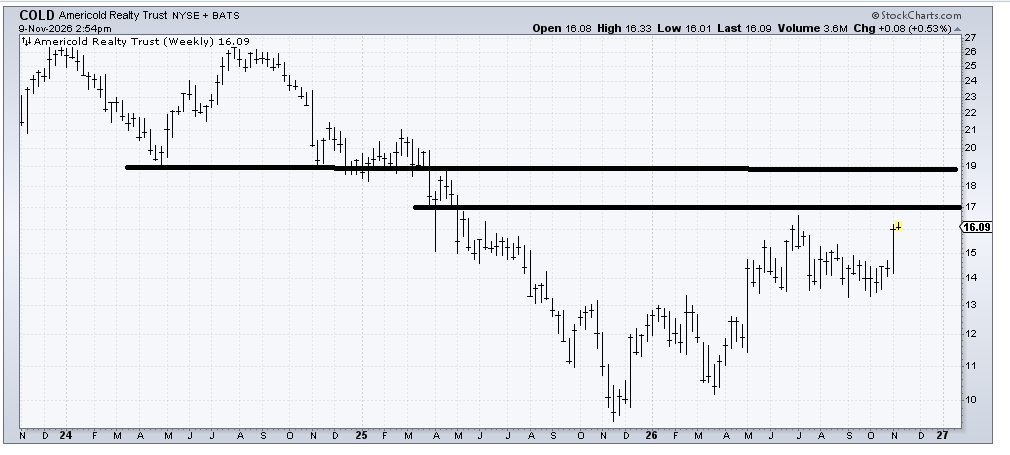
Americold Realty Trust (COLD) has a great ticker. I also felt the need to look at a thre-year weekly chart so we could see the resistance overhead. 17 to 19 is a trouble spot/resistance.
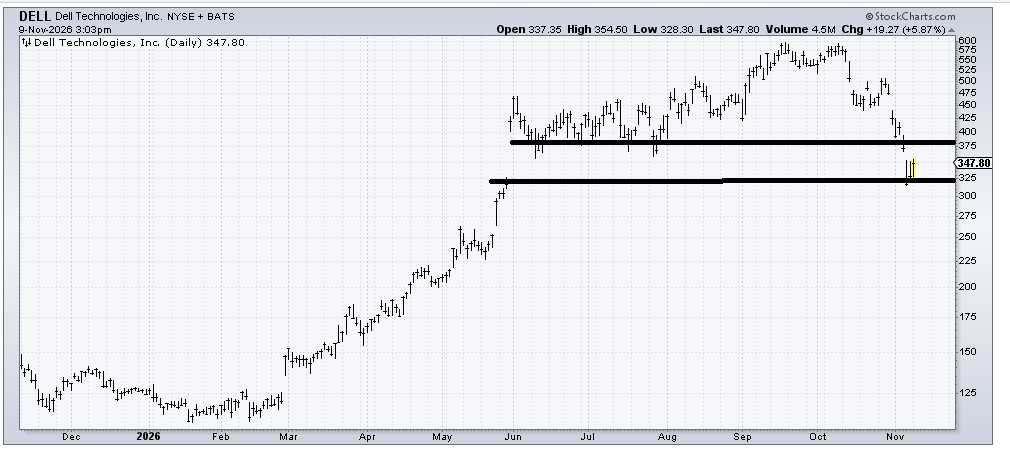
I feel the same way about Dell (DELL) this week as I did last week when we looked at it. It filled the cap below and is oversold so it ought to rally. But resistance is at 375 so I consider it a trade, that’s it.