Stock Market Today

Market updates and conversation from TheStreet Pro team. Follow the latest and join the conversation below.

Stock Market Today: October 26, 2026

Newest first ¡ All times Eastern ¡ 7 updates

DATE:
By Neil Sethi

2-Year Auction Sees Foreign Bid Ease But Record Domestic Demand

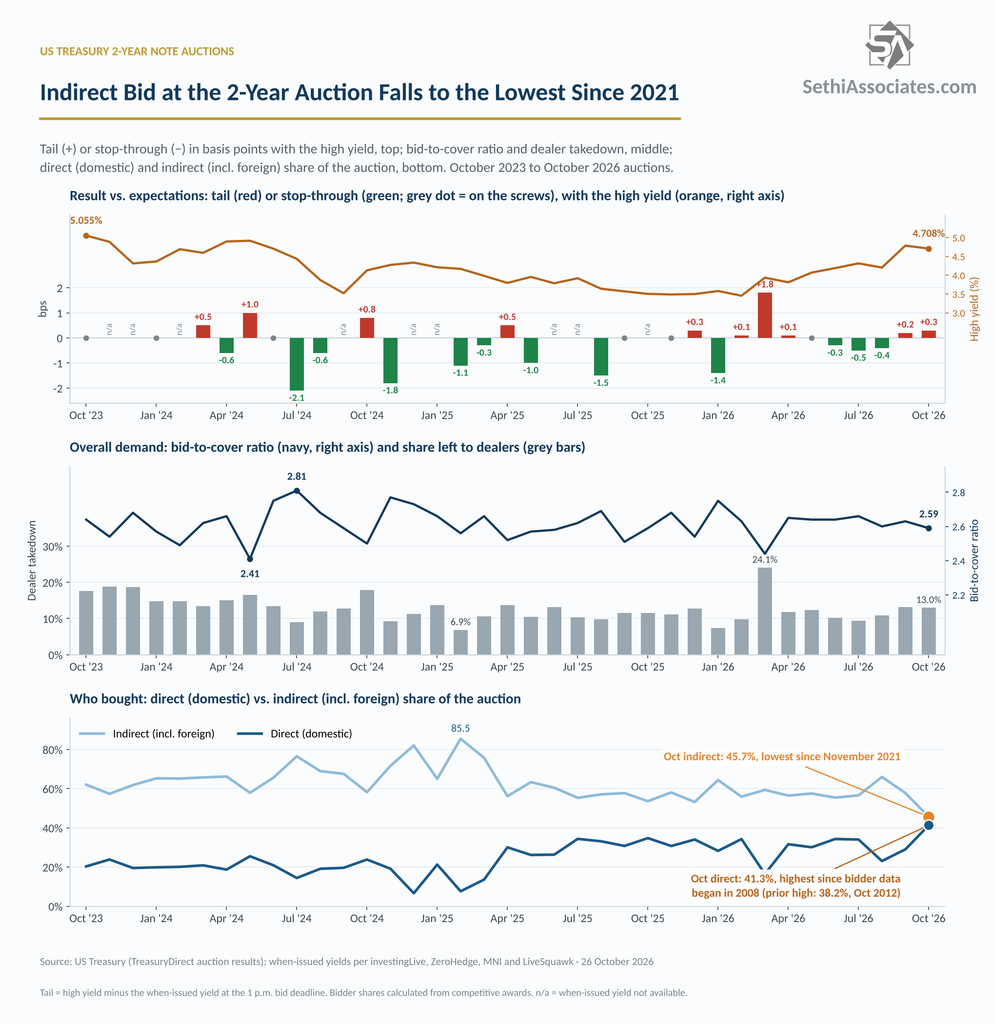
The first of this week’s three coupon (>1 year in maturity) Treasury auctions came today in $69 billion of 2-year notes, and while the end result was a bit soft, the mix of buyers stood out. Direct (domestic) bidders ended up with a record share after indirect bidders, a group that includes foreign buyers, fell to the lowest since November 2021.

The sale cleared at 4.708%, down from 4.787% in September, which was the highest since May 2024, and tailed (came in above expectations) by +0.3bps against a when-issued of 4.705%. That was the second straight tail, after +0.2bps in September, and compares with a 6-mth avg of a -0.2bps stop-through.

Looking at the rest of the metrics:

-Overall demand (bid/cover) fell to 2.59, the lowest since March, from 2.63 in September and below the 6-mth avg of 2.64.

-Indirect bidders (which include foreign buyers) dropped to 45.7%, the lowest since November 2021, from 57.8% in September and well below the six-month average of 58.3%.

-Direct (domestic) bidders jumped to 41.3%, the highest in Treasury data going back to 2008 (easily topping 38.2% in October 2012), from 29.0% in September and well above the six-month average of 30.4%.

-That left dealers (another metric of the strength of demand – the lower the better) with 13.0%, down from 13.2% in September but above the six-month average of 11.3%.

The indirect drop is worth watching, and comes on the heels of my post this morning about concerns that Japanese investors may be stepping back from Treasuries. Indirect bidders also include US funds, though, so Treasury’s investor-class data for October, released with a lag, will show how much of the pullback was actually foreign.
By Neil Sethi

France Gets a Reprieve

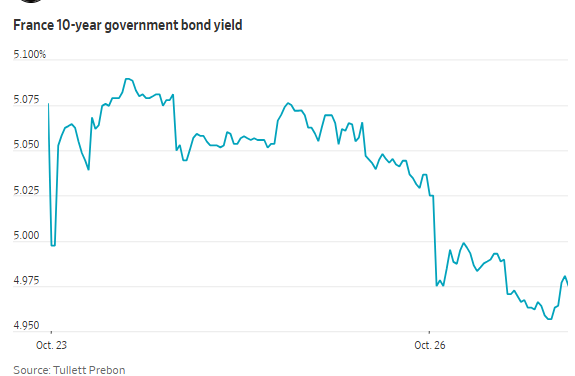
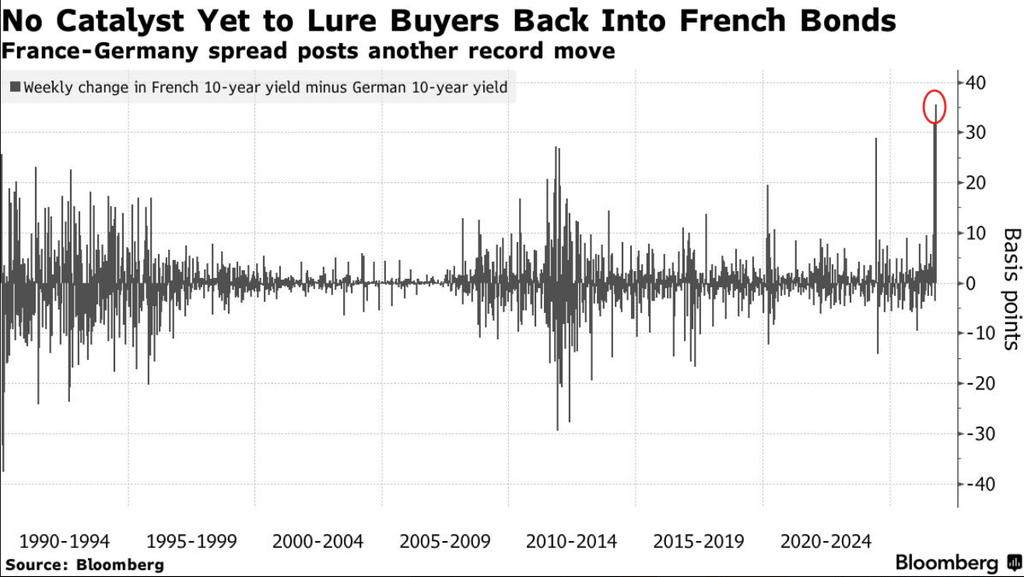
Investors were bracing for Moody’s ratings review on French debt, but the country got some relief Friday after a brutal week which saw the 10-year yield hitting 5% for the first time since 2002, and widening the most against German yields in records dating to 1990.

Heading into Friday most economists expected Moody’s to cut France one notch, from Aa3 to A1.

But it didn’t. Instead, Moody’s took no rating action, leaving France at Aa3 with a negative outlook. It said this wasn’t a credit action and seems to be waiting for more clarity on the budget. It also said higher borrowing costs would need to persist for an extended period to seriously hurt debt sustainability.

That has seen French bond yields ease back with “le spread,” as the French-German 10-year bond yield spread is apparently called, narrowing by 1.6 percentage points according to the Wall Street Journal.

The longer view though is sobering. France held AAA ratings from all three major agencies until 2012. Since then it has received 11 downgrades: four from S&P, four from Fitch and three from Moody’s. S&P and Fitch now rate France A+, which leaves Moody’s as the last of the big three still rating France in the AA tier.

The negative outlook keeps a downgrade on the table, and S&P reviews France again on Nov 27.

By Neil Sethi

AI’s Math Problem: $8.5 Trillion Needed, $3.6 Trillion Expected

Also catching headlines today: Bloomberg picked up a Gartner analysis from earlier this month showing a yawning gap between its forecasts for AI spending and AI revenue.

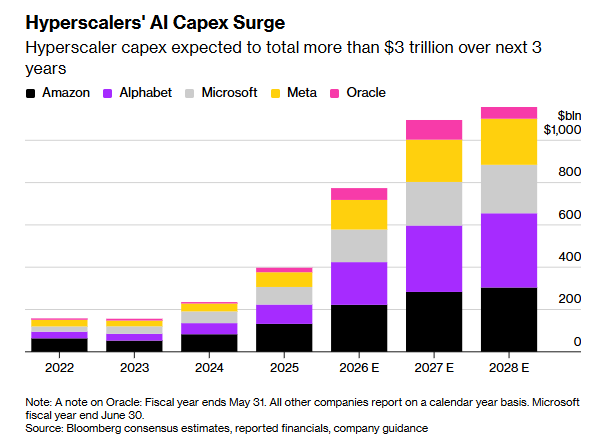
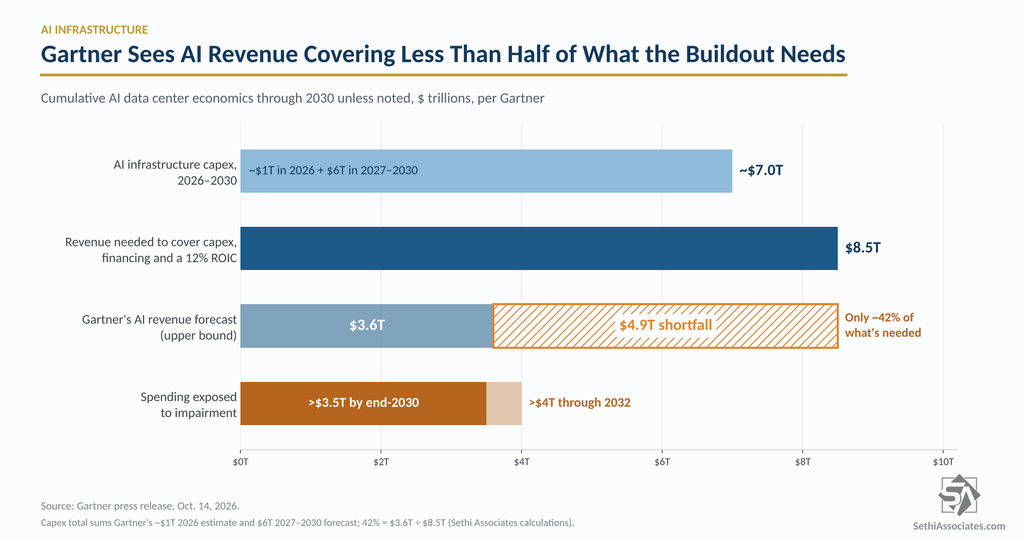
Gartner expects AI providers to spend nearly $1 trillion on AI infrastructure this year and another $6 trillion from 2027 through 2030.

Covering that spending, plus financing costs and a 12% return on invested capital, would take a cumulative $8.5 trillion in revenue through 2030. Gartner though forecasts no more than $3.6 trillion in enterprise and consumer AI revenue attributable to those data centers, about 42% of what’s needed. That leaves a roughly $4.9 trillion revenue gap, and more than $3.5 trillion of AI infrastructure spending exposed to impairment by the end of 2030, rising to more than $4 trillion through 2032. Gartner doesn’t expect that 12% return to be reached until the end of 2032 at the earliest.

The cloud math is no kinder. Gartner sees spending on AI-optimized infrastructure-as-a-service (IaaS) growing from $66 billion in 2027 to $174 billion in 2030. “The growth in spending on AI-optimized IaaS will be too low for most AI compute providers to recover their AI investments before the current generation of AI semiconductors is replaced,” said Gartner analyst Will Sommer. By my math, even that 2030 figure is only about 12% of the roughly $1.5 trillion a year Gartner expects AI providers to spend on infrastructure from 2027 through 2030.

Neoclouds are the most exposed. As Gartner notes, Microsoft (MSFT), Alphabet (GOOGL) and Amazon (AMZN) have diversified revenue that could sustain AI spending for years, while specialists like CoreWeave (CRWV) and Nebius Group (NBIS) need returns soon.

Gartner predicts more than 80% of neocloud providers will cease independent operations by 2030. “All of them want to be the full-stack. They can’t all be,” Sommer told Bloomberg. “For every dollar that’s spent on compute, only a fraction of that is going to the owners of compute.”

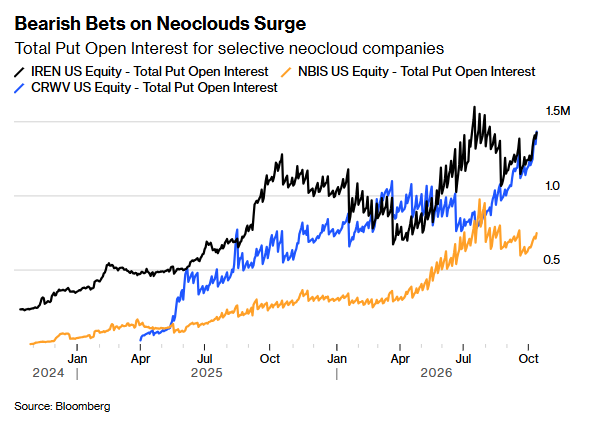
The options market is starting to brace for that. Put open interest in CoreWeave, Nebius and IREN (IREN) has climbed sharply this year, per Bloomberg.

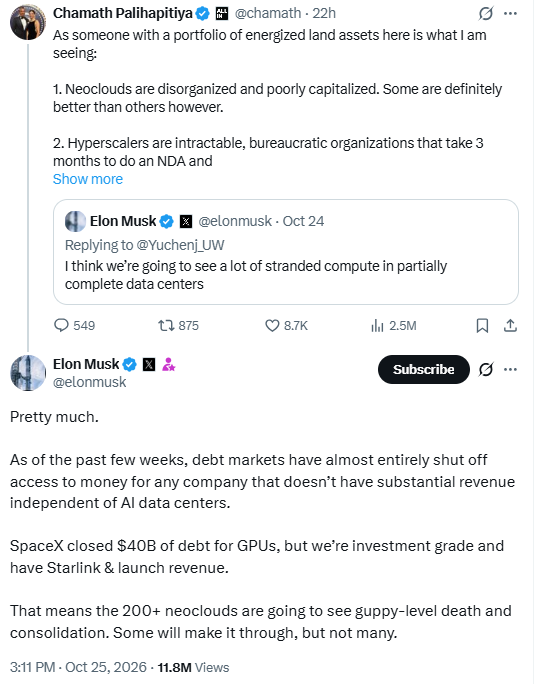
“Debt markets have almost entirely shut off access to money for any company that doesn’t have substantial revenue independent of AI data centers…That means the 200+ neoclouds are going to see guppy-level death and consolidation.” —SpaceX CEO Elon Musk in a tweet yesterday, in which he also said his company had secured $40 billion in debt financing.

By Neil Sethi

Expect Small Earnings From the Market’s Biggest Movers

While everyone will be focused on earnings from Alphabet (GOOGL), Microsoft (MSFT) and Amazon (AMZN) this week, a Wall Street Journal analysis shows they aren’t expected to contribute enough to third-quarter S&P 500 earnings growth to get their own callout in terms of needle-movers. That’s quite a change from the second-quarter season, when their “other income” was one of the biggest sources of upside surprise.

In contrast, Nvidia (NVDA) and Micron Technology (MU) alone account for about a third of the nearly 30% year-over-year growth in S&P 500 third-quarter earnings. That figure blends actual results from companies that have reported with estimates for those that haven’t. Just 10 companies account for nearly two-thirds of that growth. Along with Nvidia and Micron, they are Broadcom (AVGO), Exxon Mobil (XOM), EchoStar (SATS), Sandisk (SNDK), Marathon Petroleum (MPC), Meta Platforms (META), Chevron (CVX) and Valero Energy (VLO).

By Neil Sethi

Meta Wastes No Time

That didn’t take long. When Meta Platforms (META) unveiled its new non-voting Class C shares alongside earnings last week, I noted that its filing showed management’s long-range plan needing to raise “hundreds of billions of dollars” beginning as early as this fall. The filing also said the company “expects to conduct offerings of Class C common stock from time to time.”

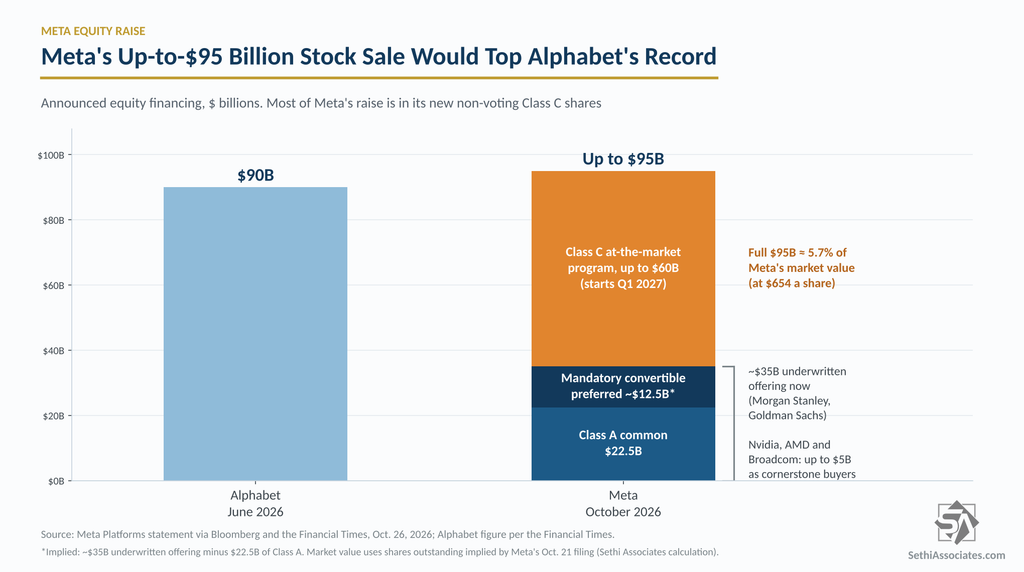
On Monday it got started. Meta is seeking to raise as much as $95 billion by selling common and preferred stock, per Bloomberg. About $35 billion is being offered now, roughly $22.5 billion in Class A common and the rest in mandatory convertible preferred. The remaining roughly $60 billion will come through an at-the-market program in the new Class C shares, which the Financial Times says is expected to begin in the first quarter of 2027.

Nvidia (NVDA), Advanced Micro Devices (AMD) and Broadcom (AVGO), all Meta chip suppliers, have agreed to buy up to $5 billion of the common as cornerstone investors. Morgan Stanley and Goldman Sachs are leading the deal.

If fully executed, Meta’s raise would top Alphabet’s $90 billion June offering, which lead bookrunner JPMorgan called the “largest multi-tranche equity transaction in history,” per the FT. At about $654 a share, the full $95 billion is roughly 5.7% of Meta’s market value.

The timing fits what Meta’s special committee flagged in the filing: it wanted to front-run potential equity offerings from Alphabet (GOOGL), SpaceX (SPCX), Anthropic and OpenAI. Alphabet has raised once already, SpaceX completed the biggest-ever IPO in June, and Anthropic is expected to list before year-end, per the FT.

One wrinkle: because the Class C shares won’t exist until January, this first tranche is voting Class A stock. According to Claude, the $22.5 billion of Class A trims CEO Mark Zuckerberg’s voting control voting control only modestly, to about 60.2% from 60.6%, before any conversion of the preferred. The $60 billion ATM goes into the non-voting shares, so it won’t dilute his control at all.

It appears this was priced in by the market with Meta shares little changed as of 8:30 am ET.

At the time of publication, in terms of securities mentioned, Sethi was long META, NVDA, GOOGL, and SPCX and short AMD.

By Neil Sethi

Is Japan Selling of Treasuries a Risk?

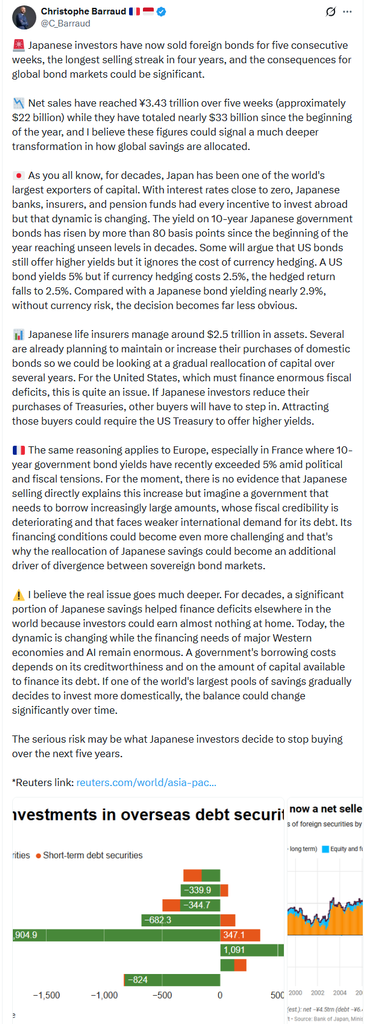
Economic analyst Christophe Barraud, Head of Discretionary Management and Research at LIOR GP, had an X post last week with his thoughts on the selling by Japanese investors in global bonds “for five consecutive weeks, the longest selling streak in four years.” [post at the bottom].

As he noted, “the consequences for global bond markets could be significant,” with Japanese yields now trading above US equivalents once hedging costs are taken into account.

“Japanese life insurers manage around $2.5 trillion in assets. Several are already planning to maintain or increase their purchases of domestic bonds so we could be looking at a gradual reallocation of capital over several years.”

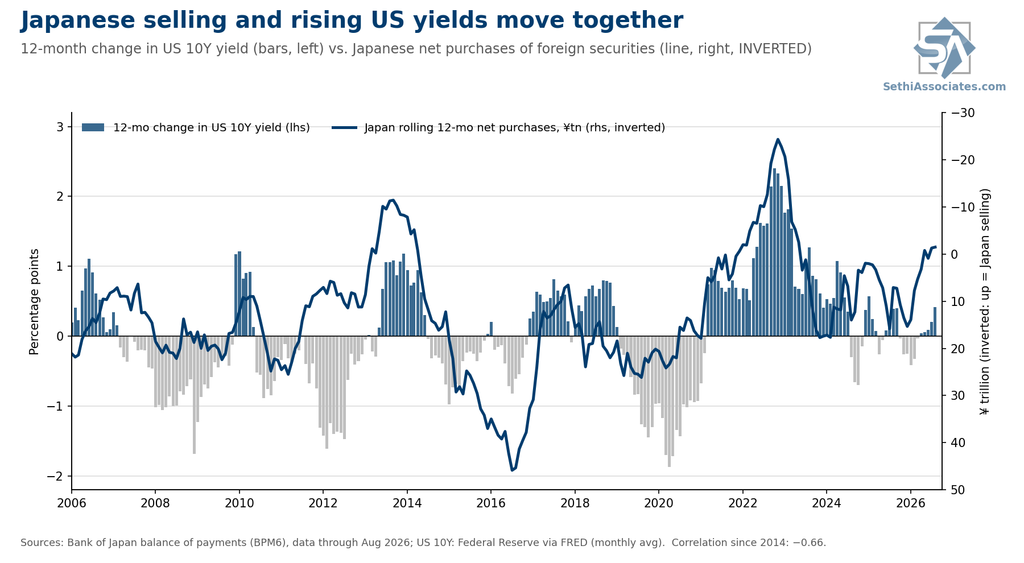
Given that backdrop, I had Claude do an analysis of how Japan’s flows line up with US 10-year yields, using Bank of Japan data on Japanese net purchases of foreign securities. Its takeaways were consistent with the risk Christophe flagged:

1. Japan flows do have a strong correlation with the change in 10-year yields. Comparing rolling 12-month net purchases to the 12-month change in the US 10Y results in a correlation of about −0.66 since 2014. That is consistent with Japanese selling driving yields. The 2013 taper tantrum and 2022 stand out.

2. Neither series, though, conclusively leads the other; the fit is tightest when both are measured over the same period. So while that’s consistent with Japanese selling pushing yields up (which makes a lot of sense), it is equally consistent with sharp rises/drops in yields and hedging costs pushing/pulling Japanese investors out/in. In 2022, the cost of hedging dollars back into yen went from roughly 0.2% to over 4%, and Japan sold a record amount of foreign bonds.

3. Flows have little correlation with a given level of 10-year yields. The correlation between Japan’s rolling 12-month net purchases and the US 10Y level is weak: about −0.14 since 1997 and −0.4 since 2014.

So it seems the reallocation risk is very real if higher Japanese yields do pull flows back home.

By Neil Sethi

A Quiet Start to the Week

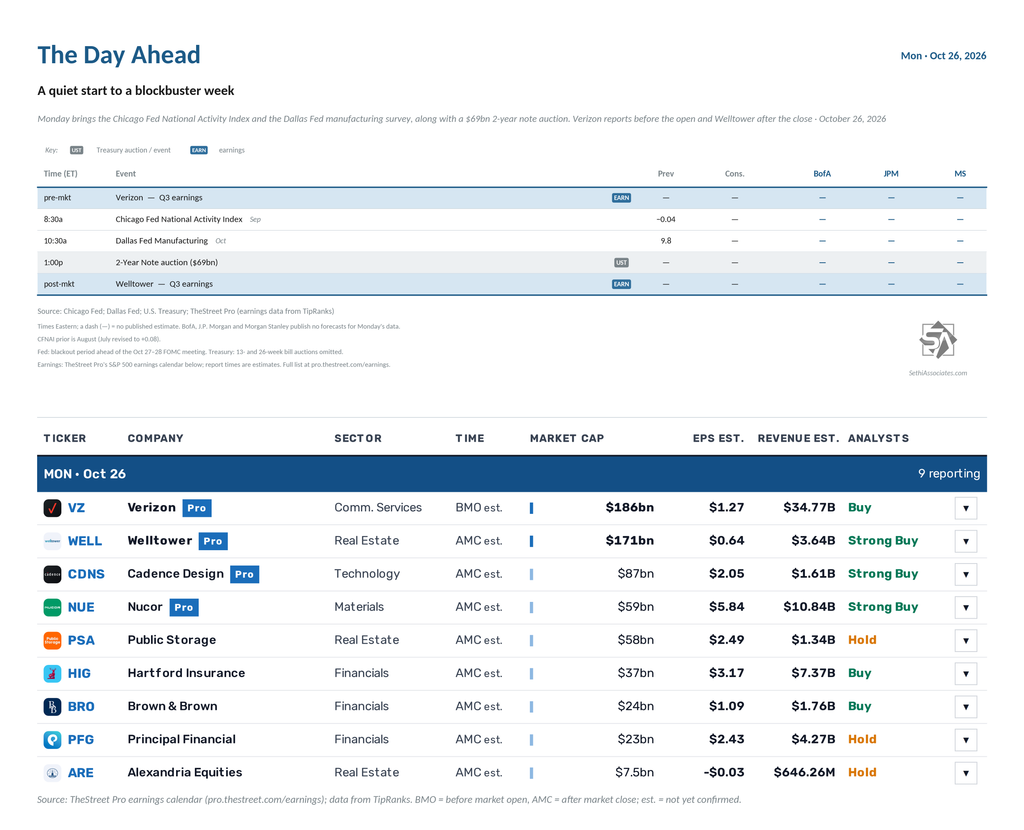
It’s a quiet start to a busy week for US economic data, with October’s Dallas Fed manufacturing survey and September’s Chicago Fed National Activity Index the only reports.

The Fed remains in its blackout period ahead of the October 27–28 FOMC meeting, so there are no Fed speakers.

Non-Bill (>1yr in maturity) US Treasury auctions include a $69bn 2-year note auction.

Nine S&P 500 components report, two of them with market caps over $100bn:

  • Before the open: Verizon (VZ)
  • After the close: Welltower (WELL), Cadence Design Systems (CDNS), Nucor (NUE), Public Storage (PSA), The Hartford (HIG), Brown & Brown (BRO), Principal Financial (PFG) and Alexandria Real Estate Equities (ARE)

Conversation 0 Comments

One ongoing discussion across all days. Everyone can read; sign in to take part.

Your voice matters. Discussions are moderated for civility. Read our guidelines .

Log in to join the conversation

Loading comments...