Weekly Roundup: Geopolitics Wins Out, But Portfolio Continues to Outperform
We added to three holdings and laid out what we’re watching for several others.
You've reached your free article limit
You've read 0 of 1 free Pro articles.
It was a down week for the market, with the S&P 500, Nasdaq Composite and Pro Portfolio giving back some of the gains built up over the prior few weeks. It was one of those weeks where geopolitics, the bond market, and retail earnings were all fighting for headline space, and by Friday it was pretty clear geopolitics won.
Iran’s Supreme National Security Council said it would keep the Strait of Hormuz effectively closed to shipping until the U.S. “corrects its behavior,” and the U.S. countered with a blockade of its own on Iranian ports. Then on Thursday, President Trump raised the stakes, threatening what he called an “Economic D-Day” against Tehran — sweeping new sanctions plus secondary sanctions on any country or company doing business with Iran. Tehran fired back, and the whole exchange read to markets as “talks-are-off,” not “talks-are-close.” Comments from U.S Treasury Secretary Bessent point to more details being shared on Monday, and that means we will want to parse the plan, game out its impact, and assess Iran’s response.
The above led oil prices to multi-week highs, with gas, diesel and other prices following that move. To us, the barometer to watch is rather straightforward — Strait traffic, and what it does not only to oil and petrochemical prices, but larger supply chains. In our Friday alert discussing the findings from S&P Global’s Flash August PMI report, we flagged the following:
…supply chain delays remain widespread, with supplier delivery times lengthening in August to one of the greatest extents seen over the past four years, blamed on shipping delays, tariffs and diminished stock availability at suppliers.
As that unfolded, the 30-year Treasury yield pushed above 5.25% this week, within shouting distance of two-decade highs, and the 10-year sat around 4.69% to 4.71%. Yields dipped briefly on the news that the Treasury would double its debt buyback operations to $4 billion per issue, and the follow-up comment from Bessent that he was ready to go even bigger. By Thursday the relief had evaporated following reports the U.S. national debt was more than $40 trillion. While some are calling Bessent the most interventionist Treasury chief in sometime, we also see him attempting to jawbone the market back from the edge. So far that is having little impact.
On the macro data front, S&P Global’s flash August PMI report was a bright spot. The composite reading jumped to 56.0 from 54.5 in July, the strongest pace of private-sector growth since April 2022. Services led the way, hitting their best clip since December 2024, while manufacturing was the laggard, posting its weakest gain in 13 months. Digging deeper into the report, employment growth accelerated to its fastest pace since early 2025, business confidence improved, and price pressure moderated.
The bottom line is that this report is a positive one for the economy and it should, at least for now, temper concerns over higher oil prices. Before one breaks out the bubbly, however, let’s remember we will get several more pieces of August economic data before the Fed concludes its September policy meeting on September 16. As of now, the odds of the Fed standing pat with federal funds rate is around 64%. To the extent the coming data reaffirms today’s Flash August PMI findings, we should see that probability rise.
Reviewing the above, we’re not surprised the market gave back some of its gains this week. Remember, last week we pointed out the market was getting complacent and shared a few factors that could lead to a pullback. That’s why we opted to walk a prudent path with the Portfolio, putting only some capital to work this week.
We’ll discuss those three moves below, but they reflect following the data, not a knee-jerk reaction. We’ll continue to let the data guide our decisions and any action we take and be mindful of potential turbulence. We could have more of that starting on Monday, subject to details behind the White House’s “Economic D-Day” plans for Iran and its allies. As we navigate that, we’ll keep our focus on the longer-term.
As we assess incoming data and how that may change the playing field, we will continue to follow the capital being spent by companies, governments, and consumers. Our focus will remain on the companies best positioned to benefit from that tailwind as well as other tailwinds tied to our investment themes. Our emphasis on prospects for superior earnings growth also remains in place, as is our willingness to be opportunistic when the time is right.
That has been a smart playbook for the Portfolio so far this year, and we see no reason why that would change. If we do, we’ll replot our course as needed.
Enjoy your weekend, and we’ll see you back here, bright and early on Monday.
Catching Up on the Portfolio This Week
As mentioned, it was a challenging week for the market, and we felt that reverberate through the Portfolio. However, while we had a setback, we continued to outpace the S&P 500 on a quarter-to-date and year-to-date basis.
We took advantage of the market’s move lower to expand our holdings in a few positions. On Wednesday, following the reaction to quarterly results and guidance from TJX Cos. (TJX), we scooped up more TJX shares for the Portfolio — perhaps a tad prematurely given the market’s reaction to quarterly results and guidance from Walmart (WMT) that pressured retail companies. That added pressure on TJX shares pushing them into an oversold condition, making for an incrementally favorable risk-reward tradeoff in the name.
Friday, we added to our positions in Broadcom (AVGO) and Costco (COST) near $374.50 and $935, respectively. As we explained in our trade alert, our bite sizes were on the smaller side for two reasons. One, should we see a snapback in these stocks that leads them to bump up against our position-size limits, we do not want to be forced to trim them back prematurely. Second, on Thursday, we shared potential pick-up points we are watching for Builders FirstSource (BLDR), Applied Materials (AMAT), Paccar (PCAR), American Express (AXP), First Trust Nasdaq Cybersecurity ETF (CIBR), Eaton (ETN), Alphabet (GOOGL), Meta (META), and Waste Management (WM).
With around 7.8% of the Portfolio’s holdings in cash, subject to what develops, we have room to maneuver with more than a handful of holdings. Decisions will be based on a combination of fundamental factors, position size and upside potential versus downside risk.
To aggressively push the bulk of the Portfolio’s cash into action, we would need to see a steeper pullback in the S&P 500 or the Nasdaq Composite develop. With relative strength index levels above 54 and 51 for the S&P 500 and Nasdaq Composite, that would take a sizable drop from current levels. That gives us another reason to slow walk any efforts to put additional cash to work.
Now let’s see what others on Wall Street had to say about the Portfolio’s holdings during the week:
Monday: Rothschild & Co Redburn upgraded Apple (AAPL) to Buy from Neutral with a price target of $400, up from $260. Morgan Stanley lowered its price target on Applied Materials to $642 from $646, while UBS reset its target at $675, down from $705.
Tuesday: TD Cowen lifted its Marvell (MRVL) target to $225 from $200. Argus upped its Applied Materials target to $600 from $500.
Wednesday: Rosenblatt Securities resumed coverage of Google shares with a Buy rating and did the same with Amazon (AMZN) shares.
Thursday: BMO Capital initiated coverage on the shares of Nvidia (NVDA), Marvell, Broadcom (AVGO), and Eaton with Outperform ratings and price targets of $340, $250, $455 and $500, respectively. Roth Capital boosted its price target on MRVL shares to $350 from $275. Evercore ISI trimmed $2 from its TJX target, leaving it at $173. JPMorgan made a similar move taking its TJX target to $178 from $181. UBS lifted its TJX target to $198, and the firm also added $10 to its MRVL target, landing it at $310.
Friday: Citi increased its Marvell price target to $275 from $225, while Oppenheimer lifted its MRVL target to $300 from $250. Citizens initiated coverage of Builders FirstSource with a Market Perform rating and no price target.
Key Global Economic Readings
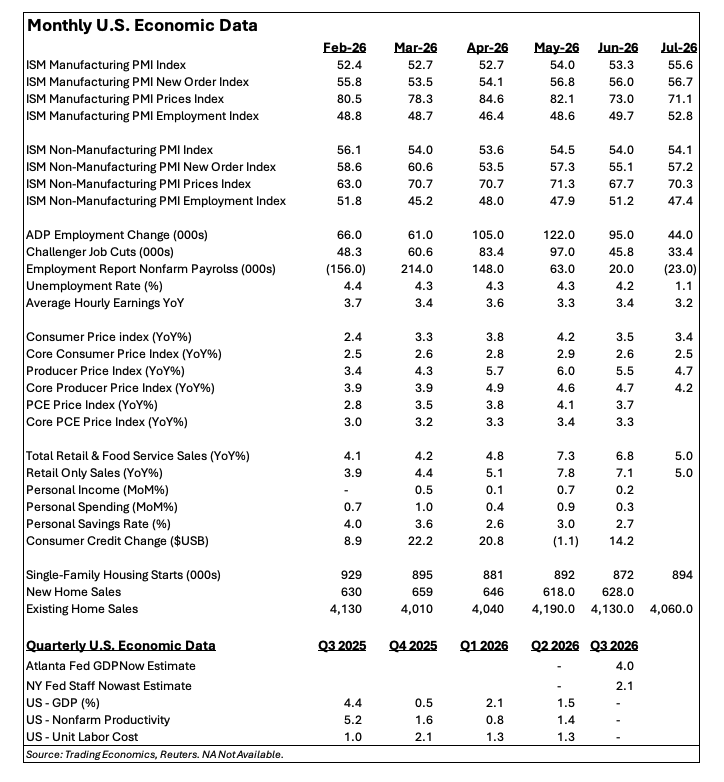
Chart of the Week: iShares Silver Trust (SLV)
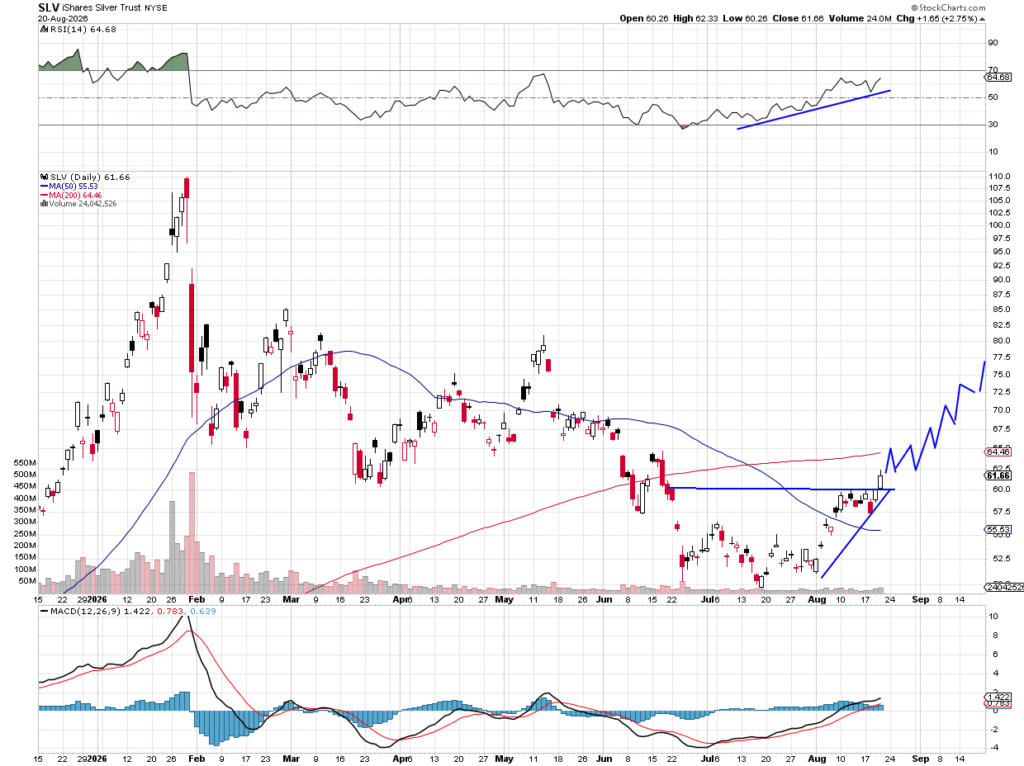
Since the start of August, we have seen solid performance by precious metals. Gold gets all the headlines, but let’s look at silver, which has performed well, but is lagging the yellow metal. This may be the time to look closely at silver as it tries to push through some stiff resistance and regain the dominant trend from January.
No question silver has had a monstrous year. Since breaking out above $30 in 2025 the metal went bananas, rising at one point to $110. The SLV, or the Silver Trust ETF, which tracks closely with the metal, failed to rise past that level and simply crashed down in a couple of days after a historic month of January. The rise in first month of 2026 was a stunning 64%, but the metal lost all those gains and then some in a gruesome selloff.
Since then, silver has been flat to lower, finding few buyers or long-term holders, until recently. Momentum has returned to silver; a move above the 50-day moving average last week was critical, the first time holding above that level since May (when silver was in a steep downtrend).
Indicators are not overbought yet, but the 200-day moving average looms as resistance. However, if we consider gold as the model for silver it may just blast right through without hesitation, as gold did this week. Where might silver run to? The logical spot is the May high at $80, but it may not stop there if we keep a pattern of higher highs, higher lows.
We know what was driving silver in January, a heavy dose of short-covering and momentum buyers piling in. There is about 4.5% of the SLV float that is short silver, about 1.7 days to cover but that could be enough time to press the ETF through to higher levels.
Other charts we shared with you this week were:
Monday, August 17: S&P 500 – Record Territory, But Is the Market Too Complacent?
Monday, August 17: American Express (AXP) – American Express Builds Energy for Its Next Move
Tuesday, August 18: TJX Companies (TJX) – TJX Price Isn’t Budging, But Will Earnings Force a Move?
Wednesday, August 19: United Rentals (URI) – Who Needs AI When You Have United Rentals?
Thursday, August 20: Meta (META) – Meta’s Not Lookin’ So Hot
The Week Ahead
Normally as we approach the end of a month, like we are next week, we look forward to the details provided by the Personal Income and Spending data as well as the insight granted by the Personal Consumption Expenditure Price Index. Following the encouraging signs we saw in Friday’s Flash PMI data from S&P Global about inflation pressures, job creation, and order books in August, we will look for more confirming signs in upcoming economic data.
Still we won’t totally ignore the July PCE Price Index data, but should oil, gas, diesel and other prices continue to move higher, that will be far more telling. With that in mind, we’ll be watching what U.S. Treasury Secretary Scott Bessent announces on Monday regarding economic sanctions on Iran and its allies. We’ll also look to see what Iran’s response is over the ensuing days, and fine tune our thinking as needed.
Considering the chart we shared showing the relationship between headline CPI figures and those for year-over-year average hourly wage growth, we’ll perform a similar review for the year-over-year gains in July Personal Income against the July PCE data.
As we’re doing all of this, we’ll also be getting ready for what Fed Chair Kevin Warsh has to say when he delivers his remarks at the 2026 Jackson Hole Economic Policy Symposium. Earlier this month, the Financial Times reported that Warsh “acknowledged that he had made mistakes in his first 10 weeks at the helm of the world’s most important central bank, including failing to reinforce his key messages on price stability and sowing confusion over whether his longer-term plans to reform the Fed could affect near-term policy decisions…”
That, along with what we’ve seen so far this month with energy prices and comments found in the August Flash PMI, suggest there could be some table resetting work by Warsh. Given his comments about letting the market follow the data, we aren’t expecting the chair to telegraph his thoughts on monetary policy ahead of the following week’s jam-packed week of economic data. Among the bunch of economic releases that week will be the August Employment Report. Following the big revisions and loss of 23,000 jobs found in the July report, you can bet the August one will be perused multiple ways with an eye toward the economy and monetary policy.
Here’s a closer look at the economic data coming at us next week:
U.S.
Monday, August 24
Chicago Fed National Activity Index (July) – 8:30 AM ET)
Tuesday, August 25
ADP Employment Change Report – (Weekly) 8:15 AM ET
FHFA Housing Price Index (July) – 9:00 AM ET
S&P Case-Schiller Home Price Index (July) – 9:00 AM ET
Consumer Confidence (August) – 10:00 AM ET
New Home Sales (July) – 10:00 AM ET
Wednesday, August 26
MBA Mortgage Applications Index – (Weekly) 7:00 AM ET
Personal Income & Spending (July) – 8:30 AM ET
EIA Crude Oil Inventories – (Weekly) 10:30 AM ET
Thursday, August 27
Initial & Continuing Jobless Claims – (Weekly) 8:30 AM ET
EIA Natural Gas Inventories – (Weekly) 10:30 AM ET
2026 Jackson Hole Economic Policy Symposium
Friday, August 28
Chicago PMI (August) – 9:45 AM ET
University of Michigan Consumer Sentiment – Final (August) – 10:00 AM ET
2026 Jackson Hole Economic Policy Symposium
International
Monday, August 24
China: Foreign Direct Investment (July)
Tuesday, August 25
China: National People’s Congress
Wednesday, August 26
China: National People’s Congress
Thursday, August 27
China: National People’s Congress
China: Industrial Profits (July)
Friday, August 28
Eurozone: Economic Sentiment & Consumer Confidence (August)
As we approach the end of August, the largest holding in the S&P 500, Nvidia (NVDA), is reporting after Wednesday’s market close, and Marvell (MRVL) on Thursday. Rising capex spending from hyperscalers and neoclouds should allow both companies to deliver robust year-over-year top and bottom-line growth with guidance for more to come in the quarters ahead. Helping support that view, this week, China started to accept shipments of Nvidia’s H200 chips and Nvidia said it is working on specialized AI inference chips for China that could ship by the end of this year. meanwhile, Marvell inked an expanded relationship with Google (GOOGL) for custom silicon, and we discussed its big potential with you this past Wednesday.
As we reflect on those reports, we’ll also be mindful of what Salesforce (CRM) says next week about AI adoption and usage, being sure to size up its bookings and remaining performance obligations against those for its April 2026 quarter.
In addition to those two Portfolio companies reporting, we’ll continue to update our thinking about the consumer as we hear from others in the retail space. We will continue to compare comp sales figures for the period, and what that tells us about where consumers are choosing to spend.
Here’s a closer look at the earnings reports coming at us next week:
Monday, August 24
Open: PDD Holdings (PDD)
Tuesday, August 25
Open: Dick’s Sporting Goods (DKS)
Close: Box (BOX), Heico (HEI), Intuit (INTU)
Wednesday, August 26
Open: Abercrombie & Fitch (ANF), Bath & Body Works (BBWI), Dycom (DY), JM Smucker (SJM), Kohl’s (KSS)
Close: Agilent (A), CrowdStrike (CRWD), HP (HPQ), Nvidia (NVDA), Okta (OKTA), Salesforce (CRM), Synopsys (SNPS), Urban Outfitters (URBN)
Thursday, August 27
Open: Best Buy (BBY), Burlington Stores (BURL), Canadian Solar (CSIQ), Dollar General (DG), Dollar Tree (DLTR), Hormel Foods (HRL)
Close: Affirm (AFRM), Elastic (ESTC), Gap (GAP), Marvell (MRVL), SentinelOne (S), Ulta Beauty (ULTA), Workday (WDAY)
Portfolio Investor Resource Guide
Economic Data: Here’s a List of Links to the Key Economic Data We Closely Watch
Investing Terminology: 16 Key Terms Club Members Should Know
10-Ks: Want to Know About a Stock? Read the Company’s Reports
10-Qs: Unlock the Numbers and Key Information Behind Your Stock With the 10-Q
Income Statement: Our Cheat Sheet to Understanding This Financial Document
Balance Sheet, Cash Flow Statements, and Dividends: How to Know If a Company Is Off-Kilter? Read Its Balance Sheet
Valuation Metrics: Everyone Wants a Value. Here’s How Investors Can Find
Thematic Investing 101 Webinar
Like the Benefits of ETFs? Let’s Talk About Models
The Portfolio Ratings System
1 – Buy Now (BN): Stocks that look compelling to buy right now.
2 – Stockpile (SP): Positions we would add to on pullbacks or a successful test of technical support levels.
3 – Holding Pattern (HP): Stocks we are holding as we wait for a fresh catalyst to make our next move.
4 – Sell (S): Positions we intend to exit.