Continued Broadening Lifts S&P 500 to First Record Since August
The S&P notched its first record close since August on a continued broadening as Treasury yields remained subdued. The Nasdaq added a second straight record, but small-caps gave up an early gain.
You've reached your free article limit
You've read 0 of 1 free Pro articles.
Quick Summary
- Large-cap equities continued their push higher with the S&P 500 joining the Nasdaq in record territory as Treasury yields saw some modest easing helping the rally continue to broaden, although small-caps didn’t share in the gains Tuesday.
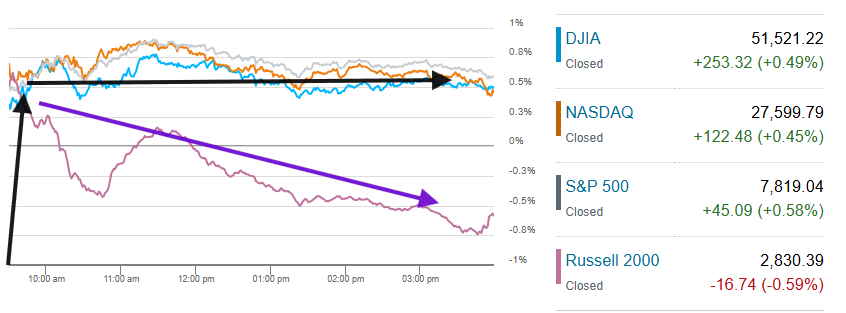
- Indices opened solidly higher, after which large-caps traded in a narrow range finishing the day near where they started. The S&P 500 rose 0.6%, to notch its first record close since August 13 (and its first close above 7,800), the Nasdaq was +0.5% logging a second straight record while the Dow Jones Industrial Average also gained 0.5%. The small-cap Russell 2000 was the outlier giving up an early gain to fall 0.6% despite the softening in yields.
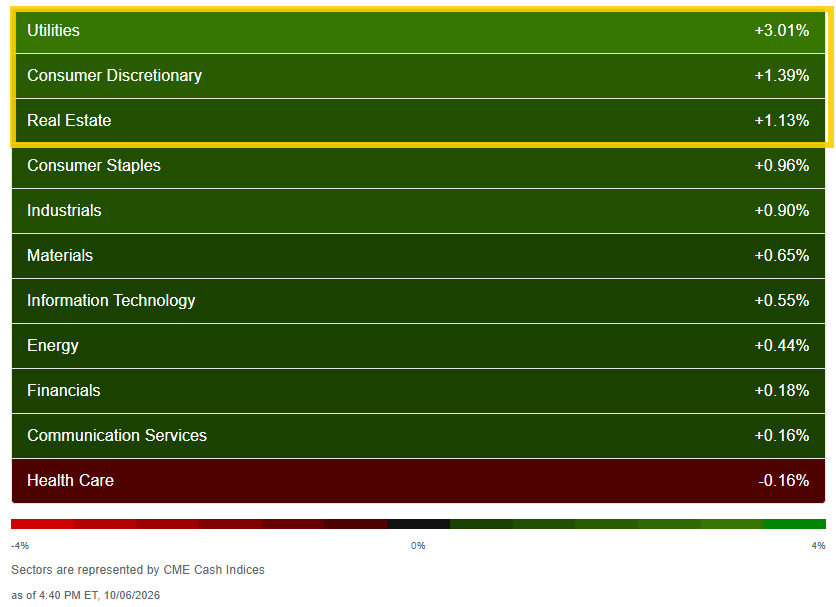
- Ten of 11 sectors rose for a third straight session, and the equal-weight index again matched the cap-weighted gain of +0.6%. Utilities (+3.0%) led and rate-sensitive Real Estate and Staples also rose around 1% or more. And for a second straight day, just one mega-cap-growth sector made the top five: Consumer Discretionary (+1.4%). Tech was up 0.6%. Health Care (-0.2%) was the lone decliner.
- AI remained a force. Marvell Technology (MRVL) rose 5.8% on a raised FY28 revenue outlook, while Advanced Micro Devices (AMD) rose 2.8% on plans to boost 2027 supply (details below).
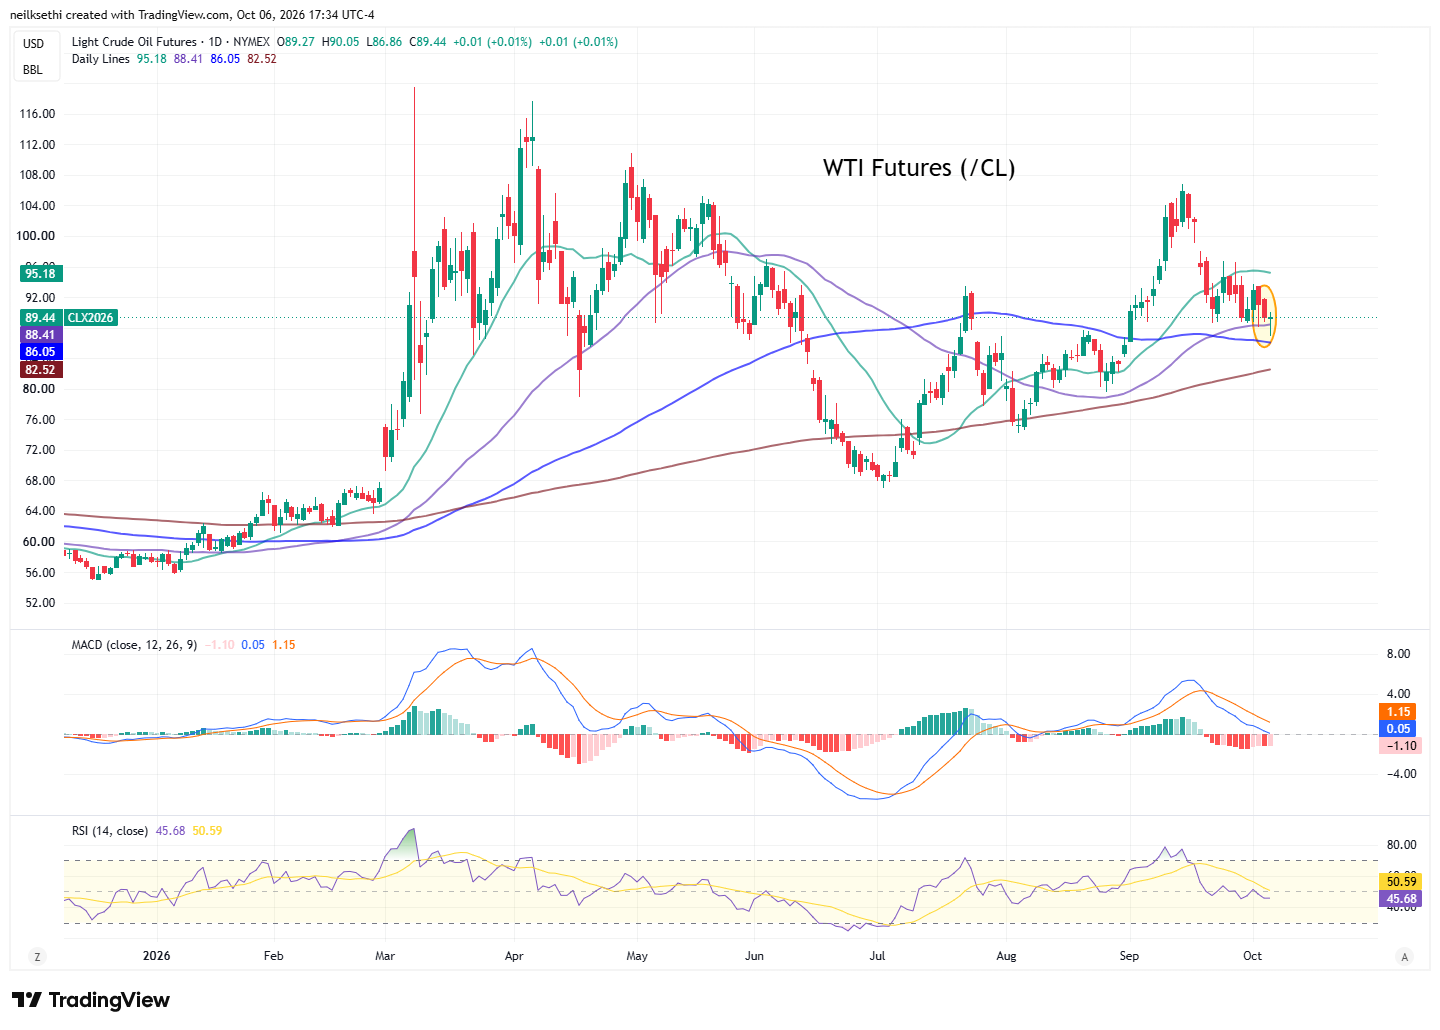
- The 10-year yield fell 4 basis points to 5.27% in the cash session after Monday’s highest close since April 2002. WTI was little changed at ~$89. In economic news, the August trade deficit widened to the largest since March 2025 as oil, gold, aircraft and capital goods — driven by AI — pushed imports to a record.
- Wednesday brings the September FOMC minutes and a $39 billion 10-year reopening along with a couple of reads on consumers from the Federal Reserve (more details in the final section).
Market Commentary
Equities:
- “Earnings, not multiple expansion, are driving this year’s gains,” said Stephan Kemper at BNP Paribas Wealth Management in Germany. “With earnings-per-share revisions still being strong, fueled by above-average guidance upgrades in the US, we think there is room for this pattern to continue.”
- “The breadth of the equity market performance is narrow and is driven by the tech sector,” said Mohit Kumar, chief European economist at Jefferies. “Strong earnings, ongoing capex and ample liquidity in the system should support the picks-and-shovels trade.”
- Equities have historically weathered rising-rate periods when the economy and profits kept growing, according to Anthony Saglimbene at Ameriprise. “Stocks have room to move higher if the 2027 outlook for growth and profits remains firm, energy prices stabilize/fall, and the Fed signals its rate-hiking path will be short-lived,” he said. “Of course, any advance in stock prices through year-end will likely require a steady AI trade as well.”
- “Everyone’s like markets are up. AI is the place to be,” said Stephen Kolano, chief investment officer at Integrated Partners. Investors are “looking through the inflation concerns right now, especially as it relates to oil, diesel, etc. It’s like ‘Okay, that’s something that potentially gets resolved in the future.’” Kolano also said that interest rates are “fundamentally kind of where they need to be.”
“People are looking for where might there be some source of contagion that starts to spread, but right now, it’s all staying well contained and just being dominated by the momentum, the earnings growth, the investment coming from artificial intelligence,” he added.- As geopolitical fragmentation continues, most major economies are absorbing higher energy prices and tariffs better than expected, according to Tiffany Wilding and Andrew Balls at Pacific Investment Management Co. “A booming AI investment cycle, the ability of consumers and China to absorb higher costs, and an incremental approach by central banks may help support growth while containing inflation,” they added.
Bonds:
- “With Brent now below $100/bbl, 10-year yields are making another push lower, but once again meeting resistance heading into the US session. That makes sense. The dominant US narrative remains higher potential growth, a higher neutral rate and ultimately higher policy rates.” — Skylar Montgomery Koning, macro strategist, Bloomberg
- Bonds have been volatile over the past six weeks, Morgan Stanley Wealth Management investment chief Lisa Shalett said in a note to clients. She cited a potentially new Fed policy framework, economic growth and high oil prices while the Middle East conflict stretches on as factors. “Nevertheless, while intraday implied volatility has risen, the six-week stretch has not reached the extremes that catalyzed the 2022 equity bear market,” Shalett wrote.
- The Treasury market could face more disruption this year if demand from China and Japan pulls back, Ray Dalio told Bloomberg Tuesday. “They are starting to get squeezed,” the founder of Bridgewater Associates said. Japan has lent a lot of money to change their economic policy, he said. “Now they want to take back some of that money.” On top of economic issues, there are also geopolitical ones, Dalio noted. “The Chinese don’t want to continue to accumulate,” he said. “When you have a debtor-creditor relationship and you have an adversary relationship, that’s a very difficult dynamic.”
Stock and Sector Breakdown:
Ten of 11 sectors higher for a third straight session (I don’t know for sure, but I don’t think we’ve seen that this year), and for a second straight session just one of the top-five spots (actually six Tuesday) was taken by a mega-cap-dominated growth sector in Consumer Discretionary (Monday it was Communications). And three other sectors joined Consumer Discretionary at around 1% or higher in Utilities (with a big +3% day), Real Estate and Staples all likely helped by falling yields. Tech was +0.6% after +0.7% Monday. Health Care -0.2% was the only sector in the red Tuesday.
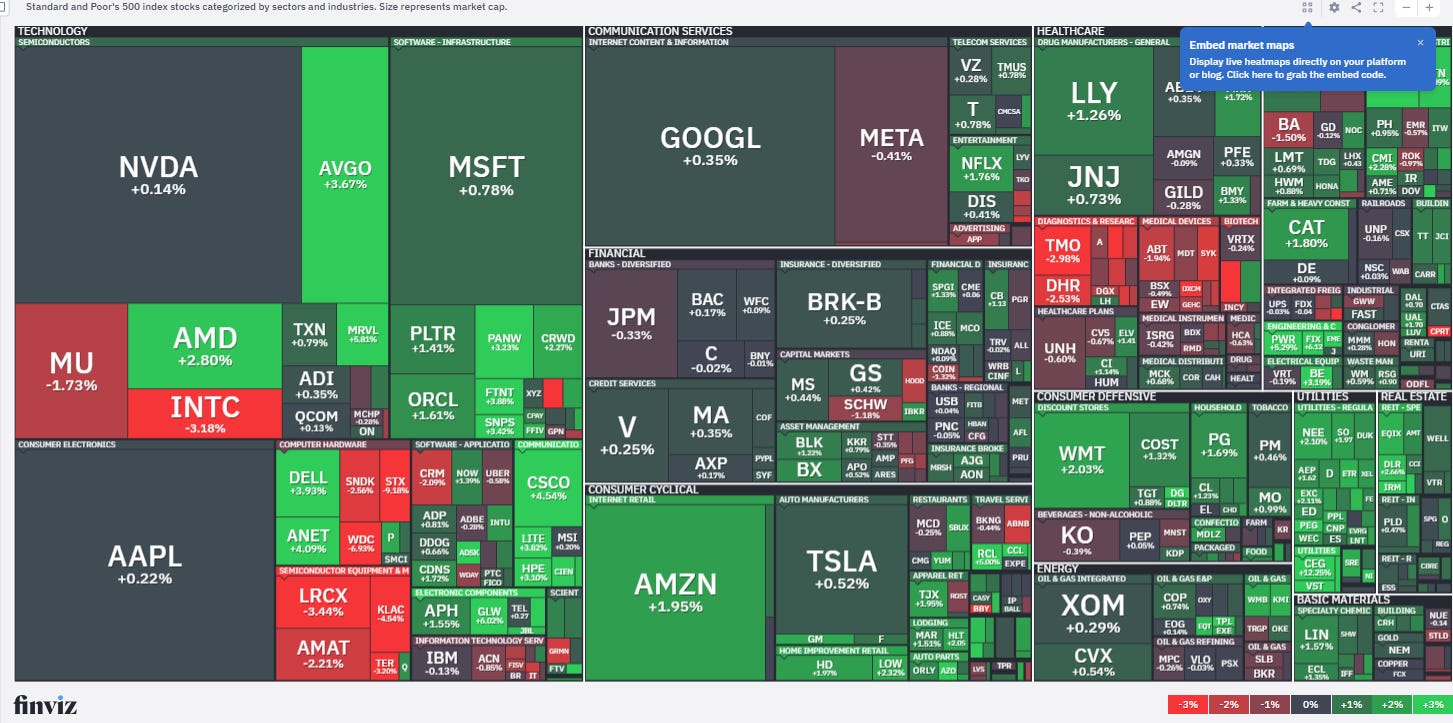
The Utilities sector was powered (pun intended) by a surge in Constellation Energy (CEG) +12.3% after Google (GOOG) +0.2% and Constellation struck a 20-year deal to boost output at 11 nuclear reactors. The 890-megawatt power-purchase agreement involves improvements to Constellation-owned reactors in Illinois, Pennsylvania and New Jersey. The deal, which calls for Constellation to invest more than $4.3 billion in the plants, is the largest yet to squeeze more power out of existing reactors, known as an “uprate.” Google and Constellation said they also have a 15-year supply deal for another 2,700 megawatts of electricity in the PJM power market. Vistra Corp. (VST) +10.8% and NRG Energy (NRG) +7.1% saw large gains in sympathy.
The PHLX Semiconductor Index (SOX) though saw muted gains for a second day +0.3%. Nvidia (NVDA) +0.2% was similarly little changed on the day after reaching a fresh record high Monday. But Marvell (MRVL) +5.8% jumped after CEO Matt Murphy said the company expects its revenue for fiscal 2028 to come in at $20 billion, above the $18.17 billion that analysts polled by FactSet were looking for. Looking out even further, the company sees its revenue being between $70 billion and $90 billion in fiscal 2031. That’s well above the consensus estimate of $47.04 billion. Advanced Micro Devices (AMD) +2.8% also outperformed the index after CEO Lisa Su said demand for advanced chips remains extremely strong and AMD plans to substantially increase supply in 2027. The bullish mood was reinforced by Citi, which raised its AMD price target to $800 from $575. Analyst Atif Malik believes the rise of AI agents such as Meta’s Muse could significantly expand demand for CPUs, forecasting a $300 billion CPU market by 2030.
Ciena (CIEN) +13.9% was the top performer on the S&P 500 gaining along with fellow AI-beneficiary Corning (GLW) +6.0% on the bullish comments from Marvell and AMD. Similarly, Hewlett Packard Enterprise (HPE) +3.2% rose to an all-time high.
It wasn’t all to the upside for AI-related names though. Seagate Tech (STX) -9.2% was the worst-performing stock in the S&P 500, and Western Digital (WDC) -6.9% was third from last as investors reacted to a Bloomberg report saying Seagate and Toshiba are competing to acquire TDK’s magnetic-head operation, an important supplier within the hard-disk-drive industry. The potential multibillion-dollar transaction is adding to concerns that began just days earlier with Toshiba’s plans to expand its presence in the HDD market.
The stock in between those two was Moderna (MRNA) -7.8% after a WHO spokesperson said the UN agency’s initial assessment found a “low” risk of a plague epidemic in Russia and a “very low” risk for the wider European region. This helped to calm fears of a potential global plague epidemic.
[Note: chart uses futures prices.]
Again despite the strong breadth, the number of large SPX winners (up over 3%) remained muted at ~40, the same as Monday and up just slightly from ~30 Friday, but still below the ~45 Thursday, while the number of large losers (down over 3%) came in at 11 from 8 Monday, 14 Friday. As mentioned previously, both of these metrics have remained very (extremely?) subdued since the start of August rarely getting above 50 and only once above 100.
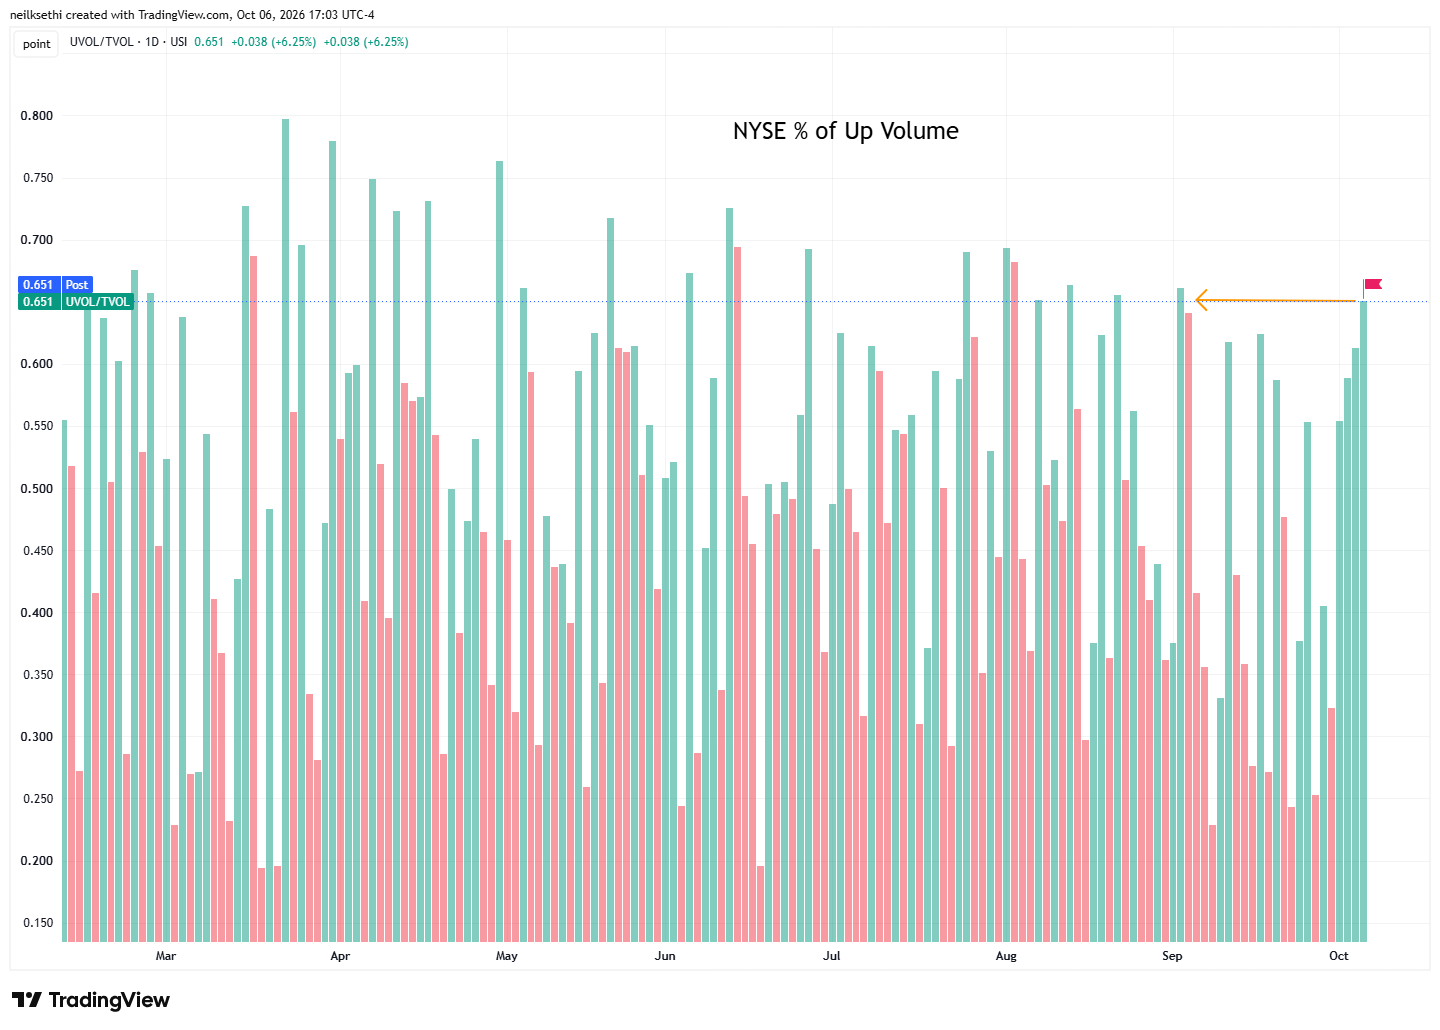
But positive volume was better for a fourth straight day and over the past three sessions it has worked its way from 58.8% to 65.1% on the NYSE despite the gains being almost exactly the same each day (~0.55%) on the index. That last is the best since September 2.
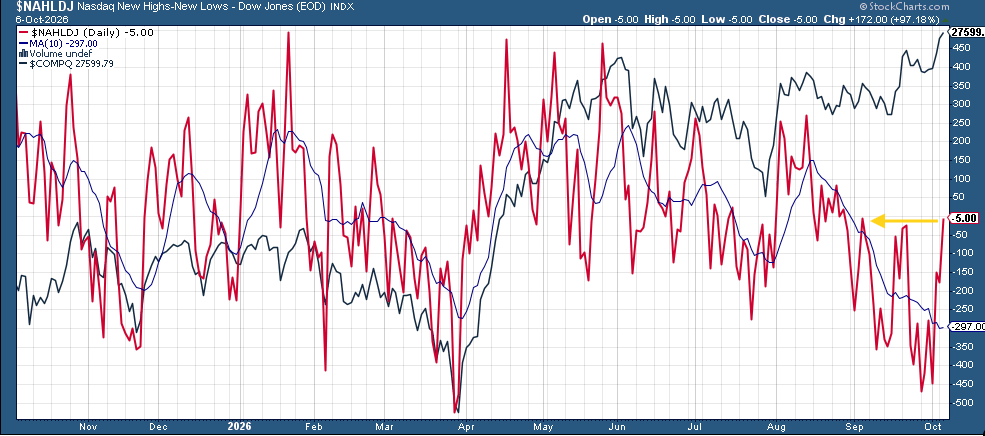
And over on the Nasdaq new 52-week highs vs. lows improved to -5 from -187. So while that makes it the 27th straight session that the Nasdaq saw more new 52-week lows than new highs, we’re the closest we’ve been to positive territory in a month.
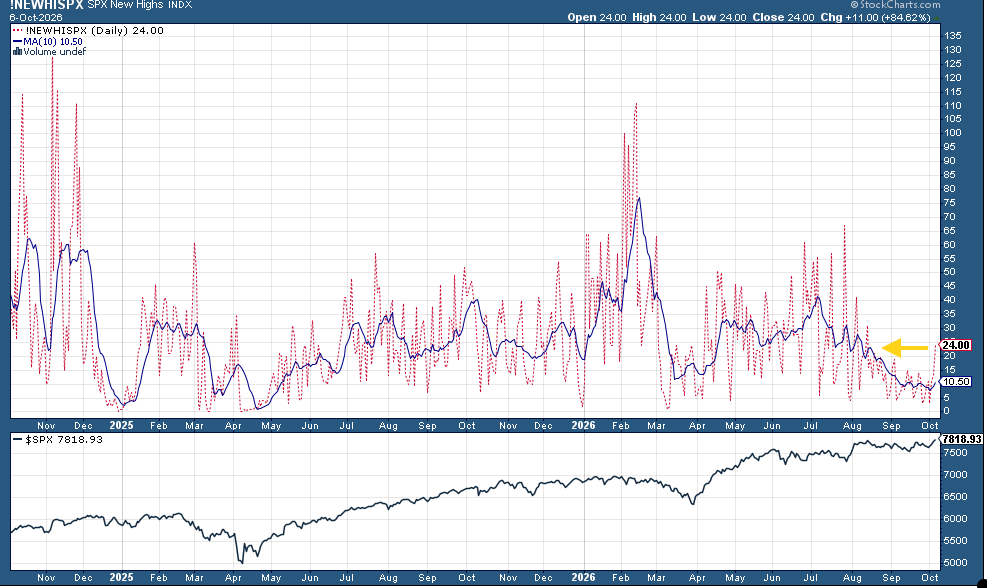
And SPX new highs hit 24, the best since mid-August. Of course, that’s still a relatively poor number with the index at an all-time high.
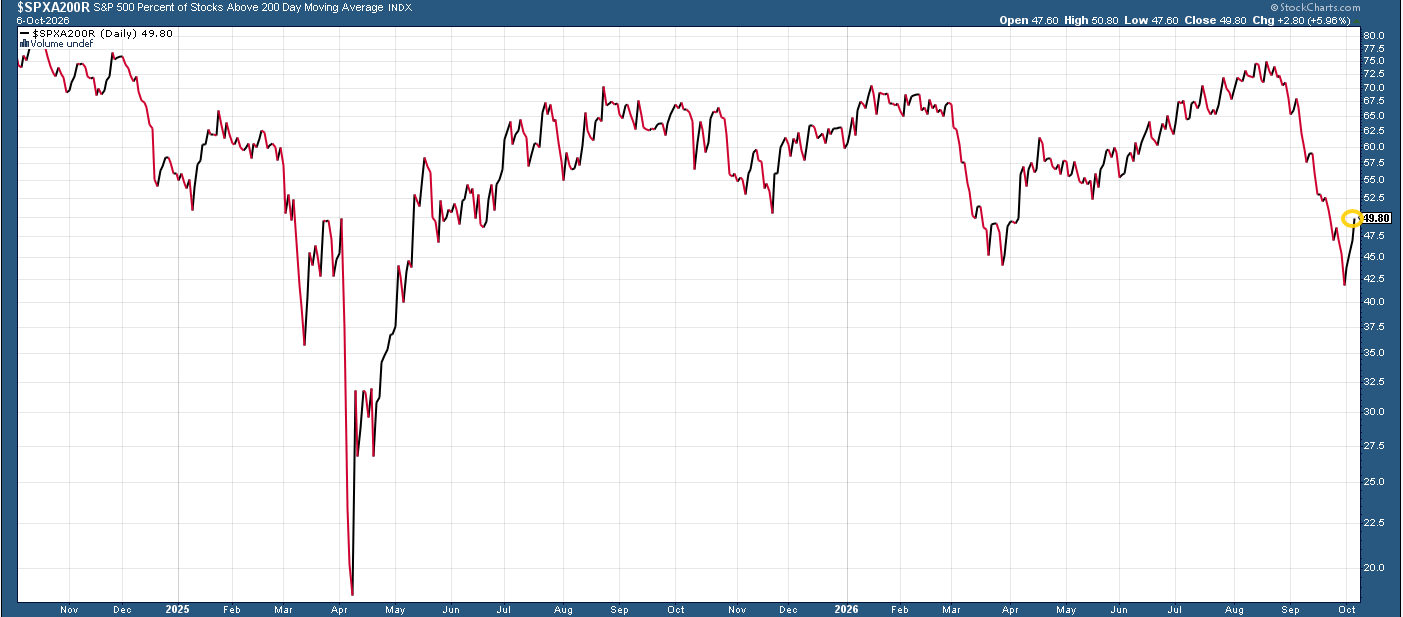
And we did see a continued turn higher in the percentage of S&P 500 stocks trading above their 200-day moving average (although still just under 50%).
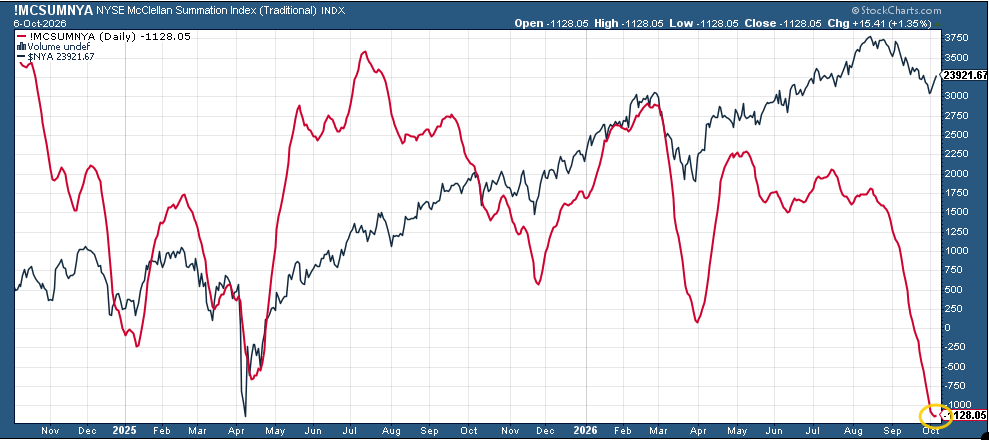
Still, though, waiting for the McClellan Summation Index (red line, broadly whether the typical stock is doing relatively better or worse than the index) to turn higher, but at least it’s stopped going down.
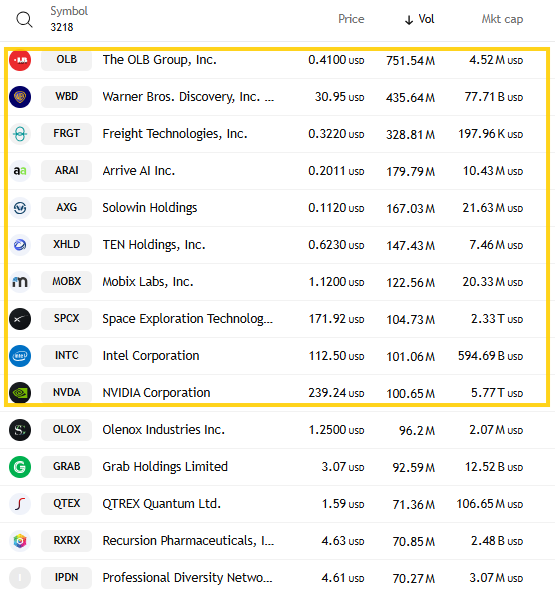
We are also starting to see speculation creep back into the market via Nasdaq trading volumes on penny stocks. The top trading vehicle Tuesday, The OLB Group (OLB), hit 750 million shares, the highest we’ve seen in weeks, and there were 10 stocks over 100 million, six of them penny stocks, also much more than we’ve seen of late.
Some Other Stock-Specific Commentary From TheStreet Pro:
- Bob Lang – Chart of the Day: Bank of America Needs a Lifeline
- Chris Versace –
- Ed Ponsi – After Huge Rally, Here’s How We’re Trading Brazilian Stocks
A Look at the Charts
Note on all charts the colored lines are moving averages (the average price over the lookback period — days on the daily charts, weeks on the weekly charts):
20 = green
50 = purple
100 = blue
200 = brownException is monthly charts where blue is 10-month moving average and brown is 20-month moving average.
MACD = Moving average convergence/divergence line, a measure of momentum that compares longer term and shorter term momentum to gauge if a move is strengthening or weakening. This is probably my favorite individual indicator.
RSI = Relative Strength Index (basically what it sounds like) = measures the strength of the move comparing gains to losses over the given lookback window (I use the standard 14 periods).
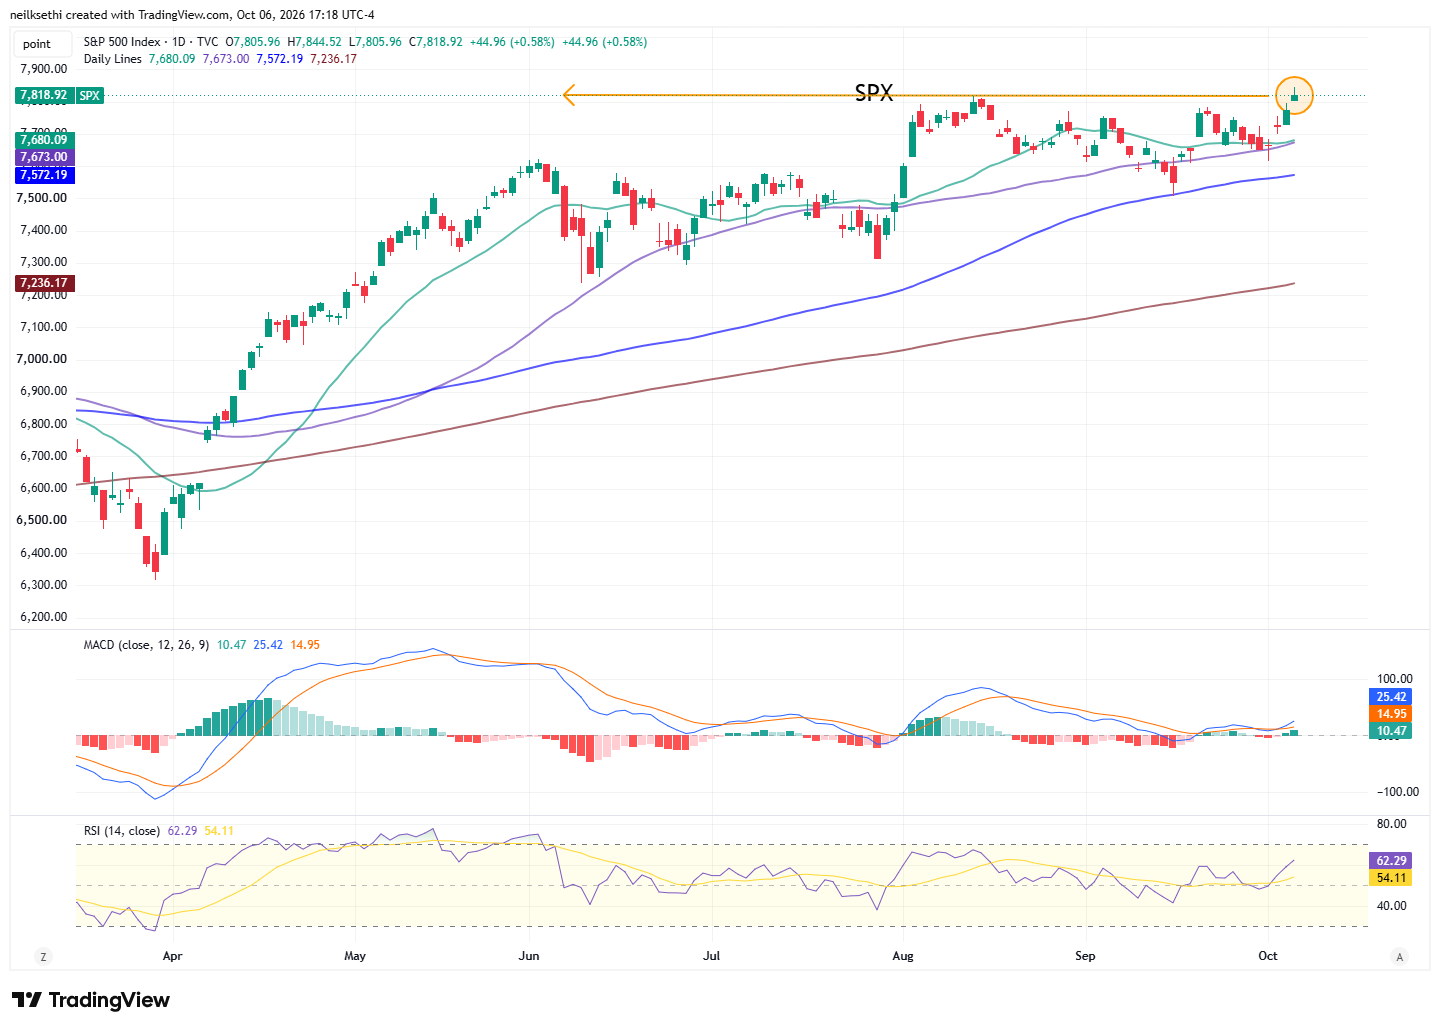
SPX made it to an all-time high. The daily MACD and RSI continue to push more positive. The measured move would take it to around 8,120.
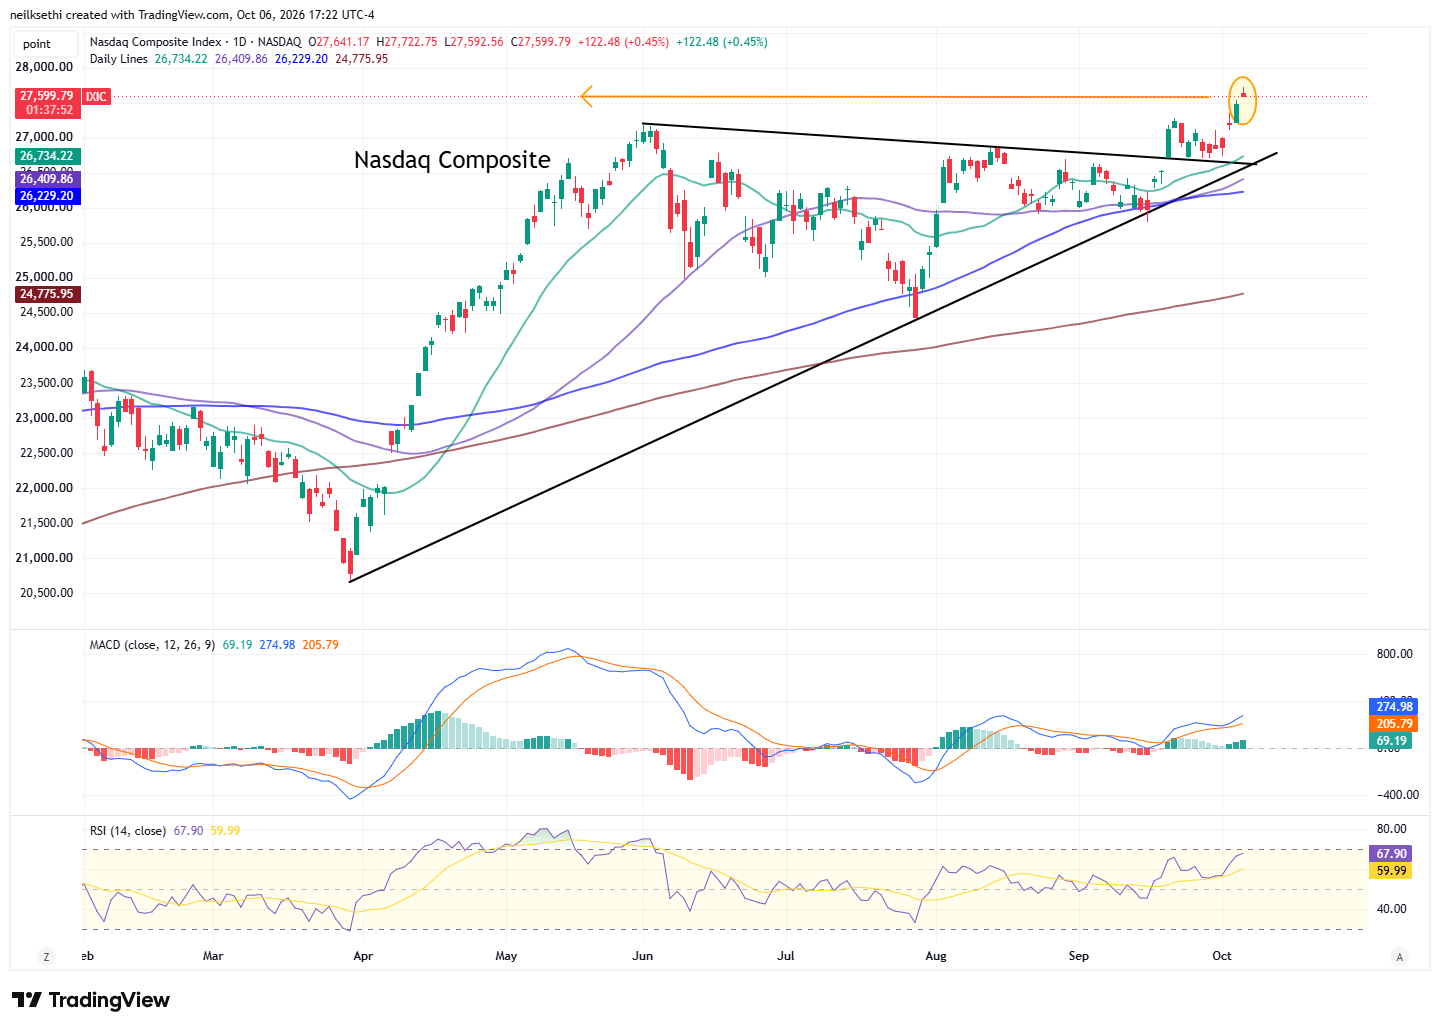
Nasdaq Composite also made another all-time high. Daily MACD and RSI are even more positive here.
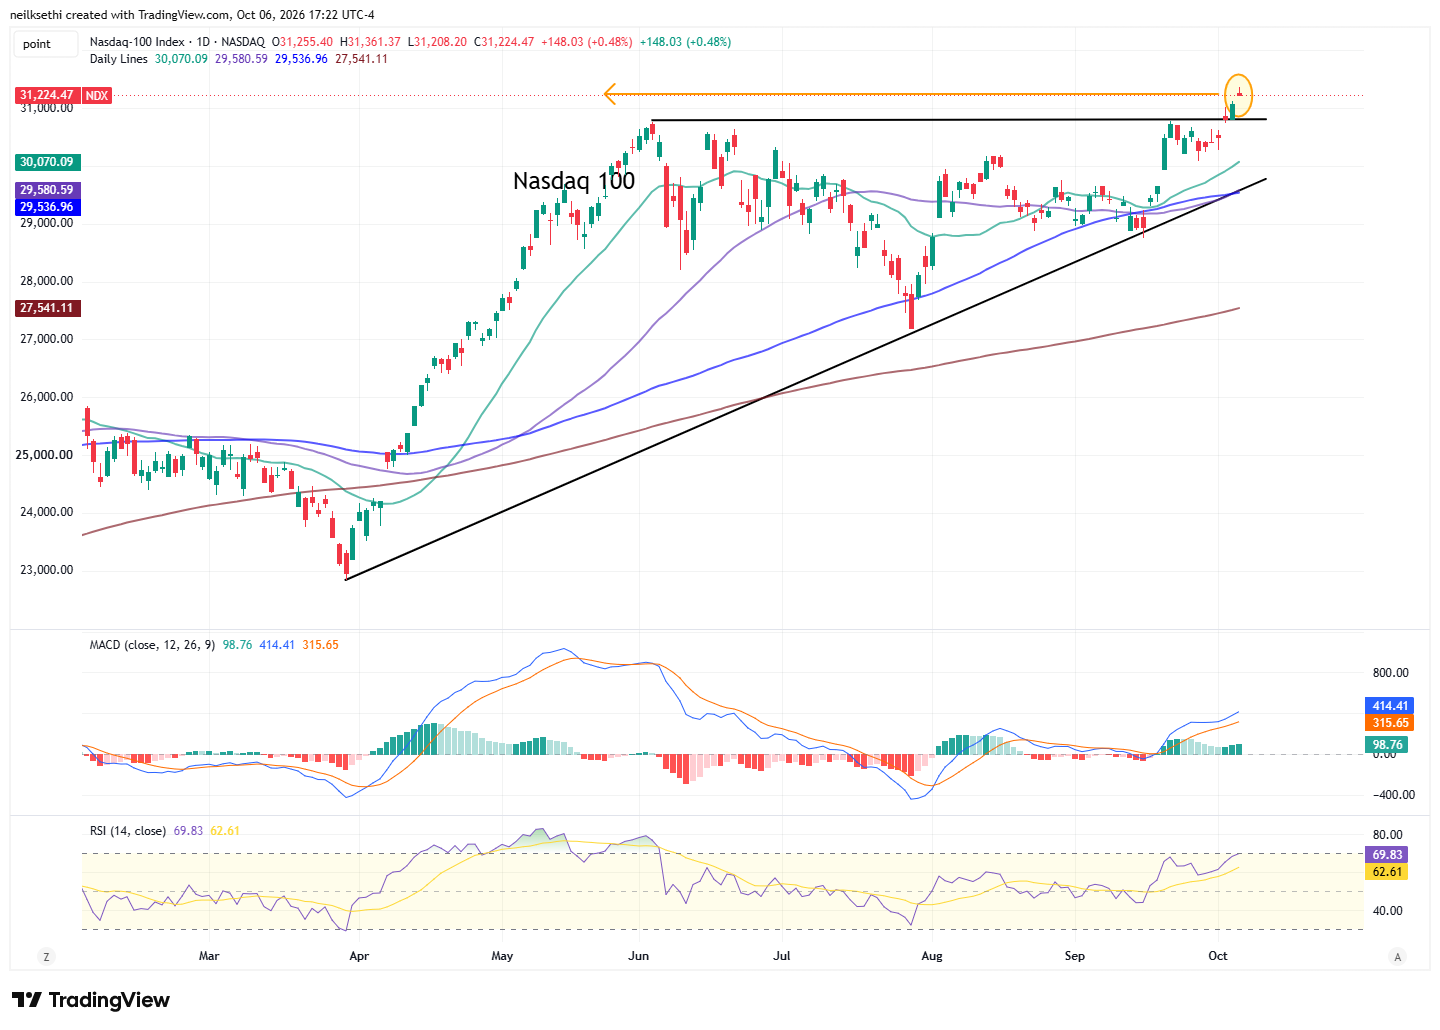
The Nasdaq 100 (QQQ) also posted an all-time high. Daily MACD and RSI very positive here as well.
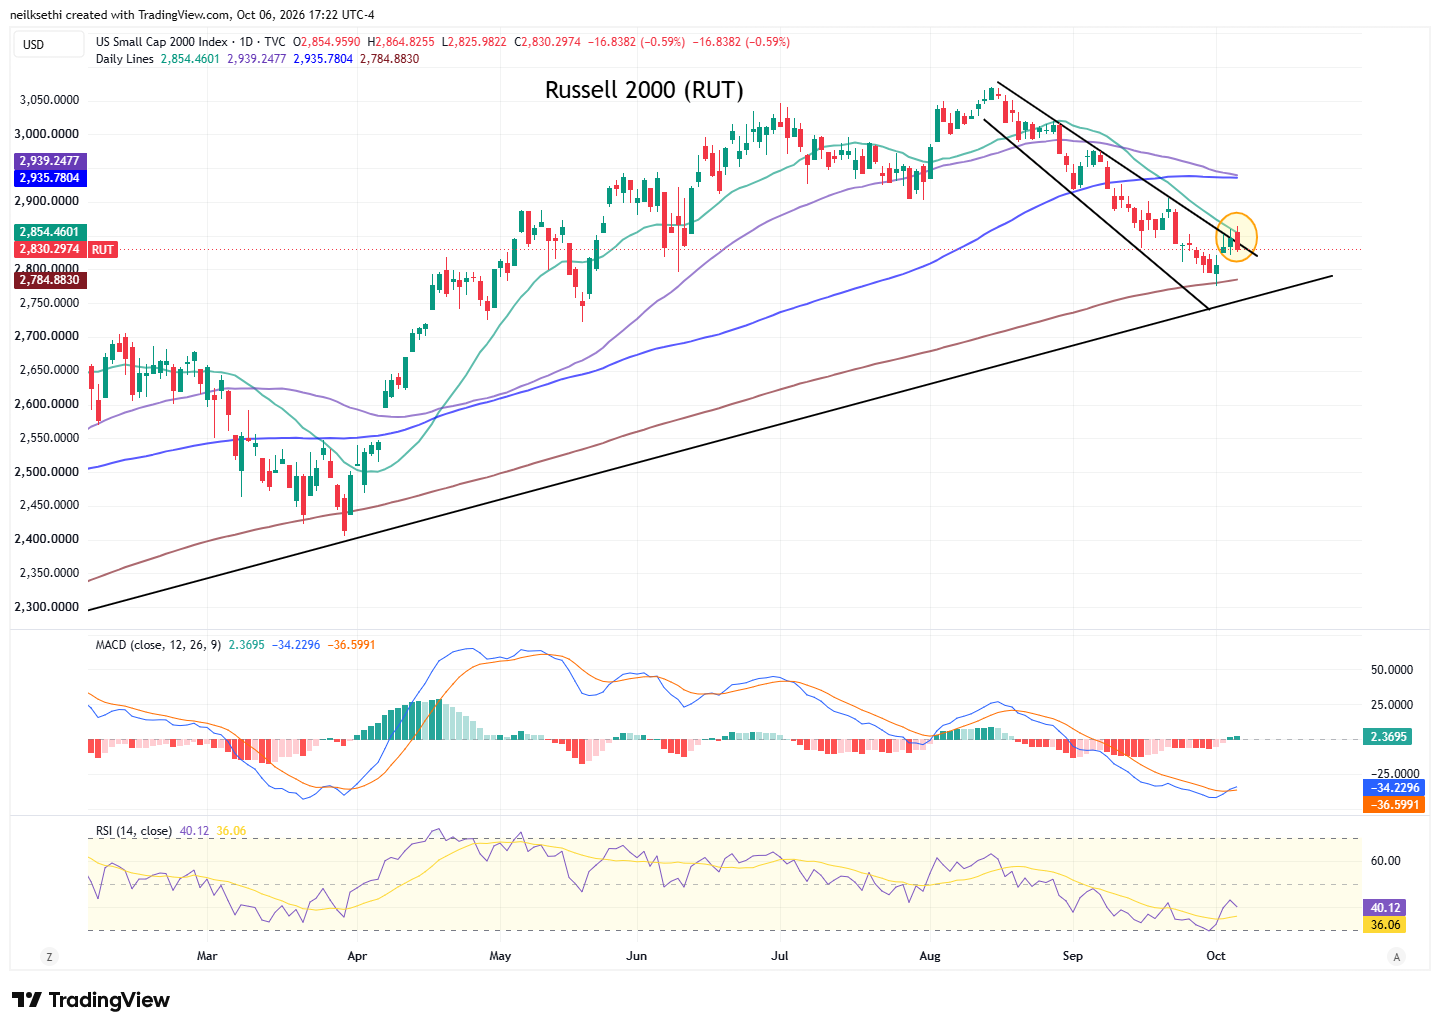
The Russell 2000 (RUT) disappointingly wasn’t able to get through the downward sloping 20-DMA again. As I mentioned Monday “So that becomes a key resistance level. If it gets through that it should run to the 100-DMA (blue line).”
The daily MACD still has the positive crossover I noted Monday, but the RSI remains under 50.
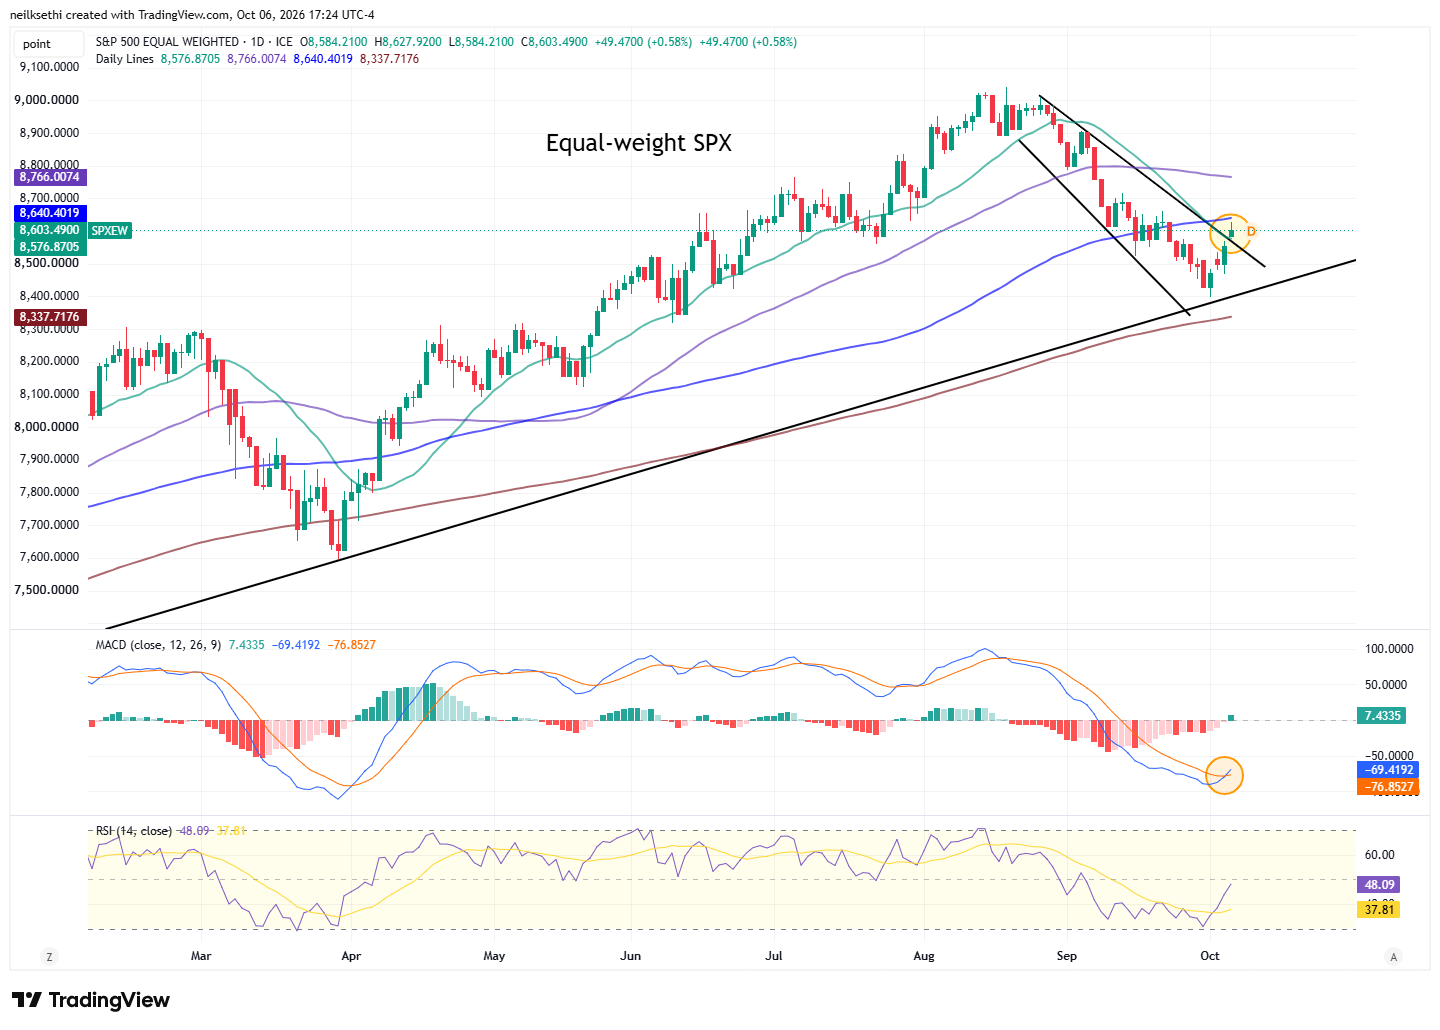
The equal-weighted SPX is no longer the weakest chart of the bunch as it cleared its downtrend line and 20-DMA. It now has an upward-sloping (easier to move through) resistance in the 100-DMA. It also got its daily MACD crossover, and the RSI is just about to 50.
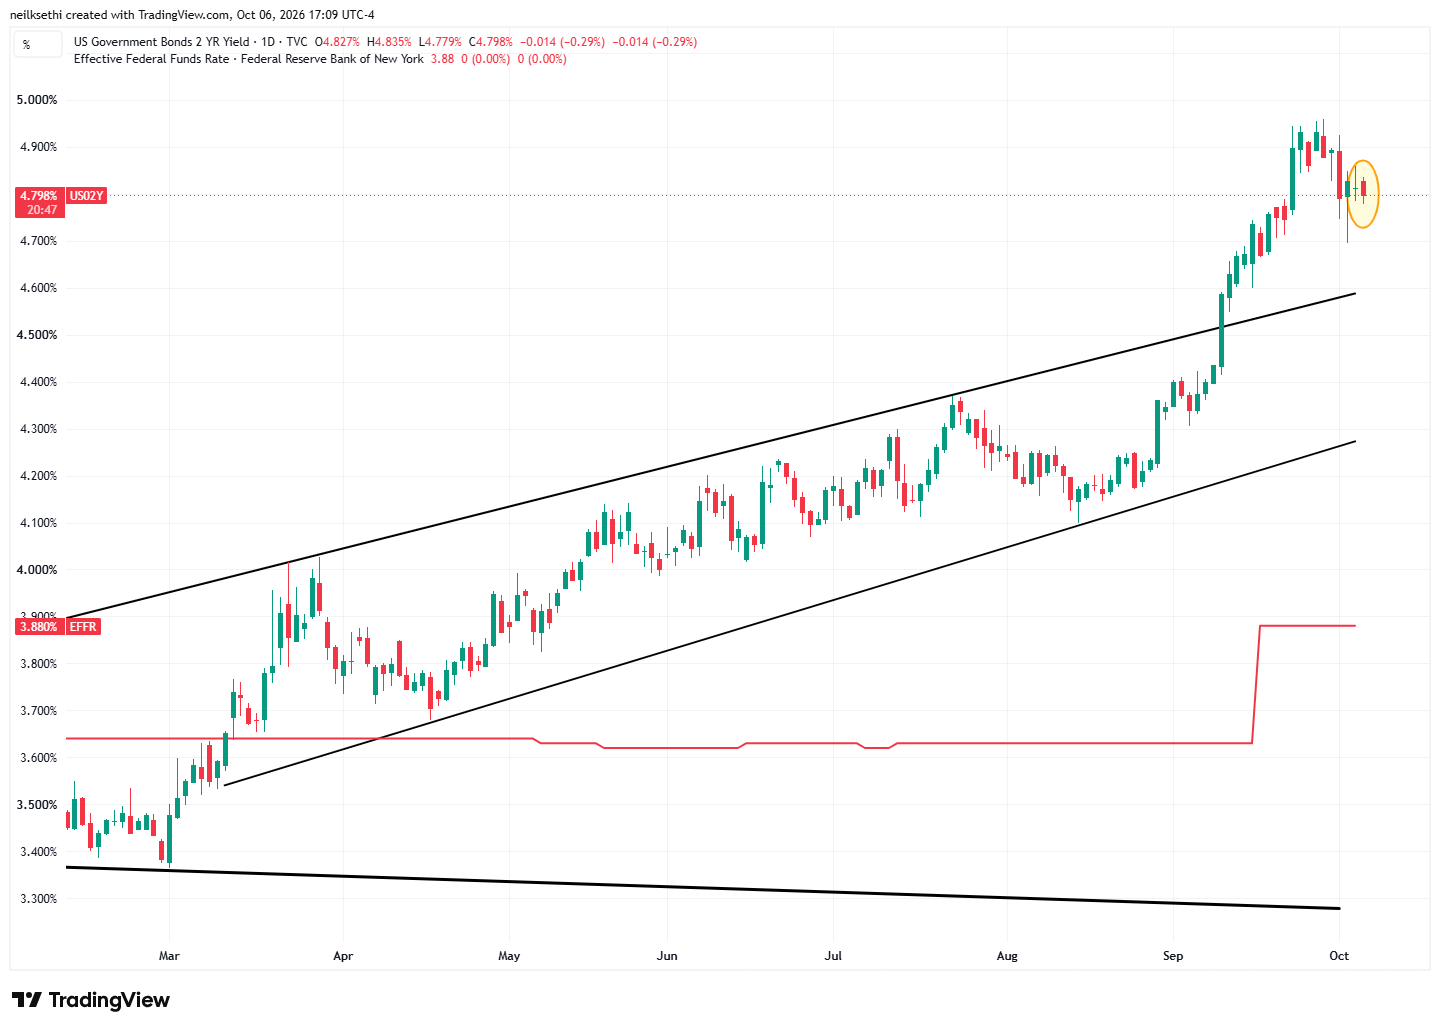
Treasury yields eased Tuesday except at the very longest maturity:
The 2-year Treasury eased back 2 basis points (including the after-hours) for a second session.
It is still ~91 basis points above the Effective Fed Funds rate, so still calling for (at least a couple) more rate hikes.
In that regard, Fed rate hike bets eased back a touch with October at 19% and a 16% chance of two hikes this year. 2027 sees ~85 basis points of hikes through next December.
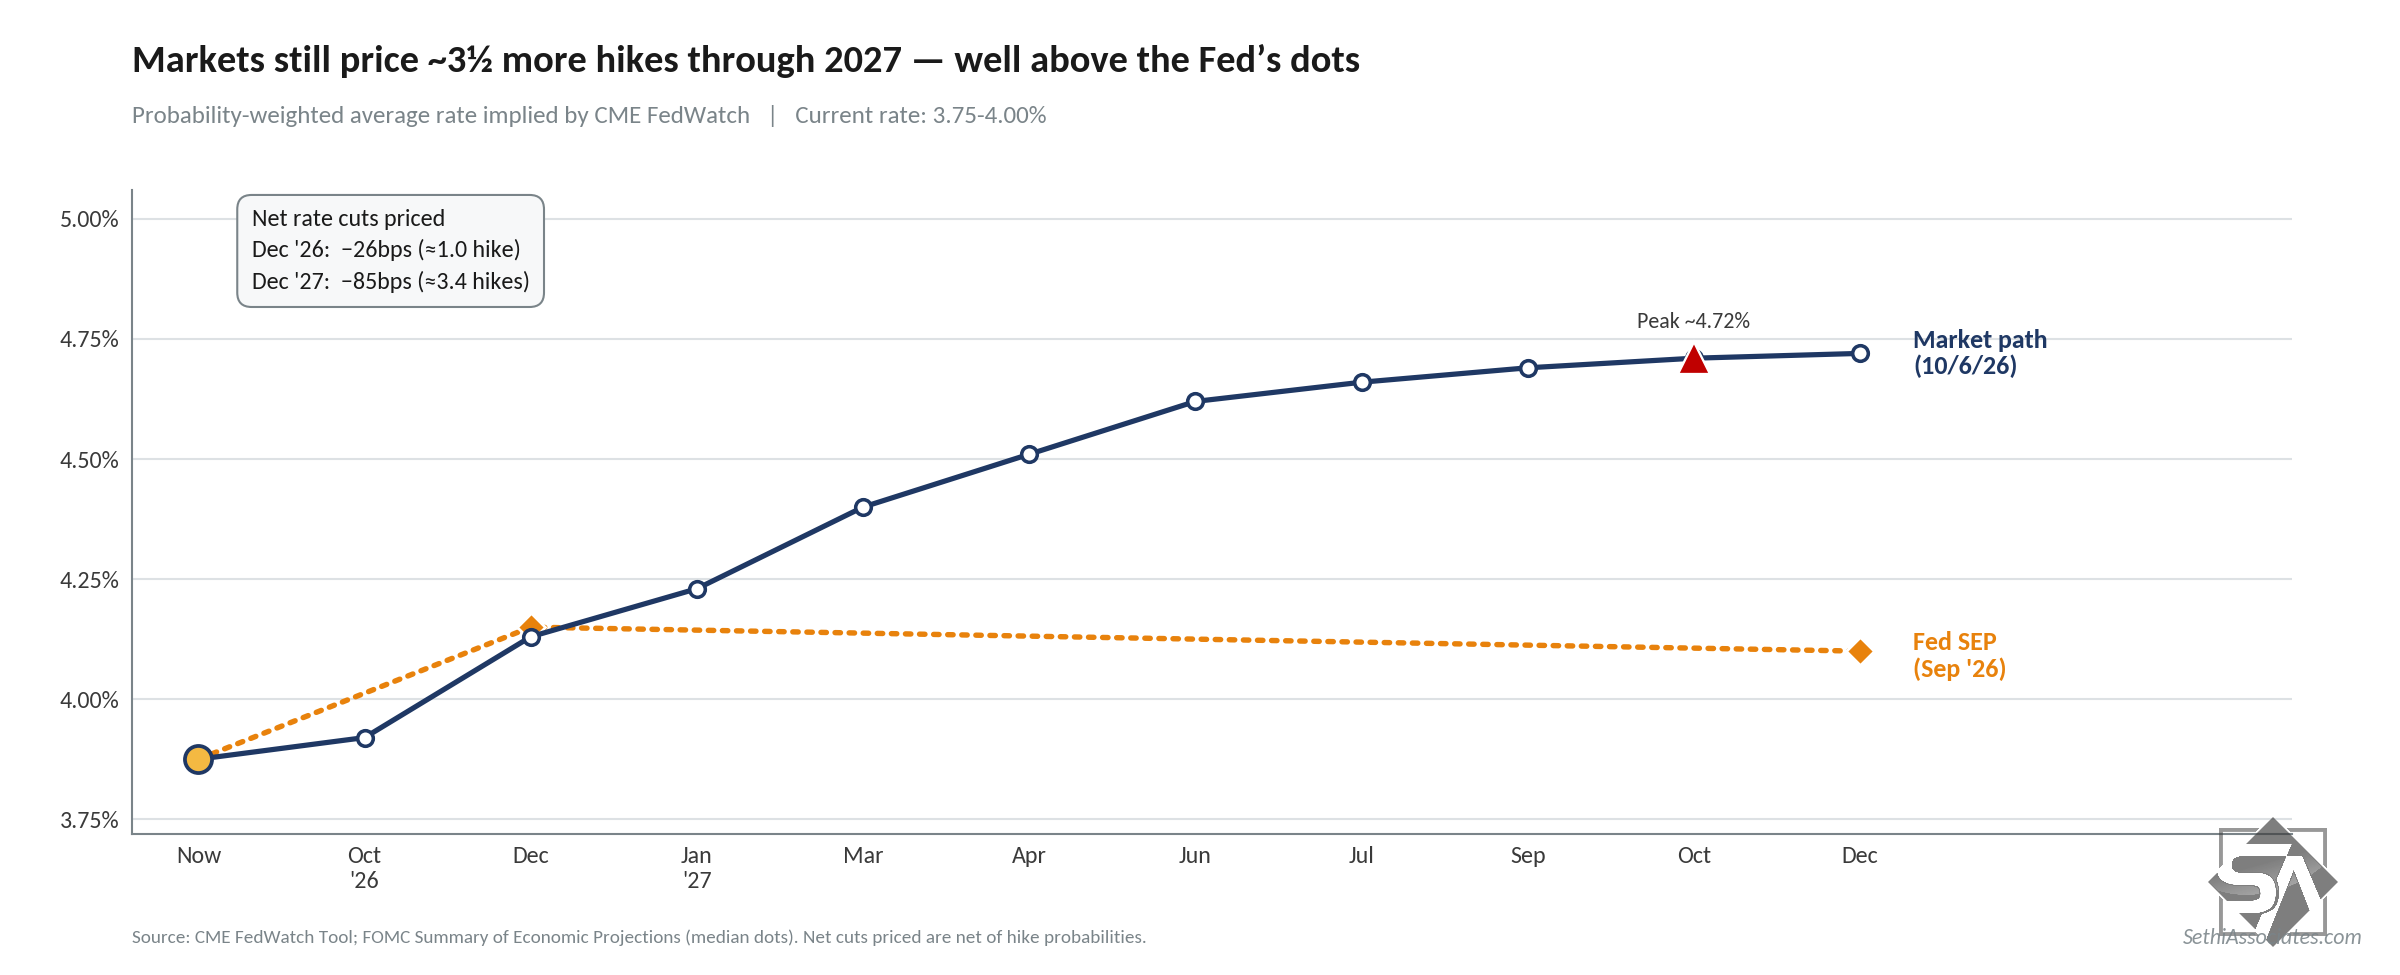
And here’s the take from 2027 FOMC voter San Francisco Fed President Daly. She still sounds like someone who doesn’t want to raise rates if she doesn’t have to.
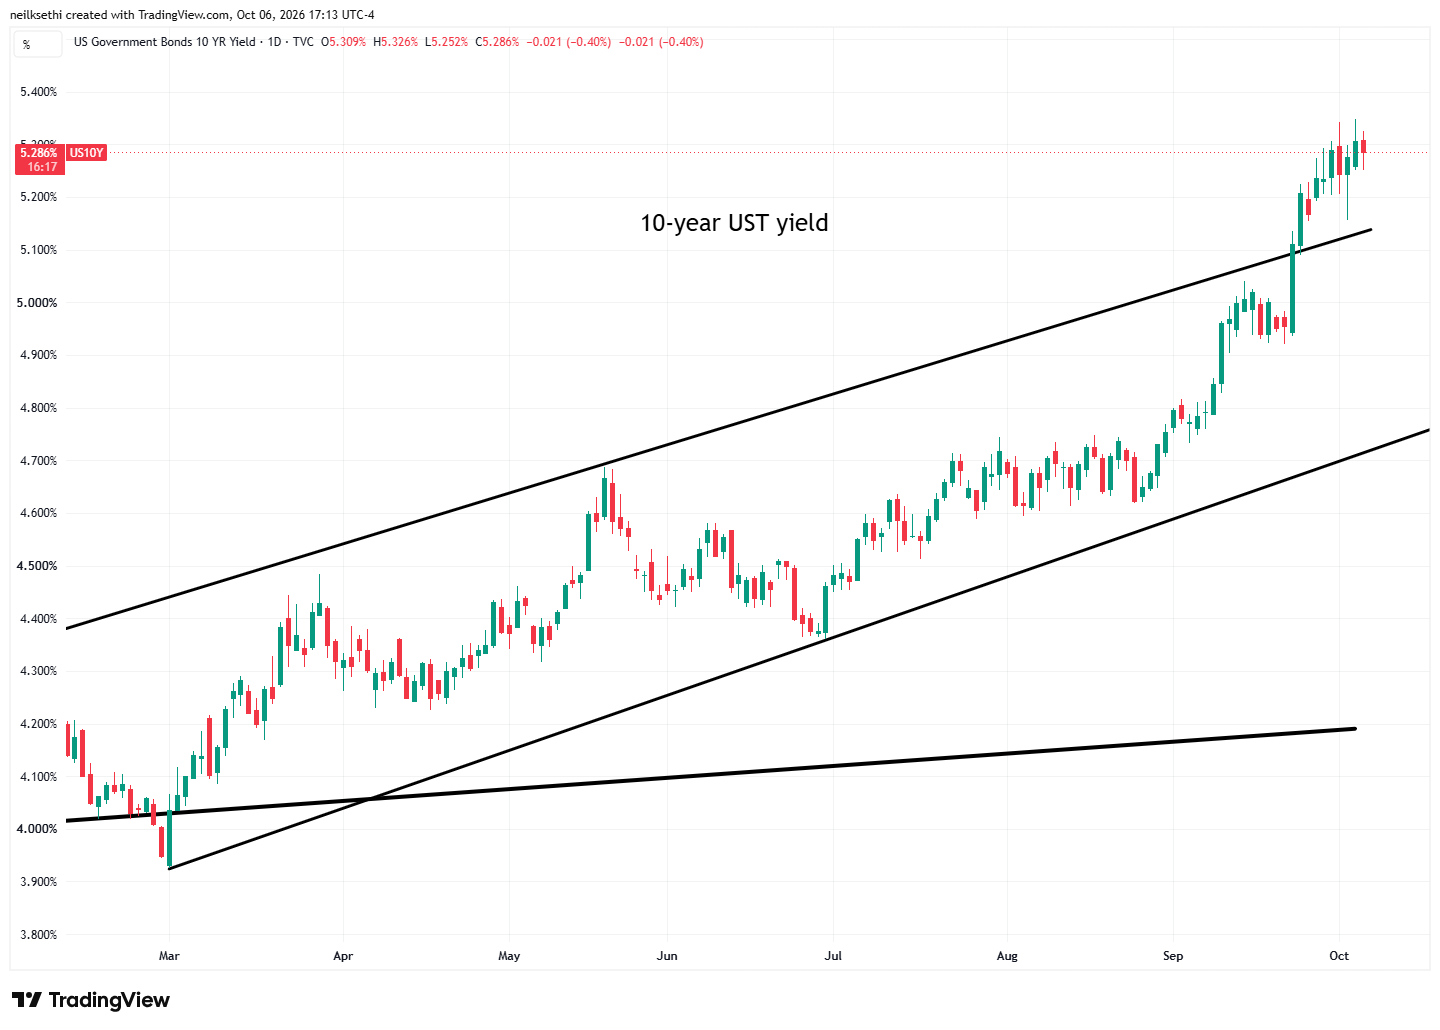
10-year yields eased back two basis points to 5.29% (including after-hours) from Monday’s highest close since 2002.
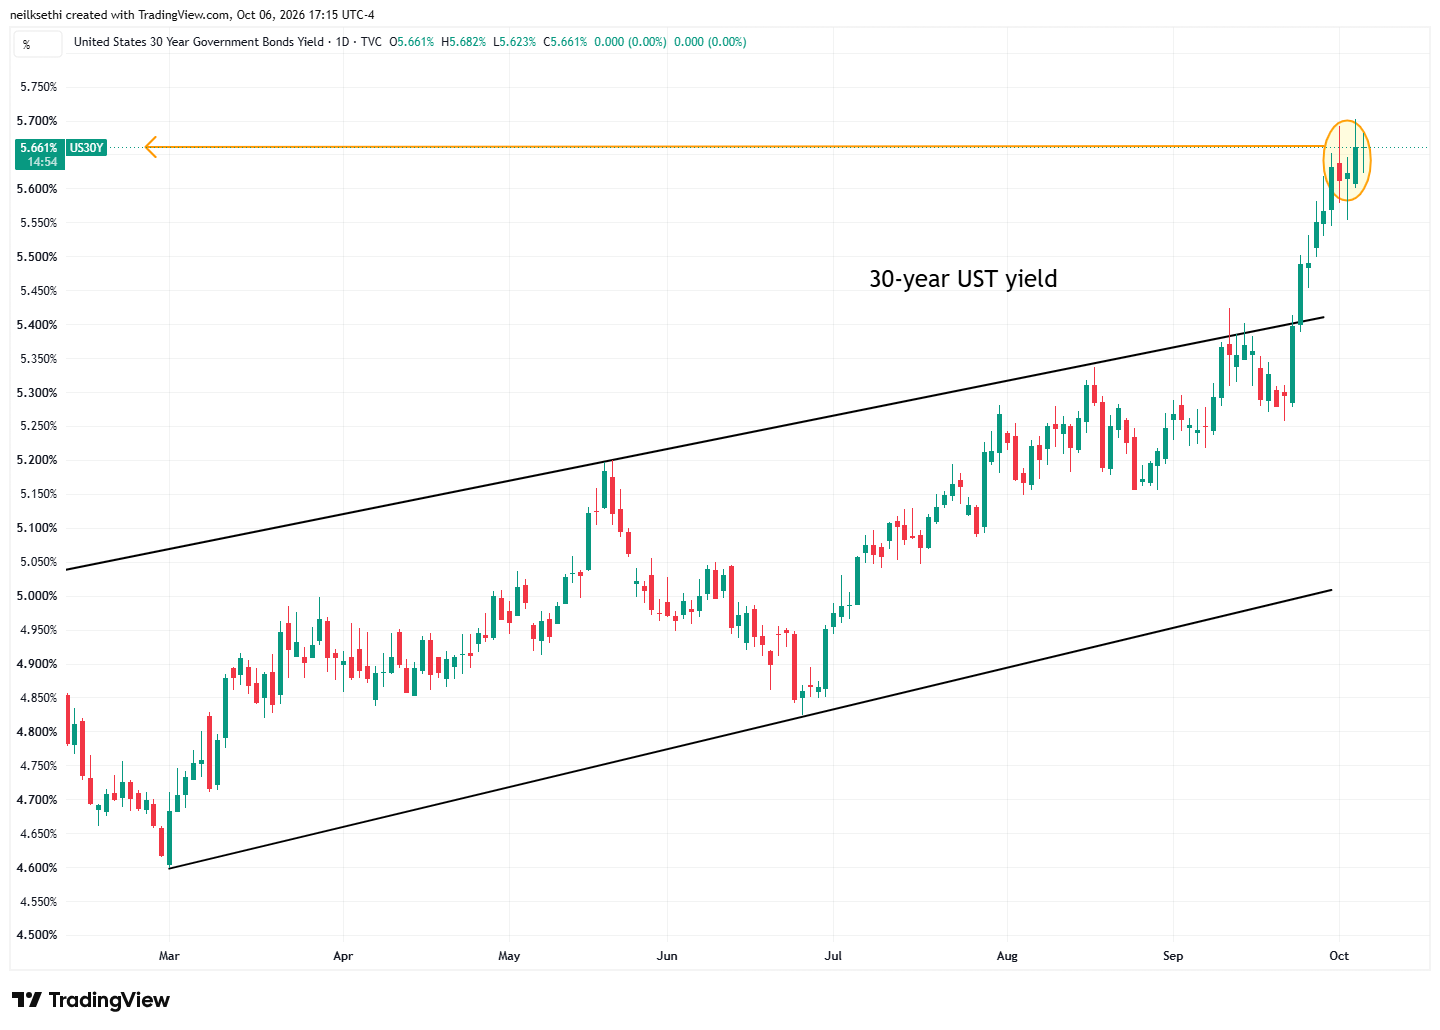
30-year yields though flat at 5.66% (including after-hours), matching Monday’s highest close since May 2002.
We got a solid three-year auction today.
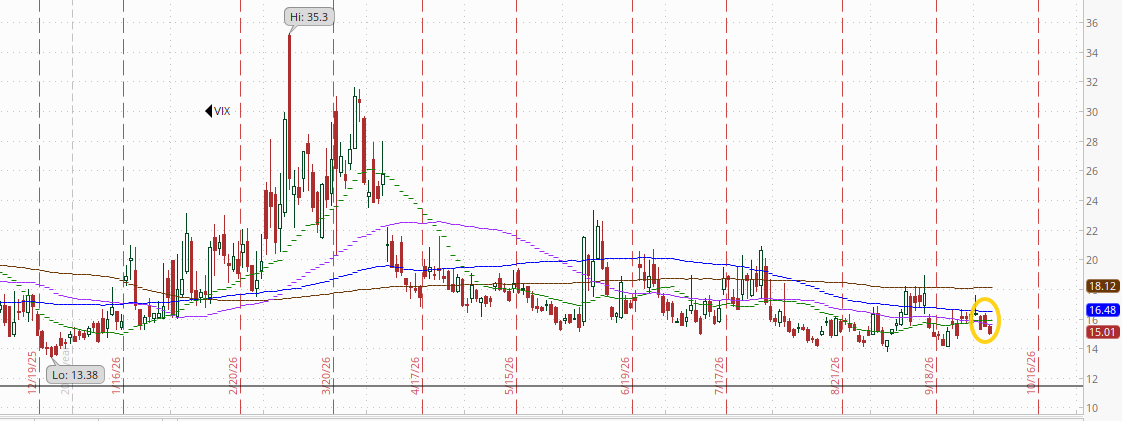
VIX edged back to 15.0. That’s consistent with ~0.94% average daily moves in the SPX over the next 30 days.
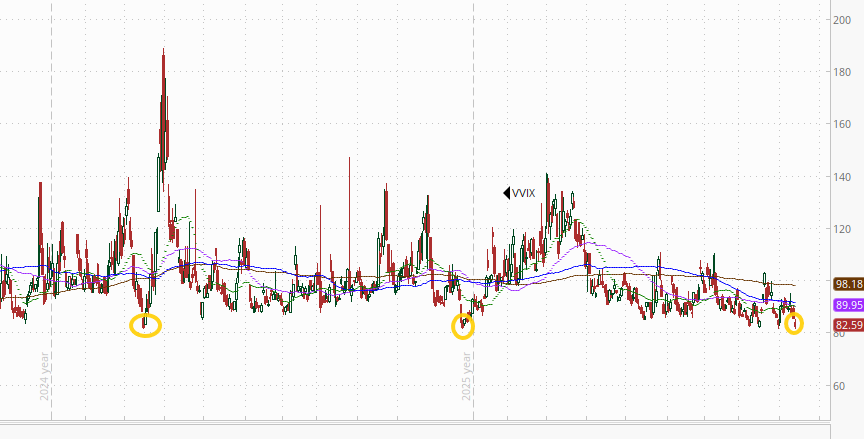
The VVIX (VIX of the VIX) fell more sharply to 82.6, the lowest close since December. Before that you have to go back to March 2025 for a lower close.
The current level is consistent with “subdued” daily moves in the VIX over the next 30 days (historically, normal is 80-100, although we haven’t been below 80 since July 2024). Above 100 is the level flagged by Charlie McElligott as indicating higher stress.
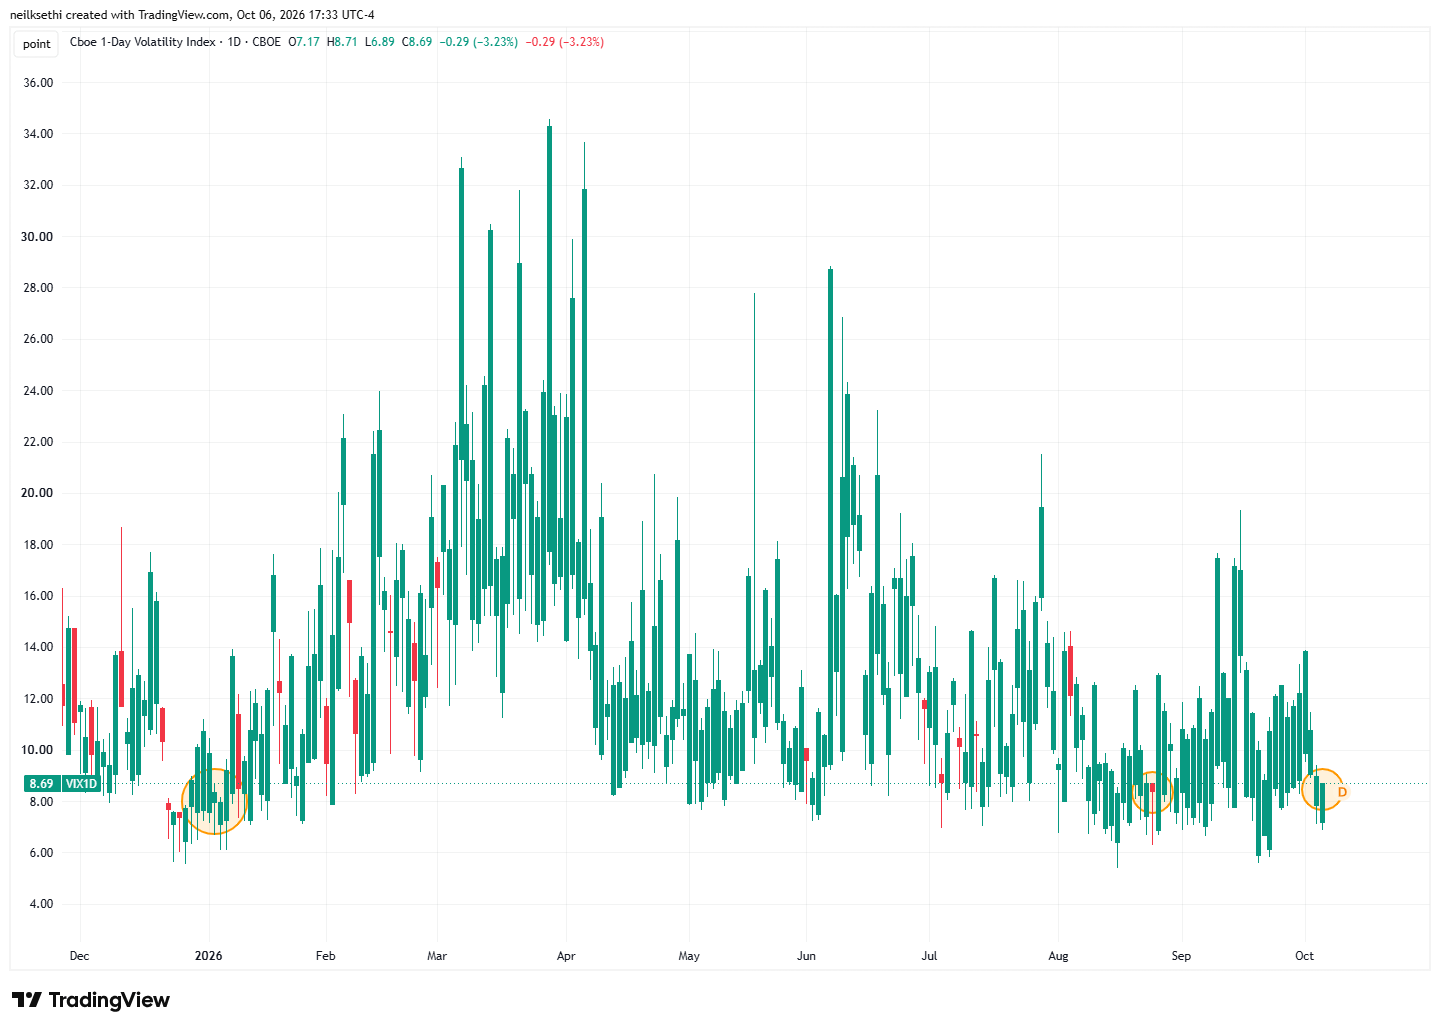
I just figured out the 1-day VIX ticker on ThinkorSwim isn’t updating for some reason, so that explains why it hasn’t moved in three days. In reality, it’s fallen for three days and at 8.69, it’s the second lowest close since early January (after August 25). The current reading is consistent with a move of 0.54% in the SPX next session.
WTI futures (/CL) unchanged (including after-hours) again finishing just above the 50-DMA.
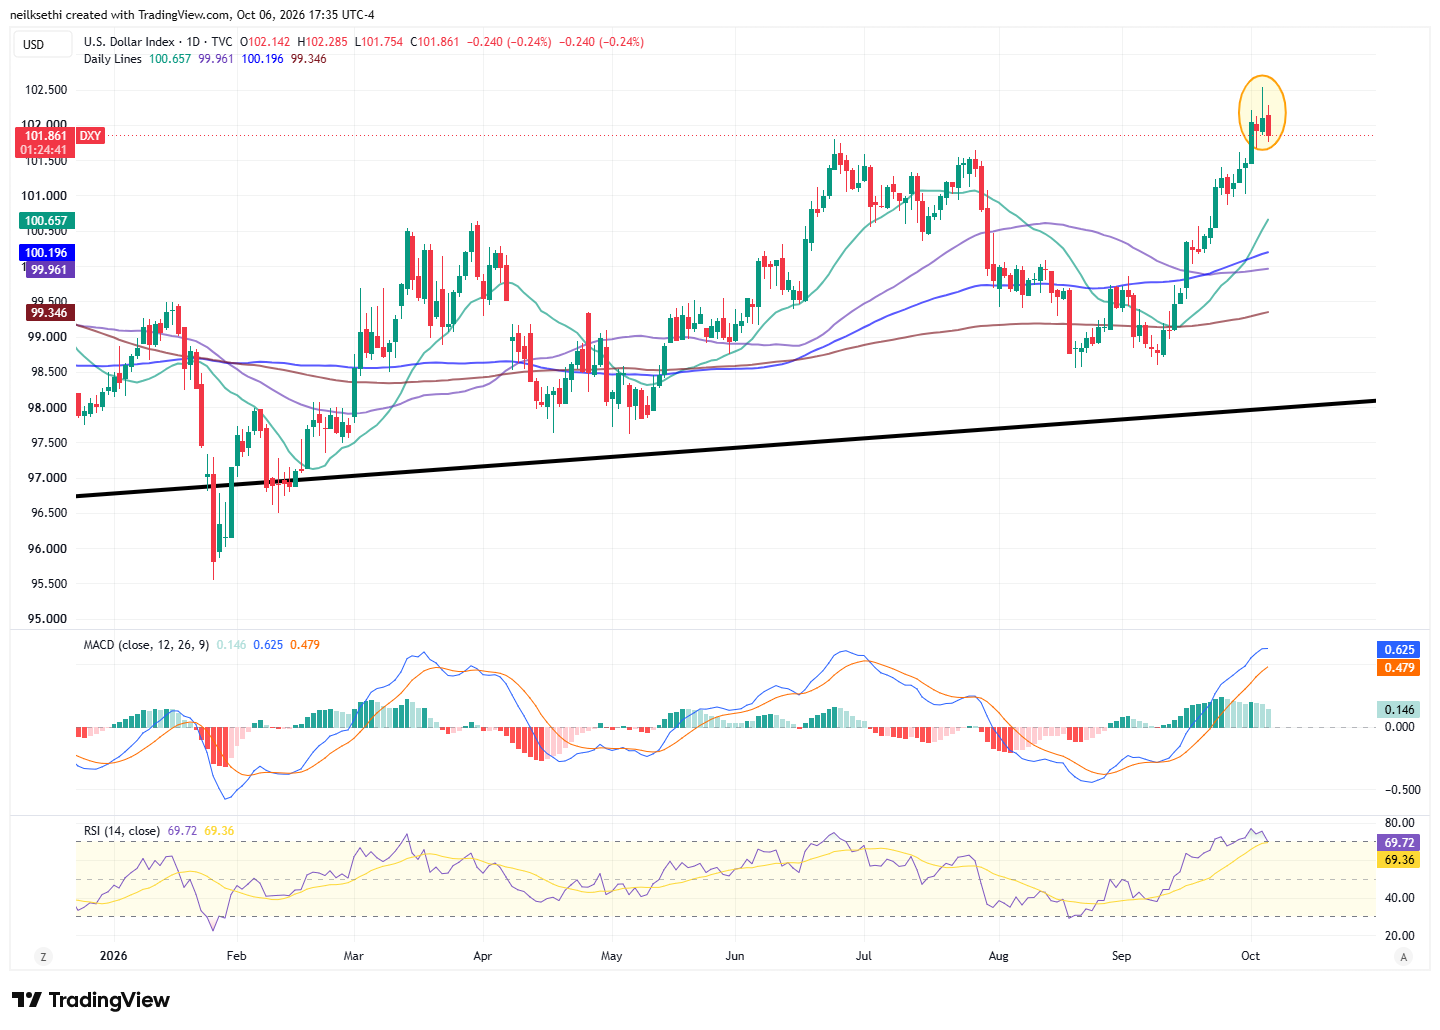
The DXY dollar index (which is fixed weighted with a heavy (57%) weighting vs the euro), eased back from the highest close since April 2025 .
As I mentioned three weeks ago “The daily MACD remains positive and the RSI is above 60 so it continues to have strong technical support.” I mentioned Thursday “This opens up a run higher, although it’s the most overbought since September 2023.”
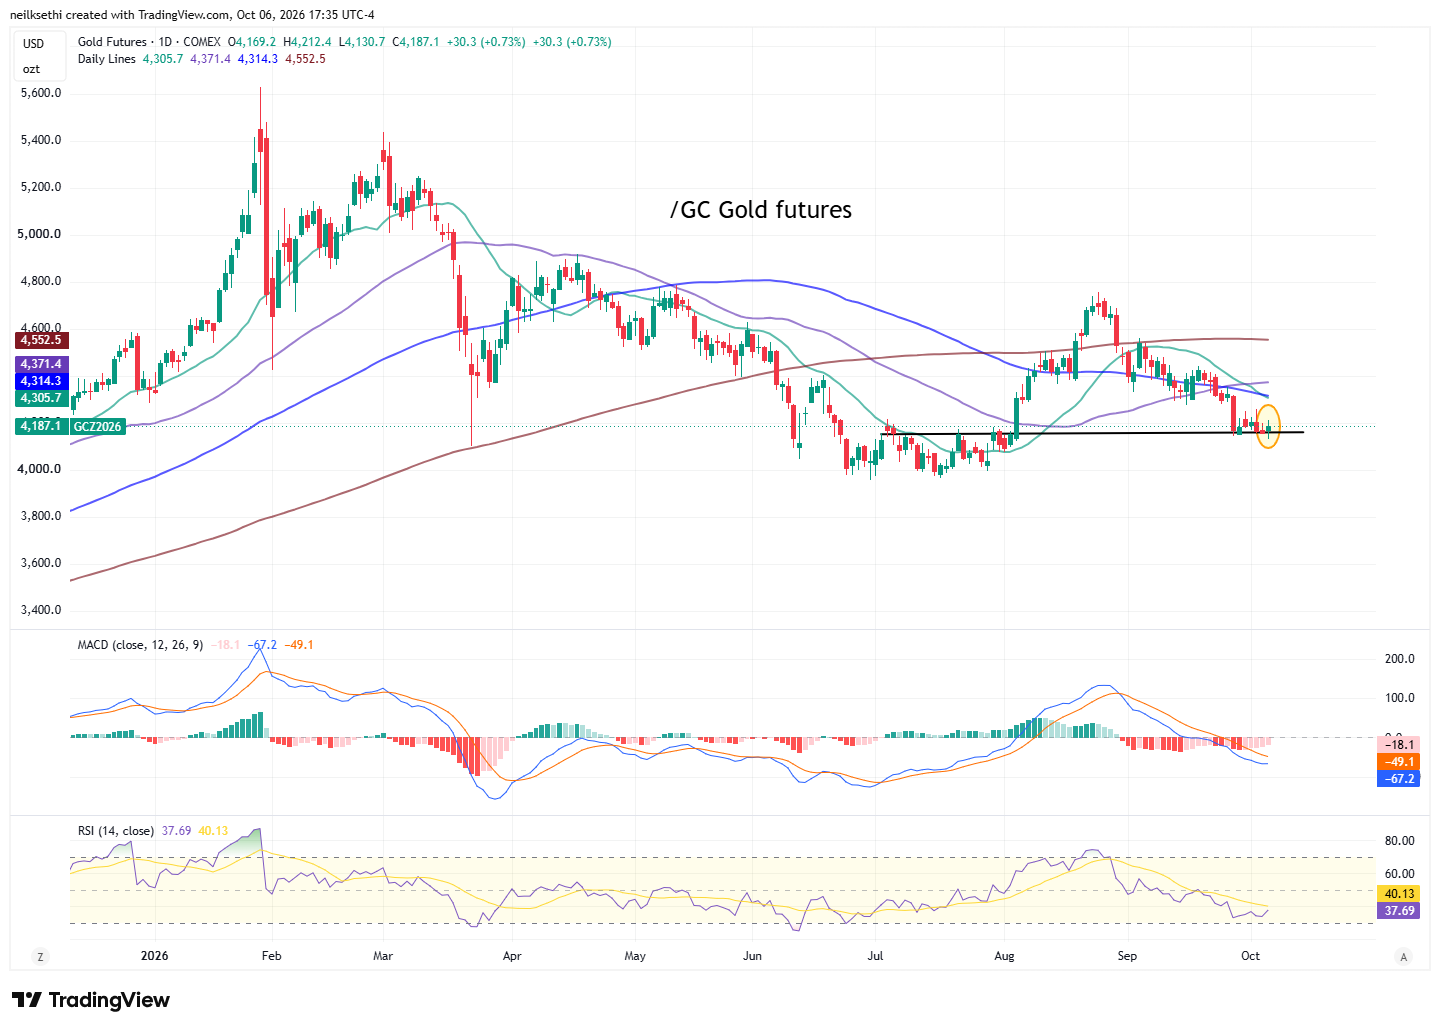
Gold futures (/GC) continue to hang on to support by the slimmest of margins. The daily MACD remains negative and the RSI is under 40, so not a lot of confidence that it holds, but you never know.
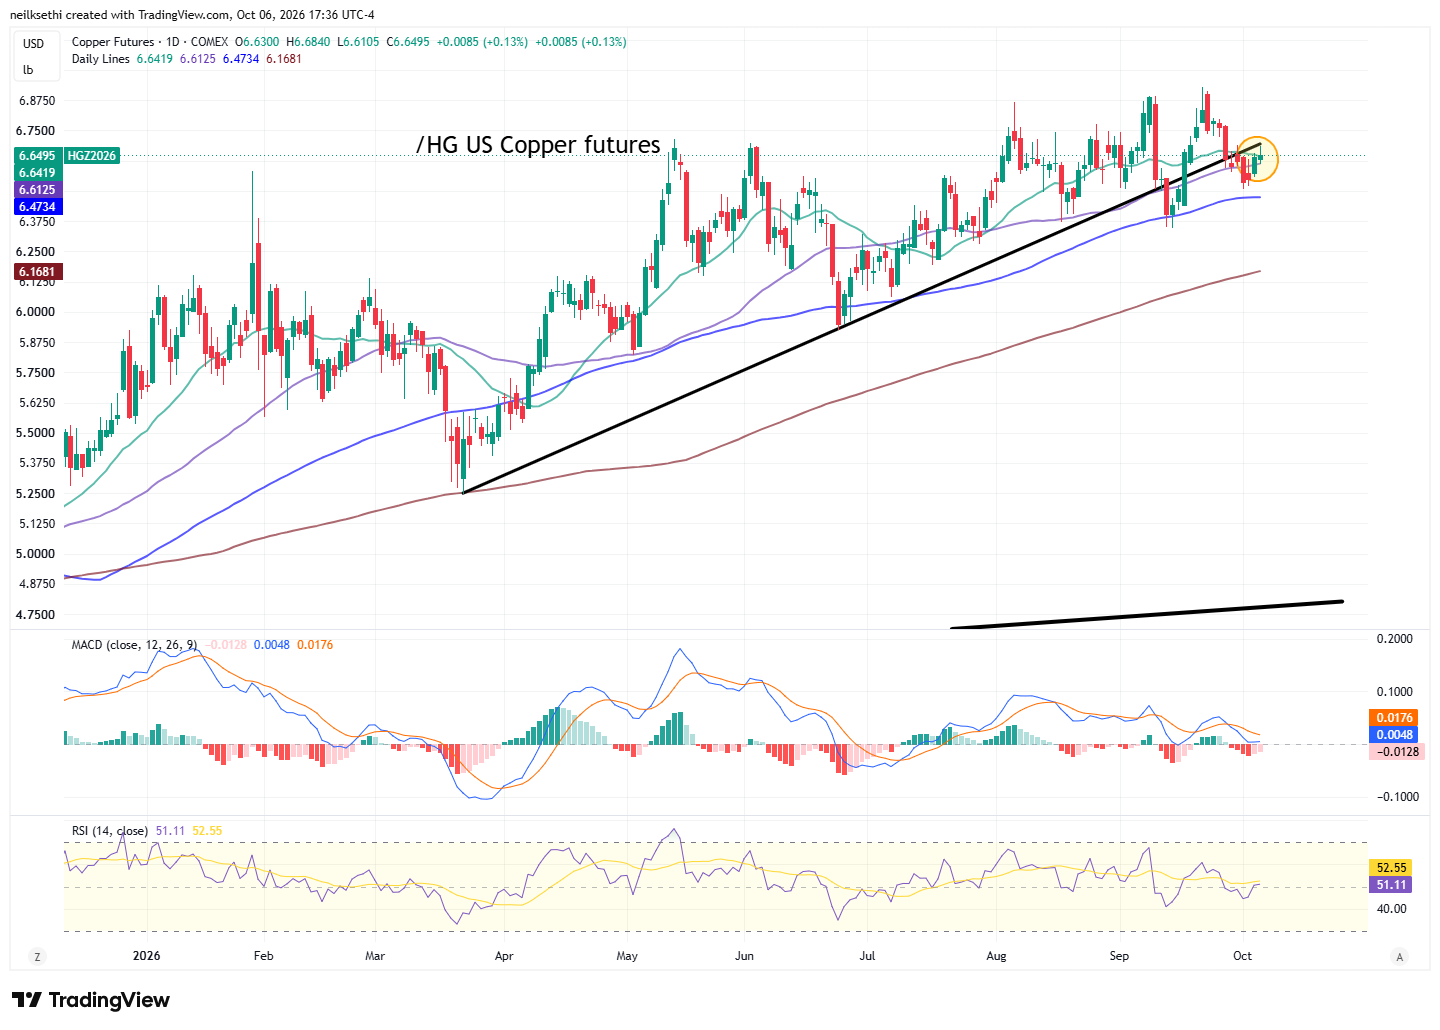
U.S. copper futures (/HG) were able to make some progress for a second day but overall the same level they were at May 13. Daily MACD tilts negative while the RSI is neutral.
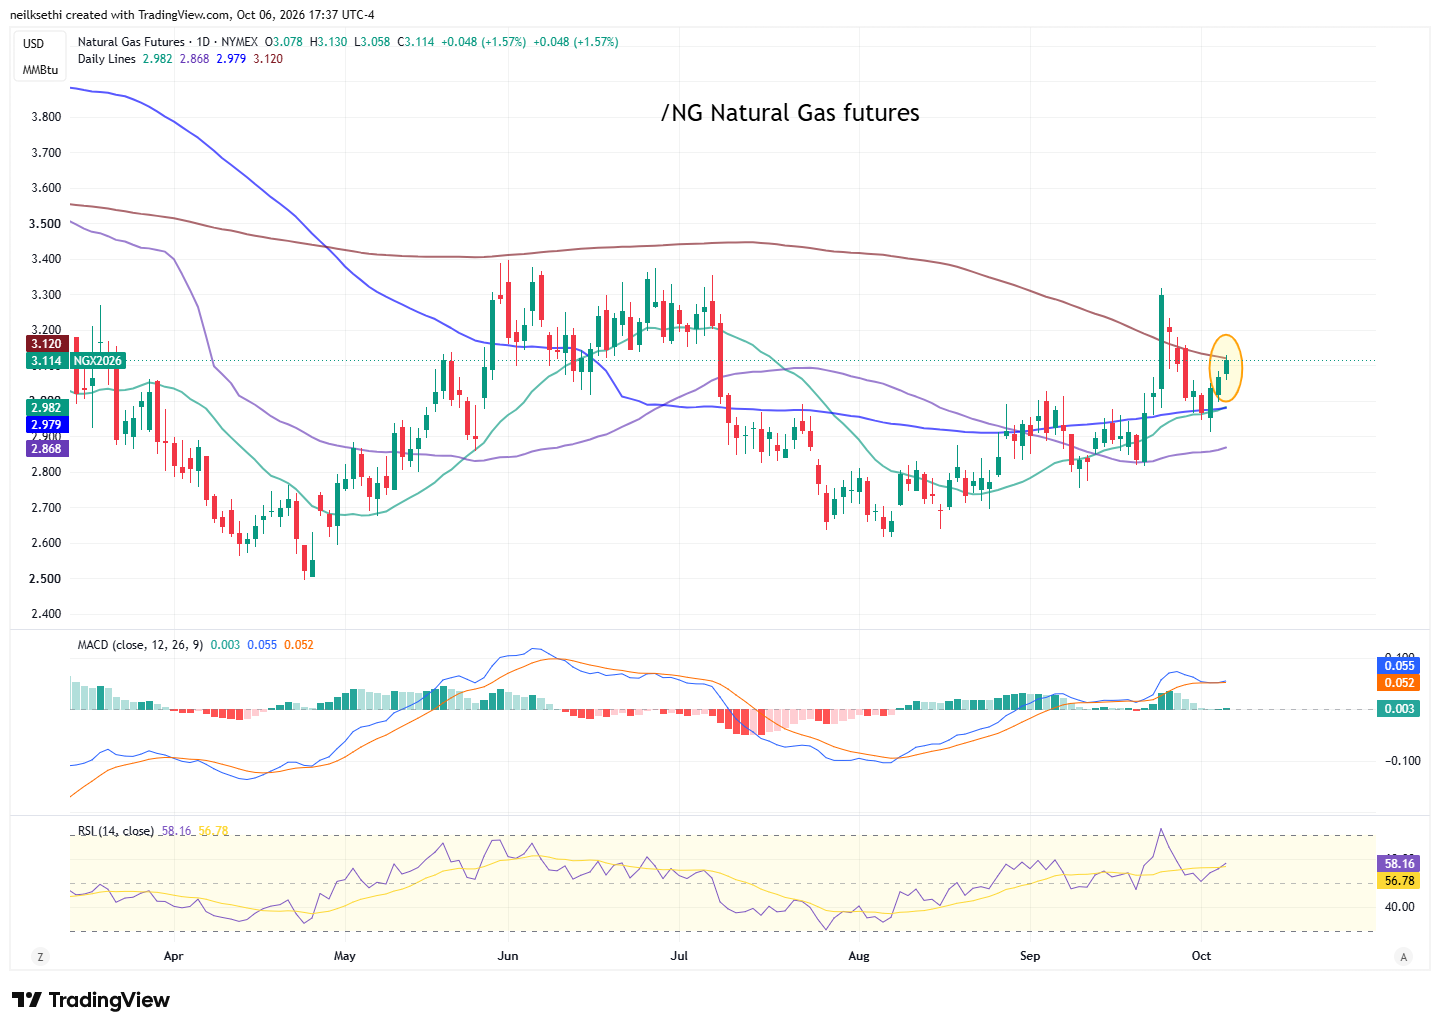
U.S. natural gas futures (/NG) were up for a third day to the 200-DMA but overall in the trading range stretching back to March.
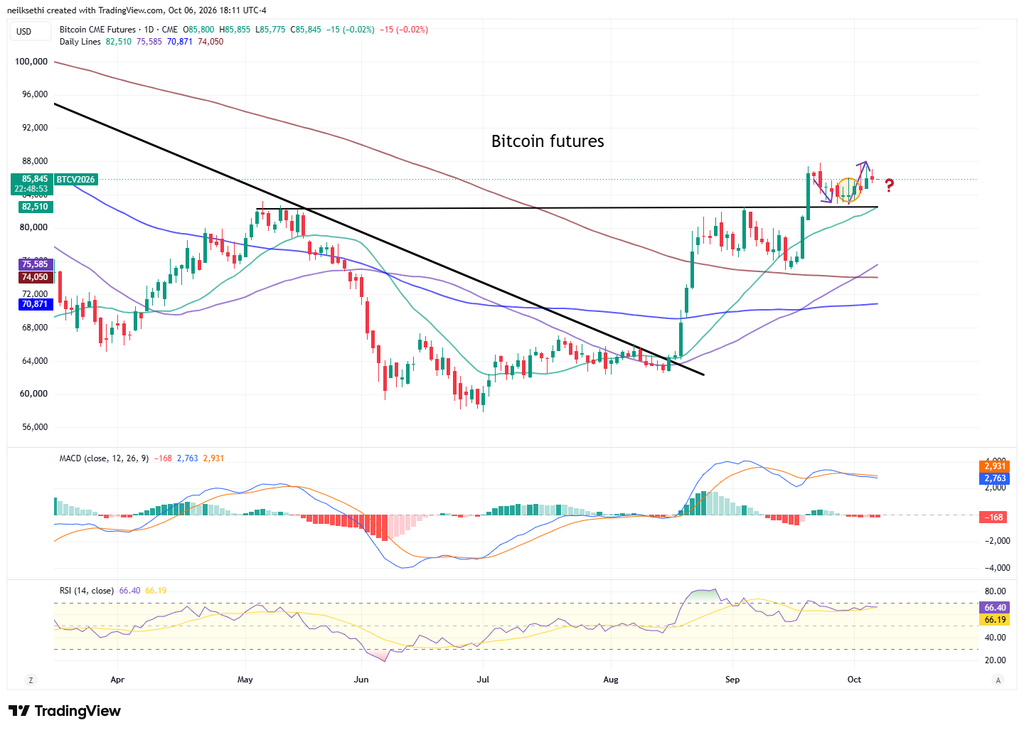
Bitcoin futures were little changed, for now keeping alive the “potential path” (for bulls) I laid out two weeks ago (in purple). Daily MACD is neutral while the RSI remains solidly positive. Bulls are looking for a close above $88,000, bears under $82,500.
More From TheStreet Pro:
- Doug Kass – 1999, 2007 and … Now It Feels Like Déjà Vu All Over Again
- James “Rev Shark” DePorre –
- Alex Frew McMillan – Is India’s Beaten-Down $315 Billion Sector Primed to Rebound?
And From Me If You Missed It:
Miscellaneous:
Wrap-Up: So Far So Good (Part II)
I said Sunday:
For now the setup remains constructive for the reasons mentioned above, and gamma levels remain high which should dampen volatility. So I’m starting the week eyeing higher levels — with, of course, a plan if indices go the other way.
And then Monday:
So far so good, with the Tech trade continuing to power higher and joined by even more of the non-Tech stocks Monday (although breadth metrics remain weak). Technicals are also improving on the indices as we went through earlier. Now, if we could just get that softening in bond yields.
For now, though, not much to complain about. The light week continues Tuesday, so fingers crossed we continue to get another grind higher in equities.
I don’t really have anything to add to that today. Tomorrow we do get a 10-year Treasury auction and the Fed minutes, but not until the afternoon, so markets will have much of the day to trade with little in terms of calendar catalysts (the NY Fed consumer survey is in the morning, but I don’t know that it’s ever been market moving). Let’s see if we can keep this going.
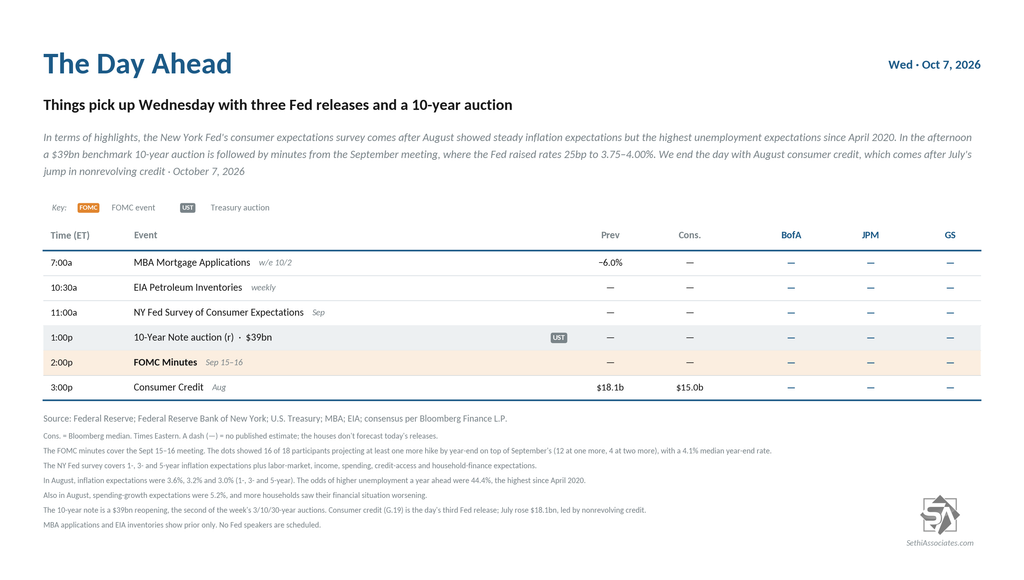
The Day Ahead: Wednesday Things Pick Up a (Little) Bit
U.S. economic data Wednesday brings us the NY Fed’s consumer expectations survey along with August consumer credit from the Federal Reserve and weekly mortgage applications and EIA petroleum inventories.
No Fed speakers but we’ll get the minutes from the September meeting.
Non-Bill (>1yr in maturity) U.S. Treasury auctions give us the benchmark 10-year note.
No SPX components reporting Wednesday.
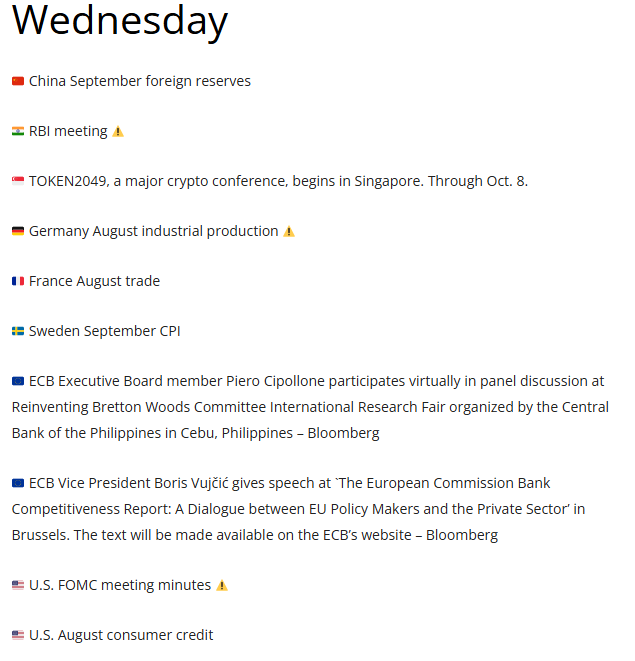
Ex-U.S. highlights include China September foreign reserves, Japan August labor cash earnings,
leading index, coincident index, Germany August industrial production, France
August current account balance, trade balance, Sweden September CPI. There’s also a policy decision from the RBI (India).
From Christophe Barraud’s international Week Ahead rundown:
At the time of publication, in terms of equities mentioned, Sethi was long NVDA, SOXL, MRVL, GOOG, CEG, QQQ, SPY, RSP, IWM, CPER, IBIT, and numerous equities in the energy sector. The disclosure in Monday’s column should also have included a long position in EWZ.
As a reminder comments are encouraged! If they are directed at me, please put @NeilSethi in front.



