Trade Deficit Widens to Largest in 19 Months on Record Imports
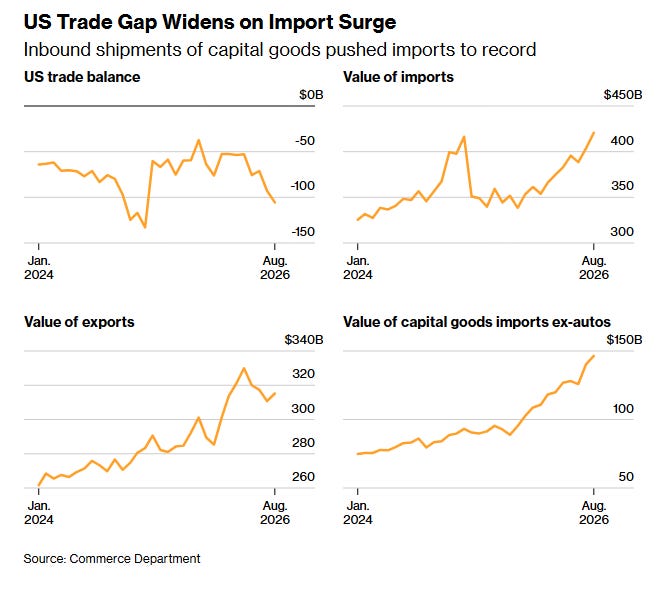
The trade gap grew to $105.6 billion as oil, gold, aircraft and capital goods — driven by AI — pushed imports to a record.
You've reached your free article limit
You've read 0 of 1 free Pro articles.

- U.S. Trade Balance (August): -$105.6 billion (estimate -$102.1 billion; prior -$88.6 billion; prior revised -$92.8 billion).
- Imports: +4.3% (estimate +4.2%; prior +2.8%).
- Exports: +1.4% (estimate +1.2%; prior -2.1%).
Executive Summary
- The U.S. trade deficit widened 13.7% to $105.6 billion in August, the largest since March 2025, as imports rose to a record.
- Industrial supplies led the import increase, rising $9.1 billion, about two-thirds of it from crude oil and nonmonetary gold.
- Capital goods imports climbed $6.2 billion to a record $146.4 billion, up 57.9% from a year earlier, led by a record jump in semiconductors and higher aircraft imports.
- Exports rose $4.5 billion, with gold and petroleum again doing most of the work while pharmaceuticals, autos and soybeans fell.
- The deficit with Canada widened to the largest since the start of 2025 ahead of new tariffs, while the gaps with Mexico, Vietnam and Malaysia hit records on a not-seasonally-adjusted basis.
- Goldman Sachs cut its third-quarter GDP tracking estimate by 0.3 percentage points to 3.1%.
August Trade Balance
Note: All figures are seasonally adjusted and nominal (not adjusted for price changes) unless otherwise noted.
The trade deficit widened by $12.7 billion, or 13.7%, to $105.6 billion in August, the largest since March 2025, from an upwardly revised $92.8 billion in July (originally reported at $88.6 billion). Economists surveyed by Bloomberg had looked for a $102.1 billion shortfall. The widening was driven almost entirely by goods, with the goods deficit growing $12.8 billion to $136.6 billion, also the largest since March 2025, while the services surplus was essentially unchanged at $31.0 billion.
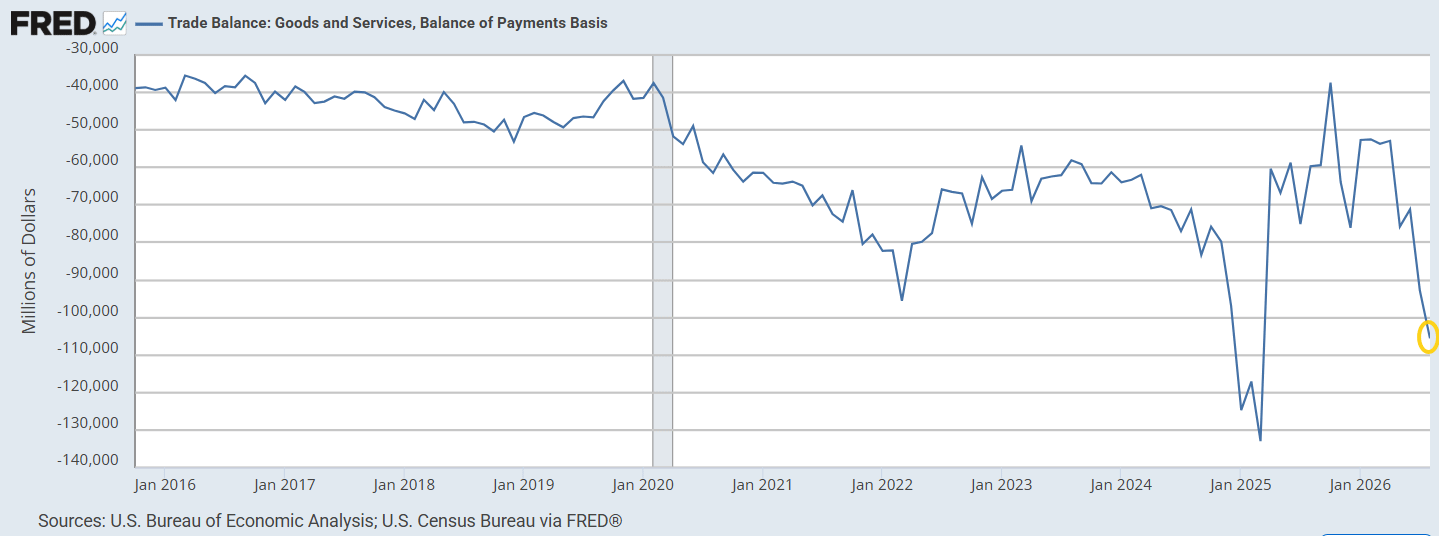
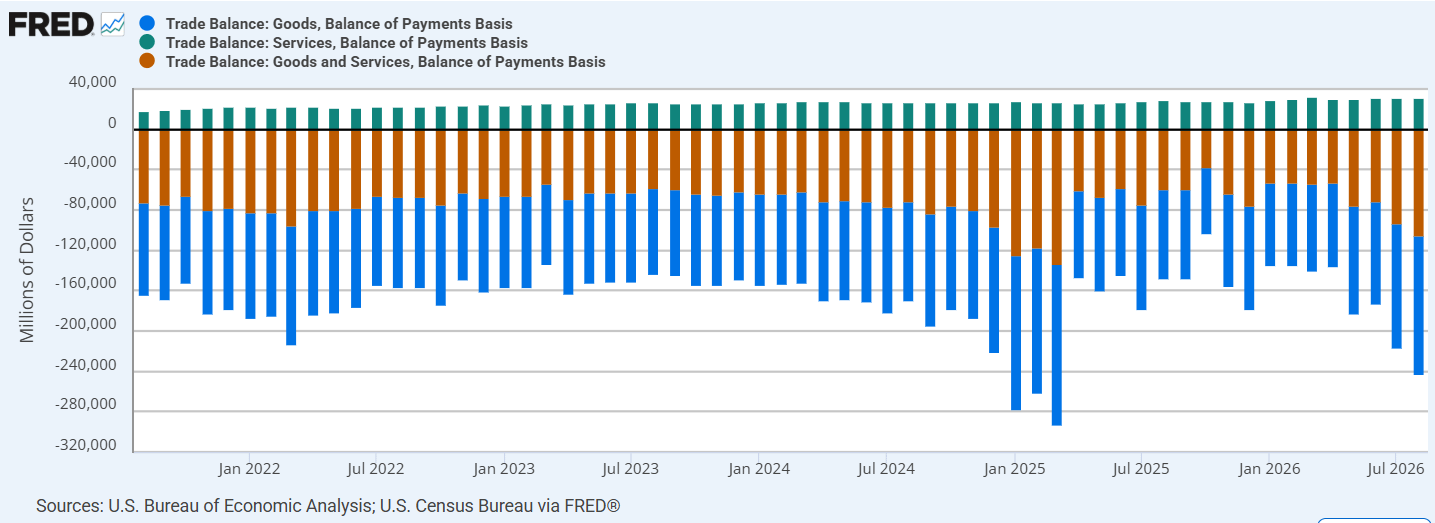
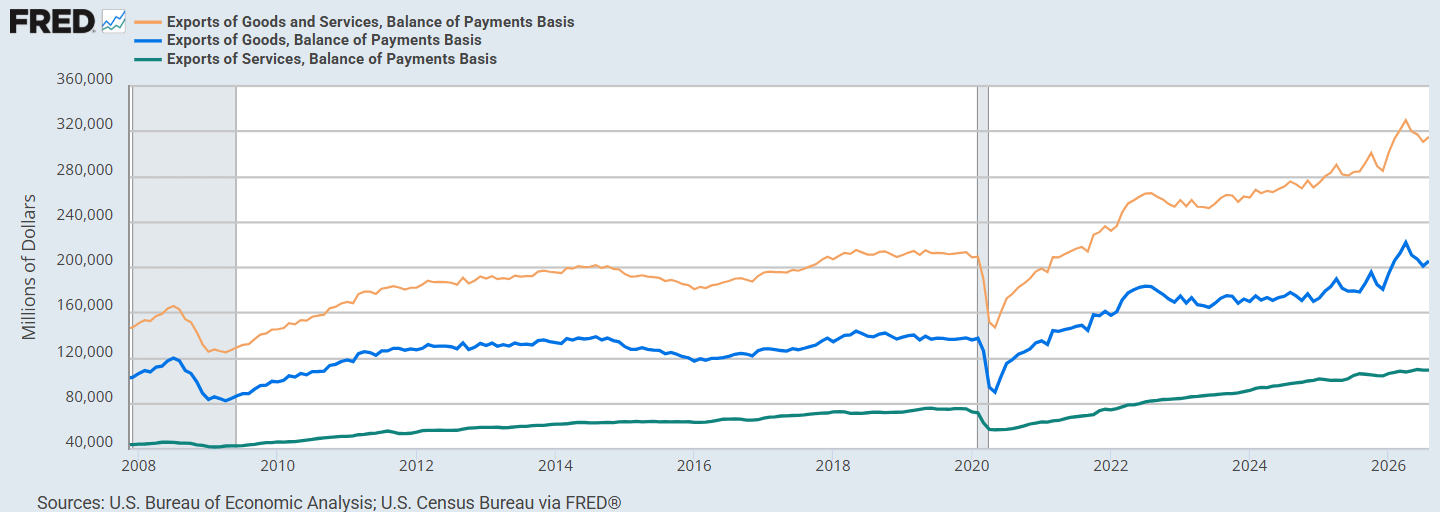
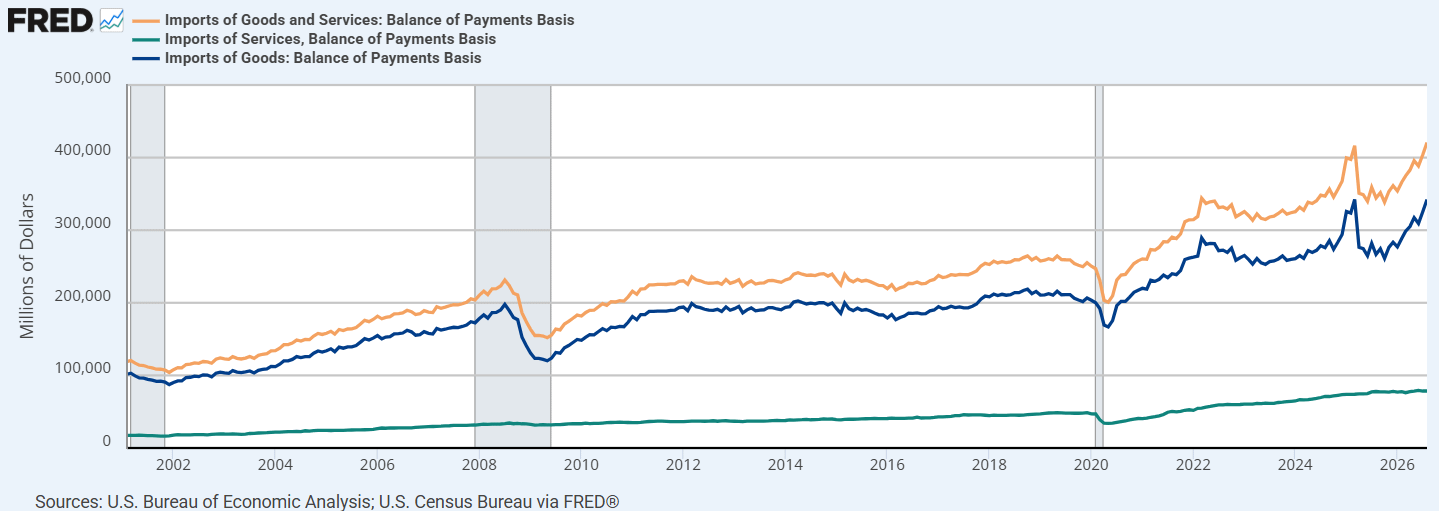
Exports rose $4.5 billion, or 1.4%, to $315.2 billion, while imports rose $17.2 billion, or 4.3%, to a record $420.8 billion (more details on both below). The three-month average deficit increased $9.9 billion to $89.9 billion.
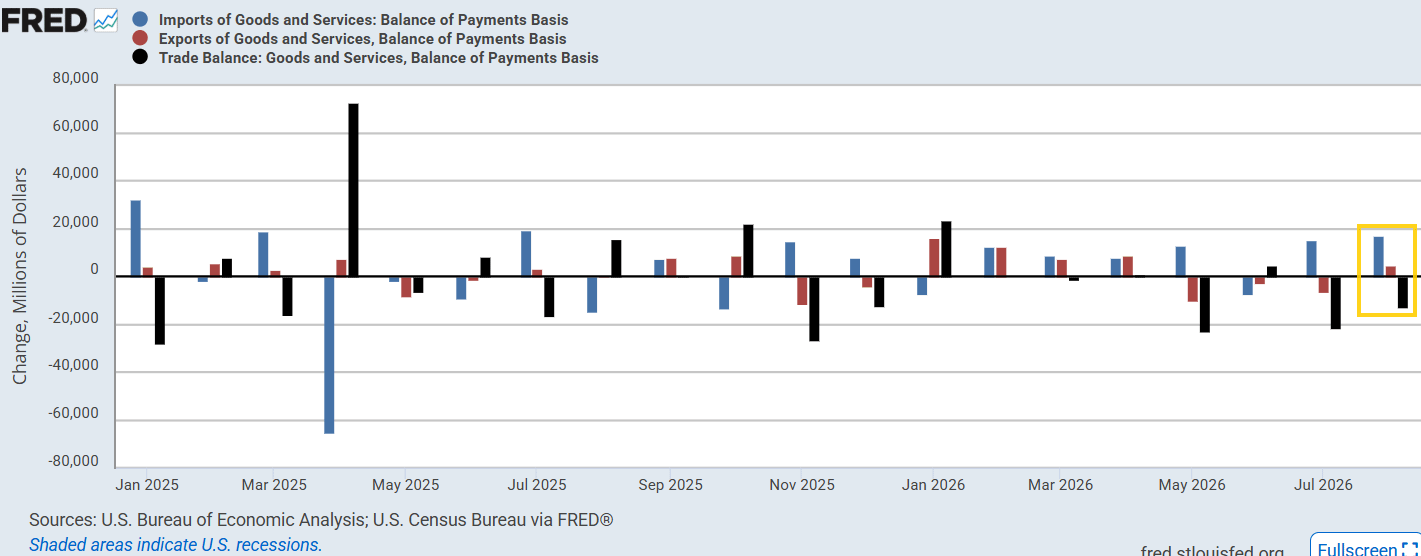
Year-to-date, the deficit is still running $138.2 billion, or 19.9%, below the same period of 2025, which had been inflated by tariff front-running, as exports have grown $267.7 billion (11.8%) against a $129.5 billion (4.4%) increase in imports.
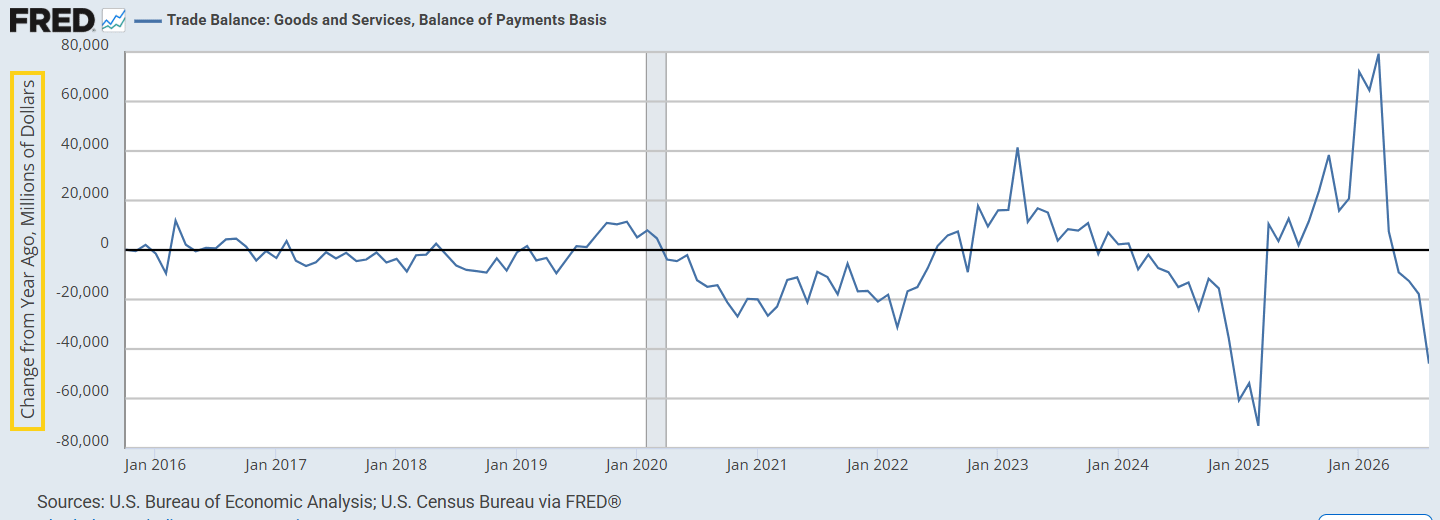
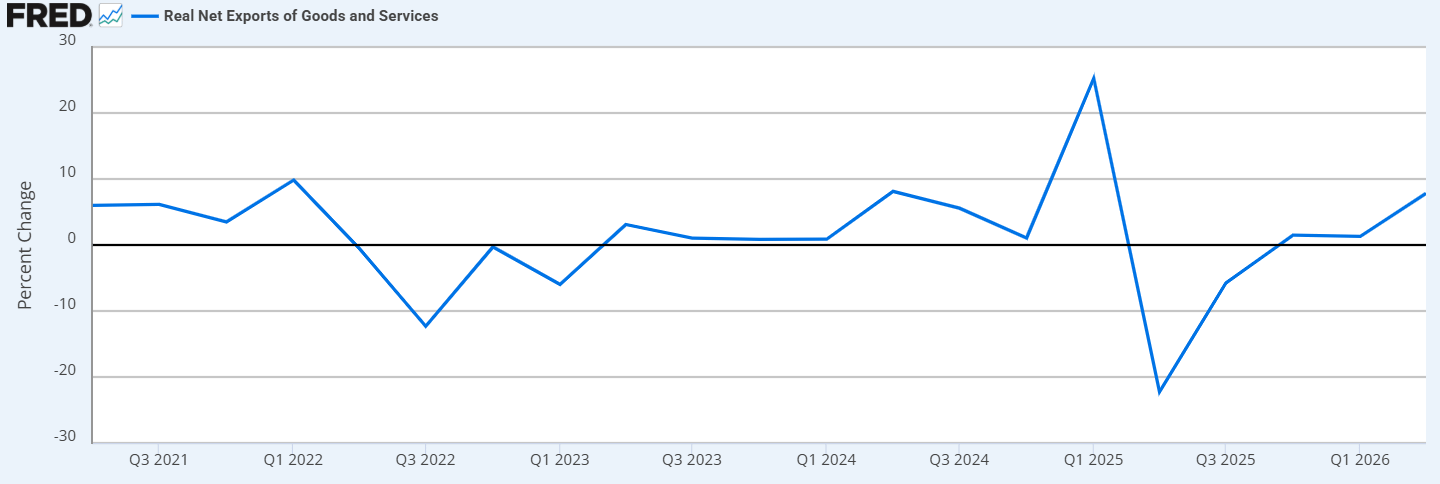
On an inflation-adjusted basis, the goods deficit widened $8.7 billion, or 8.2%, to $114.7 billion, also the largest since March 2025, compared with an 11.1% increase in the nominal goods deficit. Before today’s release, the Atlanta Fed’s GDPNow model indicated net exports would subtract 2.59 percentage points from third-quarter GDP based on the preliminary goods numbers last week, which Bloomberg noted would be the most since early 2025. Goldman Sachs cut its third-quarter GDP tracking estimate by 0.3 percentage points to 3.1% after today’s release.
Exports
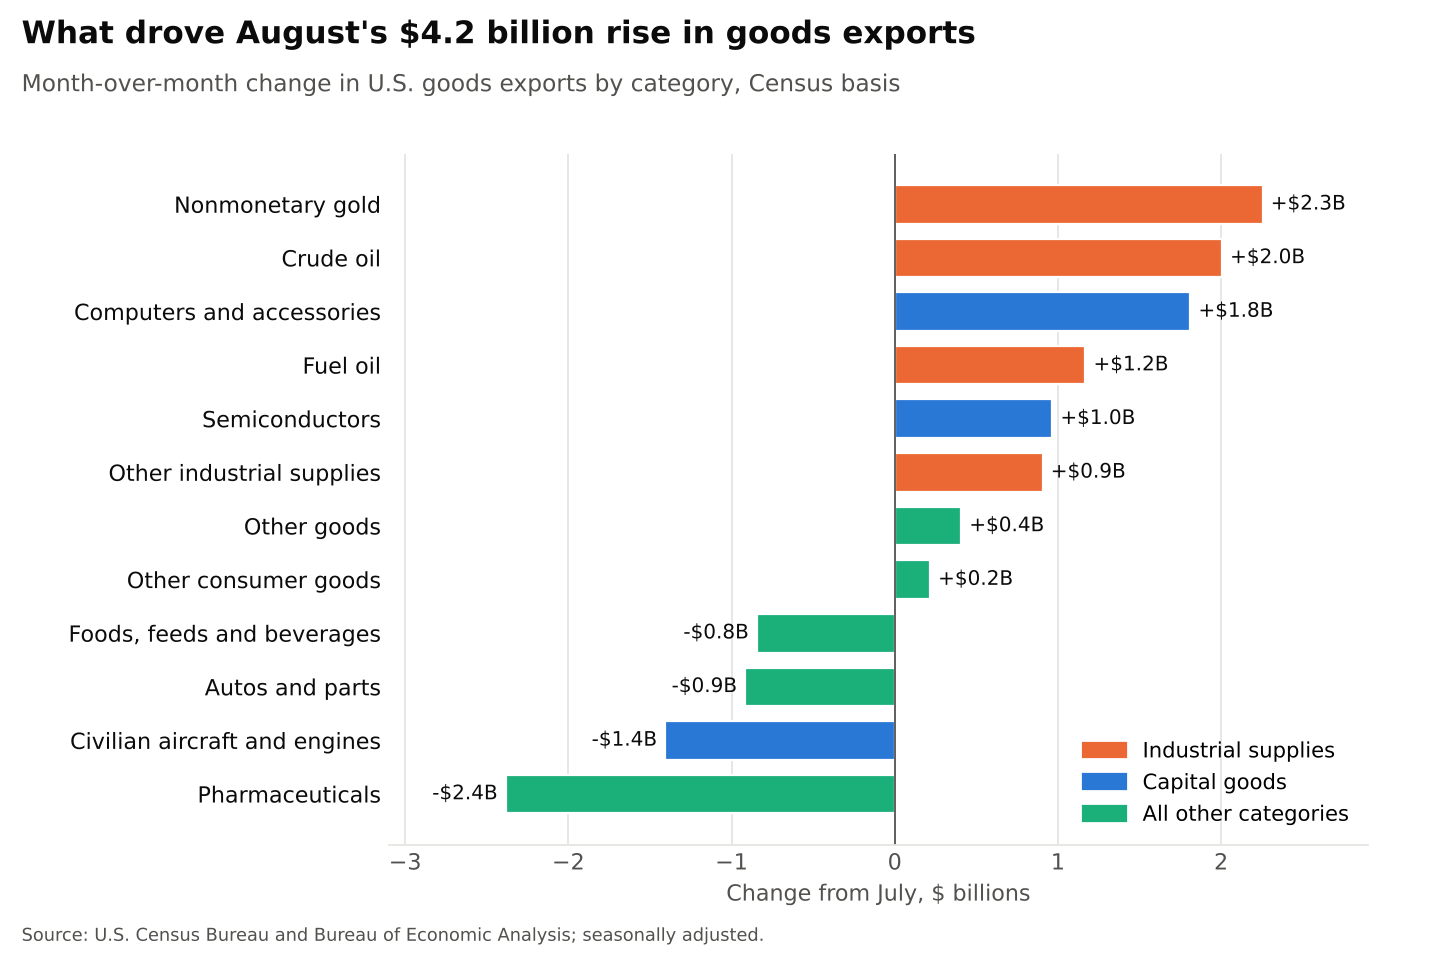
Goods exports rose $4.4 billion to $205.7 billion, but as has been the case for much of the year, the gain was concentrated in industrial supplies, which rose $6.3 billion to $77.8 billion. Within that, nonmonetary gold rose $2.3 billion to $7.6 billion and crude oil rose $2.0 billion to $10.9 billion, with fuel oil adding another $1.2 billion. Petroleum exports rose $3.6 billion to $29.8 billion, leaving the petroleum surplus little changed at $9.4 billion, down from $17.8 billion in April.
Capital goods exports rose $1.3 billion to $69.5 billion, led by semiconductors (+$1.0 billion), computers (+$0.9 billion) and computer accessories (+$0.9 billion), partly offset by declines in civilian aircraft (-$1.0 billion) and aircraft engines (-$0.4 billion).
Elsewhere, consumer goods exports fell $2.2 billion to $20.9 billion on a $2.4 billion drop in pharmaceuticals, autos fell $0.9 billion to $12.6 billion (passenger cars and trucks each down about $0.5 billion), and foods, feeds and beverages fell $0.8 billion to $14.2 billion on a $0.9 billion drop in soybeans.
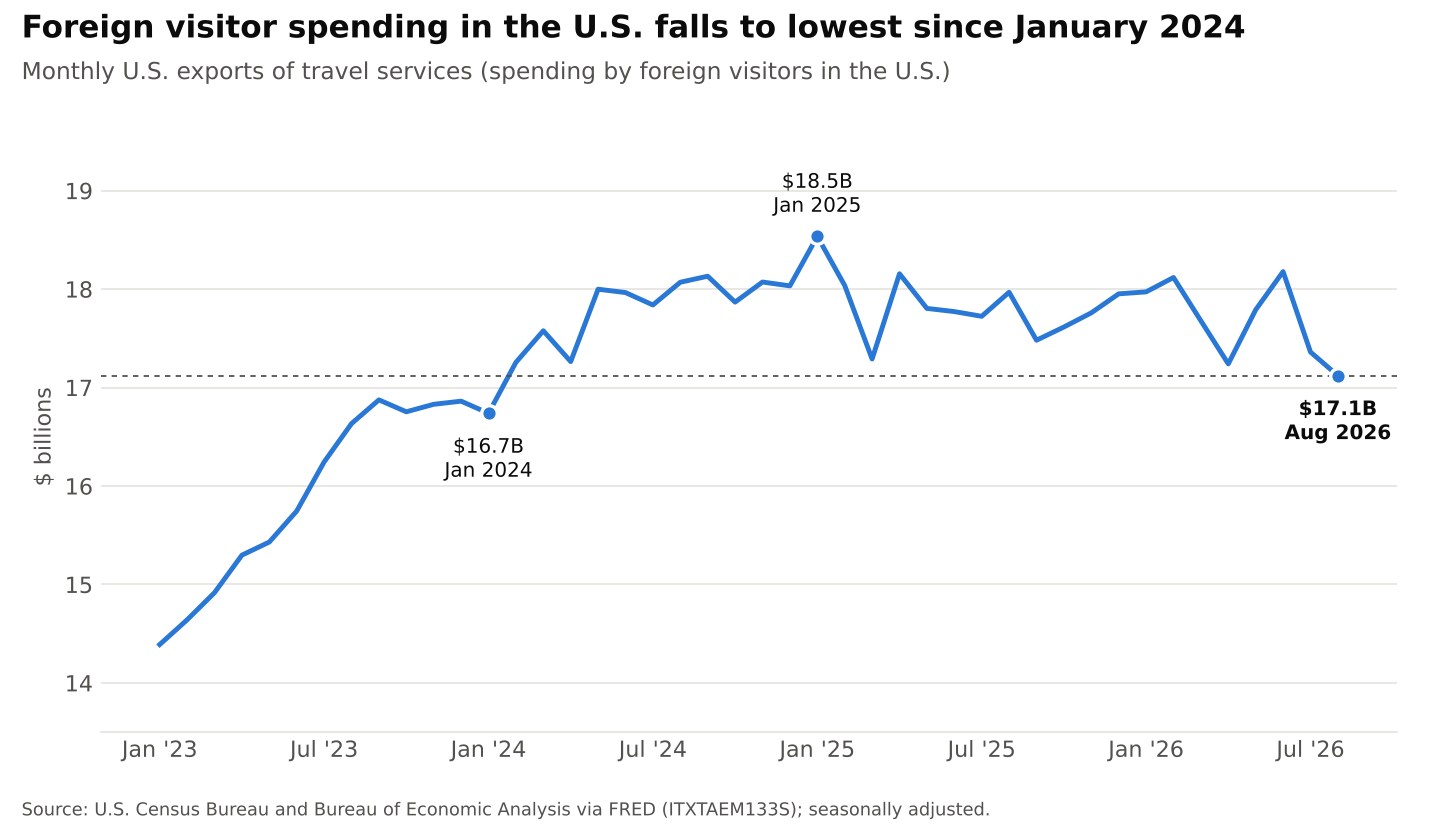
Exports of services (which include spending by foreign visitors to the U.S.) were essentially unchanged at $109.5 billion. Charges for the use of intellectual property rose $0.2 billion, while travel fell $0.2 billion to $17.1 billion, the lowest since January 2024, according to FRED.
Imports
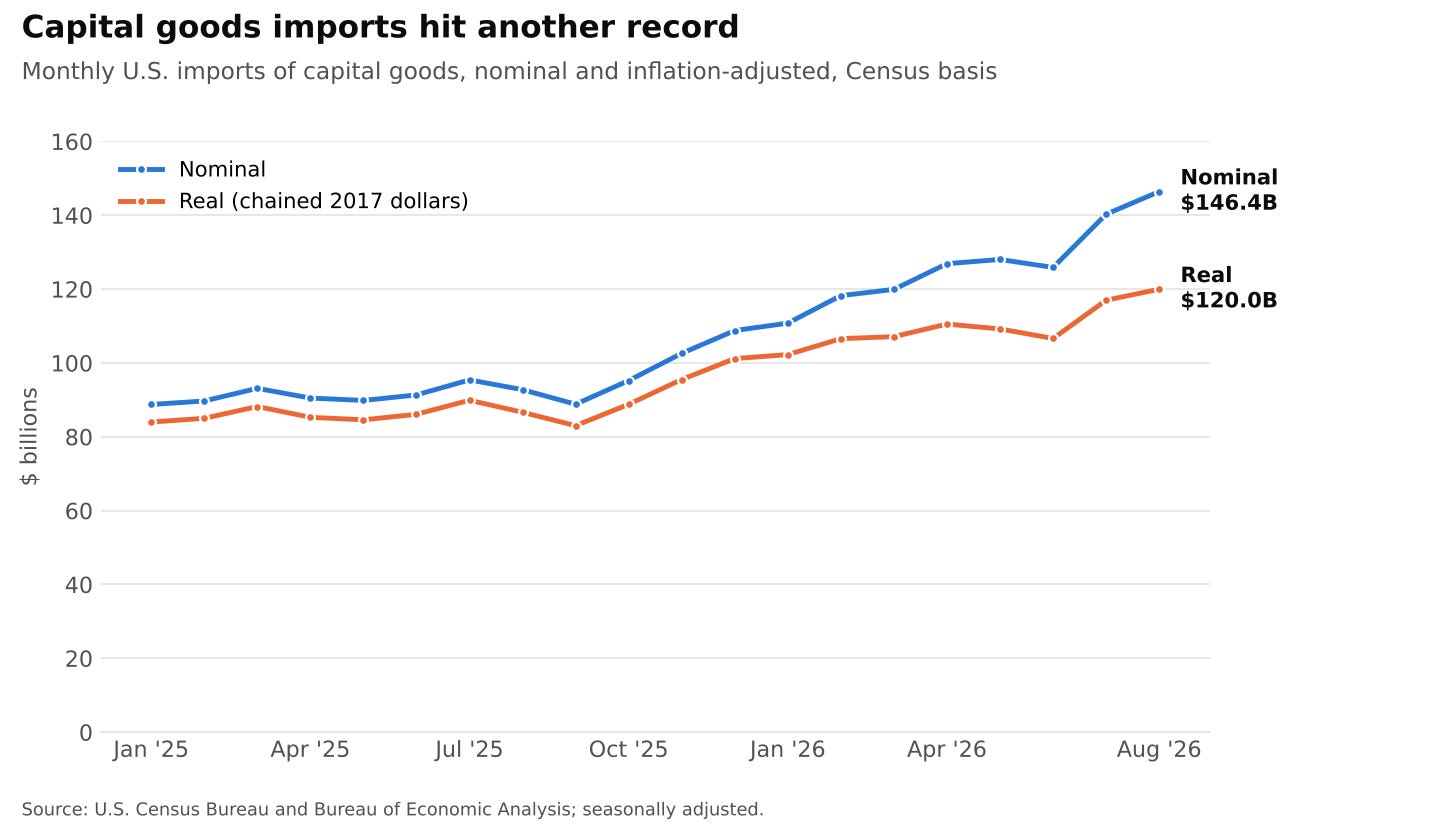
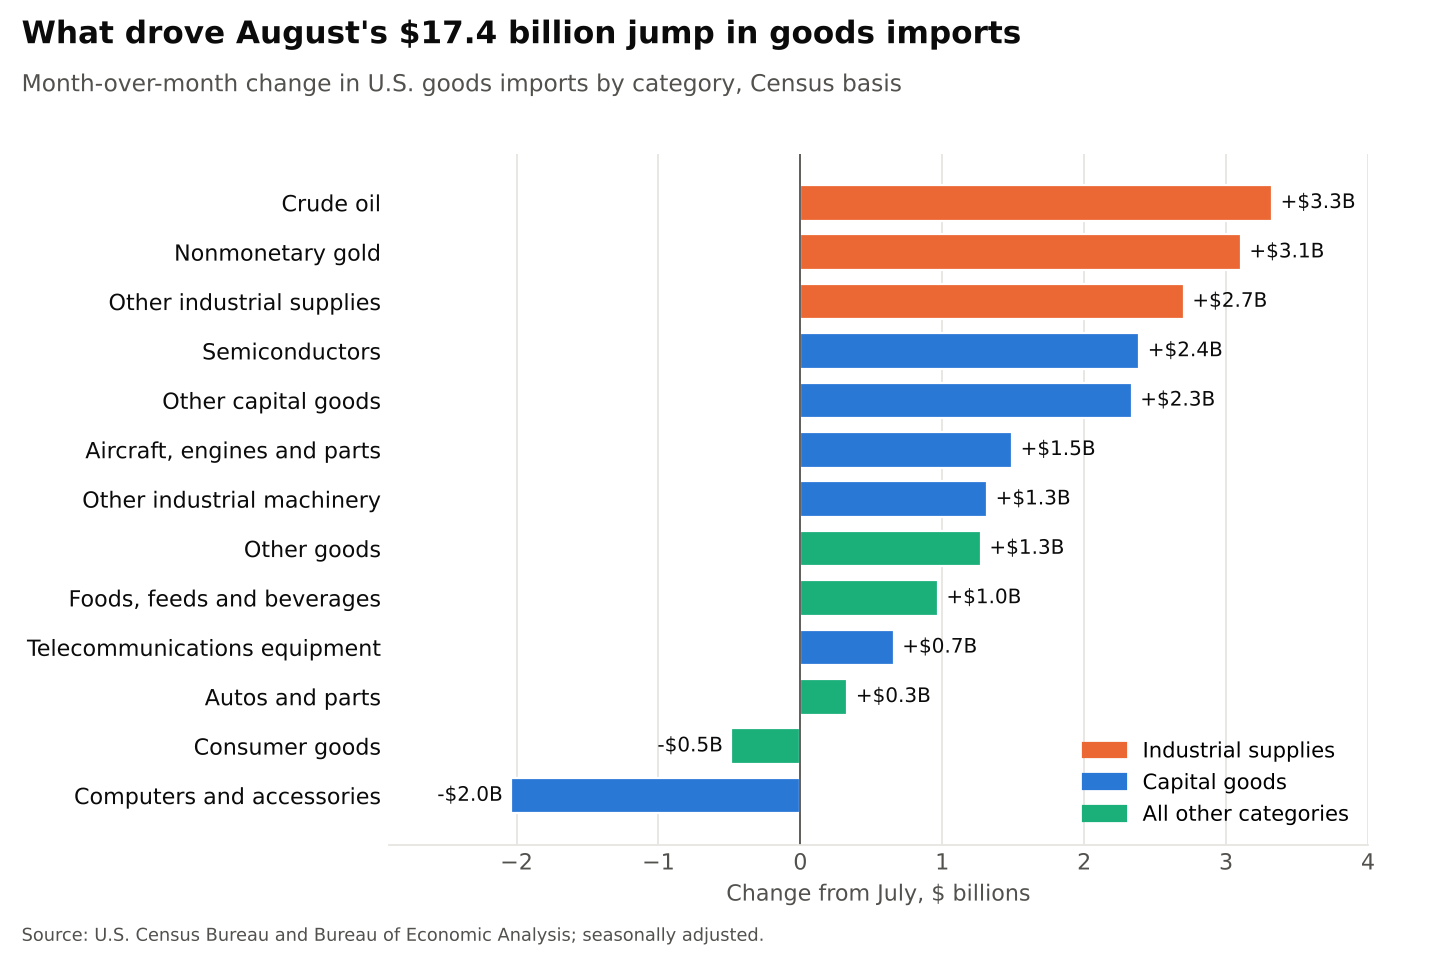
Goods imports rose $17.2 billion, or 5.3%, to $342.2 billion. Capital goods imports climbed $6.2 billion to a record $146.4 billion, up 57.9% from August 2025, continuing the AI-driven investment theme that has run through 2025 and 2026.
Semiconductors jumped $2.4 billion to $15.4 billion, a record monthly increase according to Bloomberg, with other industrial machinery (+$1.3 billion), civilian aircraft (+$0.9 billion), telecommunications equipment (+$0.7 billion) and aircraft engines (+$0.4 billion) also rising. Computer accessories (-$1.6 billion) and computers (-$0.4 billion), which led the surge earlier in the year, both slipped.
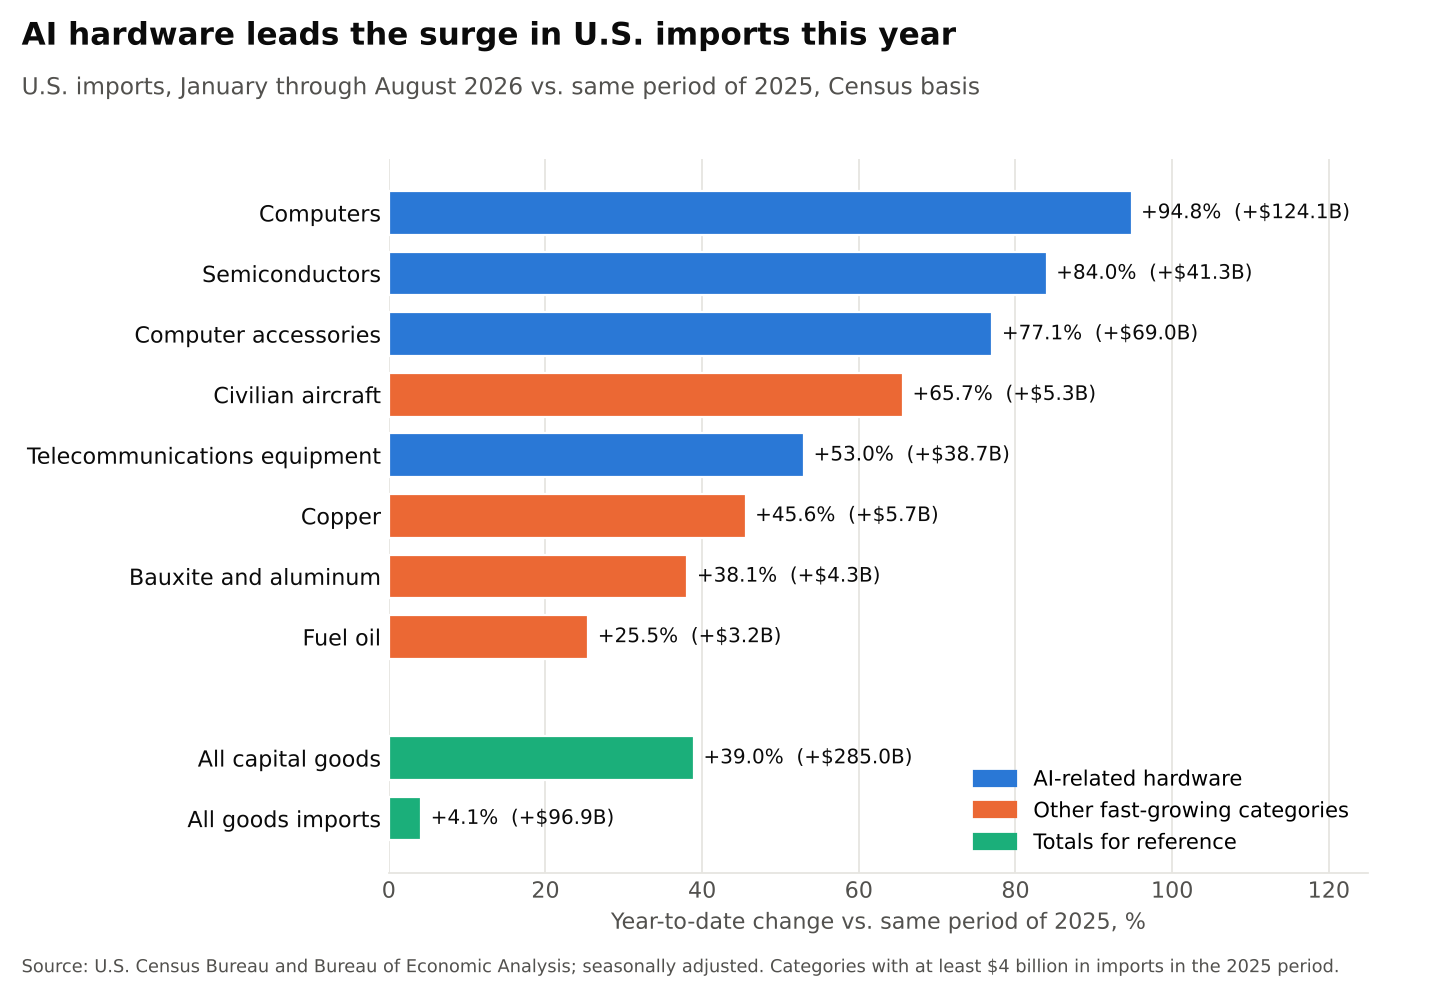
Year-to-date capital goods imports total $1.02 trillion through August, up $285.0 billion (39.0%) from the same period last year, with computers up 94.8% and semiconductors up 84.0%. In real terms, capital goods imports rose $3.0 billion to a record $120.0 billion.
Industrial supplies imports rose $9.1 billion to $62.7 billion, but about two-thirds of the increase came from crude oil (+$3.3 billion to $15.4 billion) and nonmonetary gold (+$3.1 billion to $4.7 billion). Bloomberg noted that the monthly figures have been prone to wide swings because of tariffs and, more recently, “war-driven volatility in crude oil prices.” Excluding petroleum, the goods deficit widened $13.1 billion to $141.5 billion, the largest since March 2025.
Other goods imports rose $1.3 billion, foods, feeds and beverages rose $1.0 billion and autos rose $0.3 billion, while consumer goods fell $0.5 billion on a $1.2 billion decline in pharmaceuticals.
Imports of services (which include spending by U.S. travelers abroad) were essentially unchanged at $78.5 billion, as a $0.4 billion increase in transport was offset by declines in intellectual property charges (-$0.2 billion), travel (-$0.1 billion) and insurance (-$0.1 billion).
Trade by Country
The biggest country move came from Canada, where the goods deficit widened $4.1 billion to $7.1 billion, the largest since the start of 2025, as imports from Canada jumped $4.6 billion to $37.1 billion. Companies in both countries accelerated shipments to get ahead of tariffs after trade talks collapsed in August.
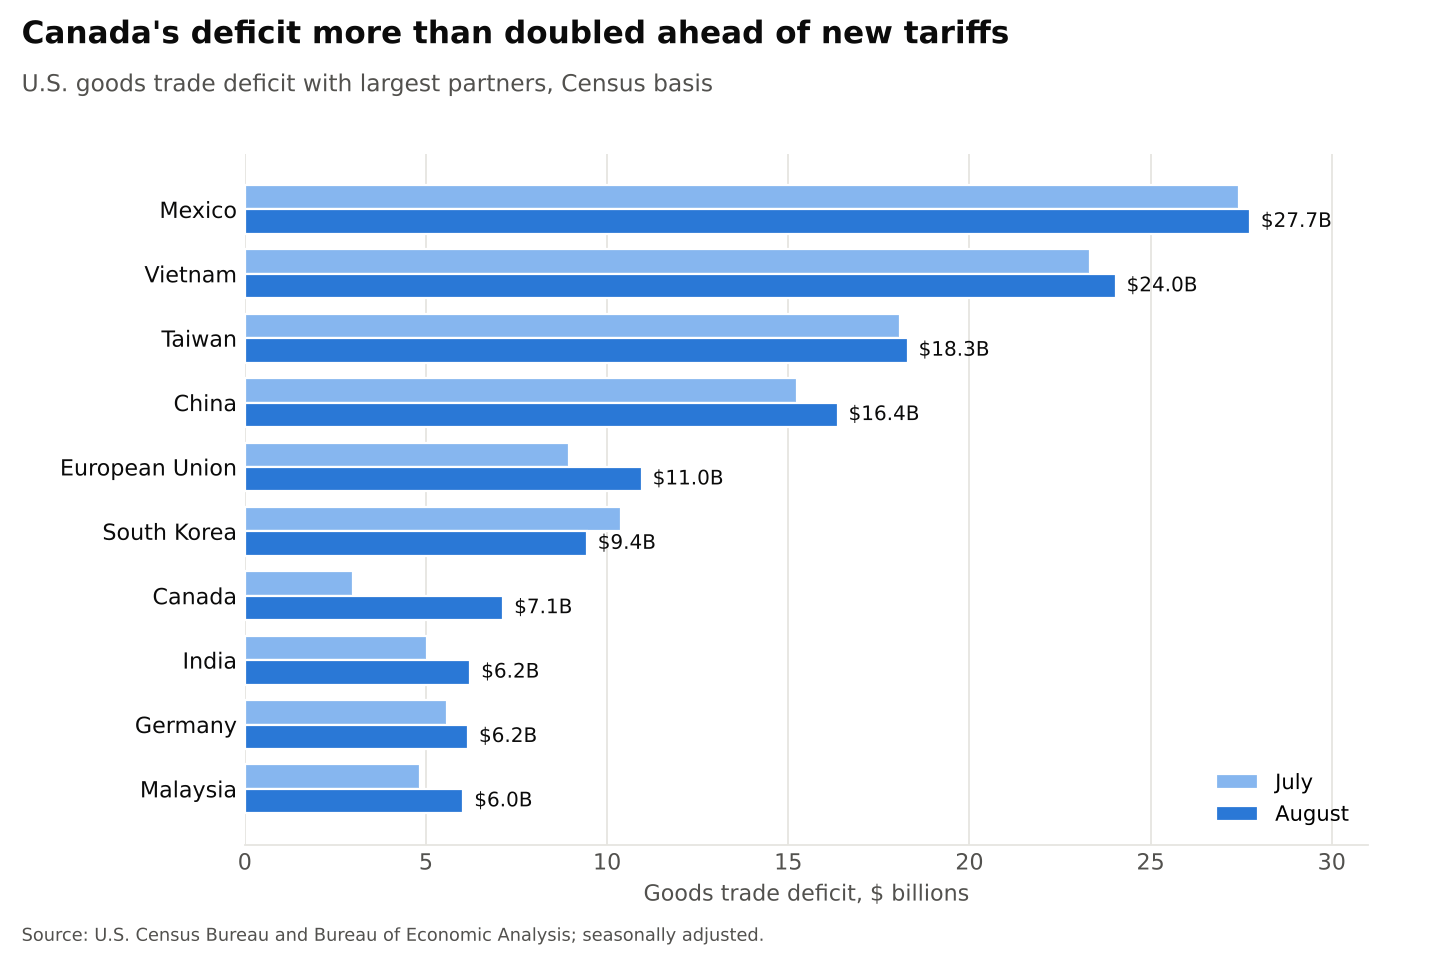
The deficits with Mexico and Vietnam each widened slightly, to $27.7 billion and $24.0 billion, respectively. On a not-seasonally-adjusted basis, the Census Bureau said the deficits with Mexico ($27.0 billion), Vietnam ($25.0 billion) and Malaysia ($5.5 billion) were all records, as were imports from Mexico ($60.6 billion), Vietnam ($26.5 billion), Malaysia and Italy. The shortfall with Taiwan, a key semiconductor supplier, grew $0.2 billion to $18.3 billion. The deficit with China widened $1.1 billion to $16.4 billion as exports to China fell $1.3 billion, though year-to-date the China deficit is down 25.1% from 2025, which saw the full-year deficit with China narrow to the smallest in more than 20 years.
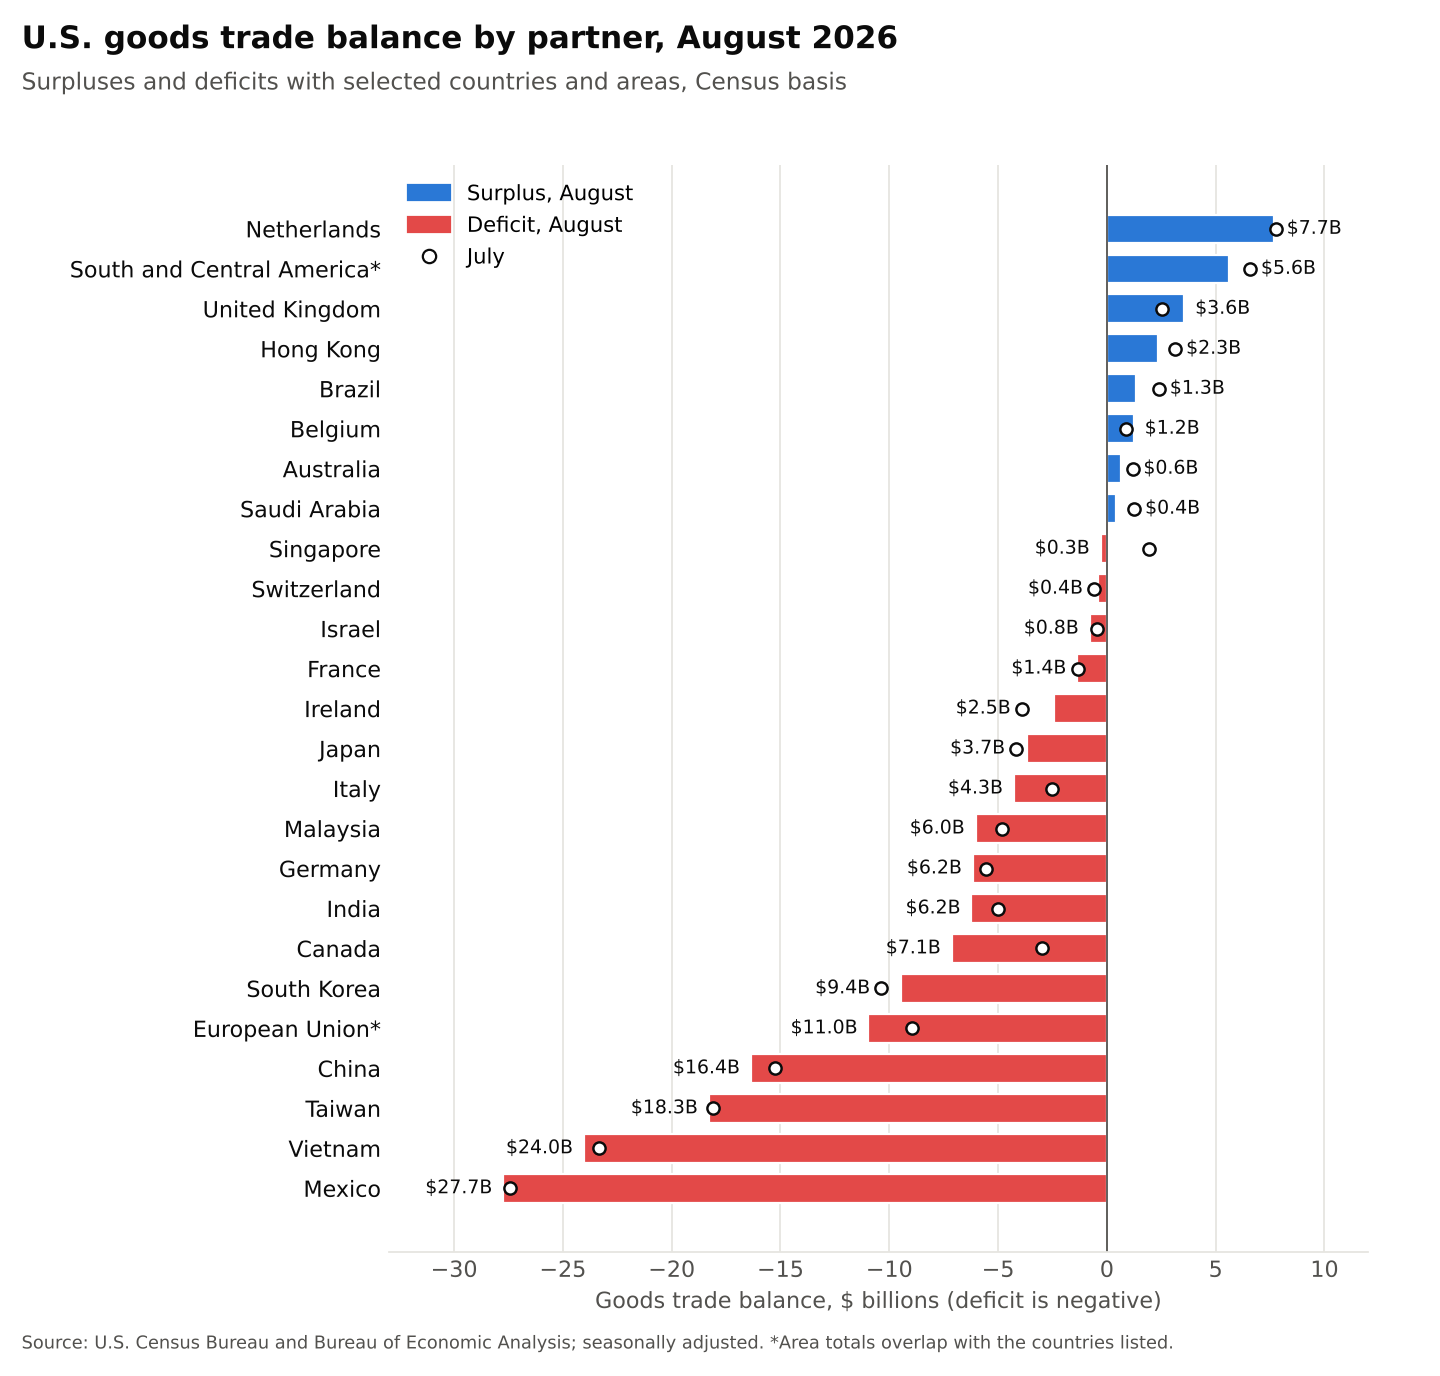
The deficit with the European Union widened $2.0 billion to $11.0 billion as imports from the bloc rose $5.2 billion, including a $1.7 billion widening with Italy. The gaps with India and Malaysia each widened $1.2 billion, while South Korea’s narrowed $0.9 billion and Ireland’s narrowed $1.5 billion. Singapore flipped from a $1.9 billion surplus in July to a small deficit. The surplus with Belgium was the highest since April 2023 on a not-seasonally-adjusted basis, with exports to Belgium the highest since March 2023.
The August figures show surpluses, in billions of dollars, with Netherlands ($7.7), South and Central America ($5.6), United Kingdom ($3.6), Hong Kong ($2.3), Brazil ($1.3), Belgium ($1.2), Australia ($0.6) and Saudi Arabia ($0.4). Deficits were recorded, in billions of dollars, with Mexico ($27.7), Vietnam ($24.0), Taiwan ($18.3), China ($16.4), European Union ($11.0), South Korea ($9.4), Canada ($7.1), India ($6.2), Germany ($6.2), Malaysia ($6.0), Italy ($4.3), Japan ($3.7), Ireland ($2.5), France ($1.4), Israel ($0.8), Switzerland ($0.4) and Singapore ($0.3).
Sources: U.S. Census Bureau and U.S. Bureau of Economic Analysis, U.S. International Trade in Goods and Services, August 2026; historical comparisons.
