Chart of the Day: Meta’s Not Lookin’ So Hot
With an ugly court battle underway, let’s turn to the chart of Meta to see its story.
You've reached your free article limit
You've read 0 of 1 free Pro articles.
It is getting harder and harder to have faith in Mark Zuckerberg and the Meta Platform (META) team. It seems around every corner there is trouble. We can go back a dozen years to find small things that turned into big messes for Meta where they needed to change the way they did business, and also to pay a hefty fine. The most recent court case that started this week may be the defining moment for Meta if they do not win, and while any appeal could take years to resolve, the court of public opinion is already making their case against them.
All that aside, the stock has been a terrible performer in 2026, falling some 17% in a very competitive year for investor dollars. The S&P 500 is higher by at least 12%, so that is very poor relative performance for a company that carries a high premium. Further, the spending on AI and its tools are causing headaches for investors, how much more are they going to spend to make it worth their while?
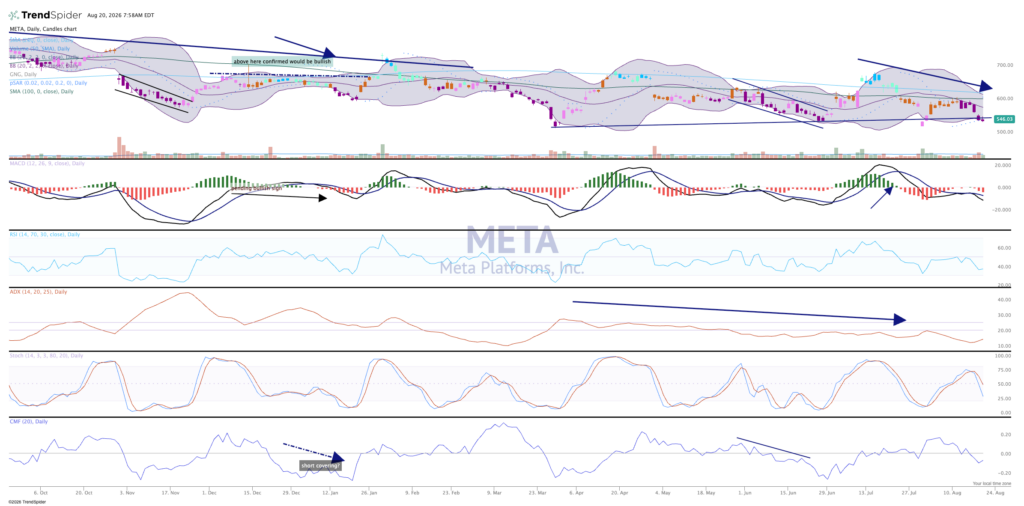
The chart is not giving any bullish clues either, the recent break of a strong support level at $550 is notable. Money flow, as seen at the bottom of the chart, remains negative. The moving average convergence divergence just went on a sell signal, as you can see in the second pane. Candles at the top of the chart are purple, which reflects bearish on the GoNoGo composite of indicators. The best we can say here is the stock might stop going down (not a prediction) and move sideways for some weeks in a consolidation. The break, however, is not positive and makes the sideways move much less likely.
We have Meta Platforms rated a “hold” in Pro Portfolio.
At the time of publication, the Pro Portfolio was long META.
