Charting the S&P 500: New Highs, But Was It Convincing Enough?
The S&P joined the Nasdaq in printing a new high this past week, but can it continue?
You've reached your free article limit
You've read 0 of 1 free Pro articles.
Our weekly chart shows a nice break higher this past week, with higher highs and higher lows but still a pretty tight range. A new all-time high and close were printed earlier in the week for the first time since May. That is impressive, but as we have stated several times, the indices are masking some weakness under the hood.
While volatility remains nascent the tech stocks continue to thrive. Much of the industrials and small-caps, though, are gasping for air, and that creates a very unhealthy condition. As usual, it won’t matter much until it starts to matter.
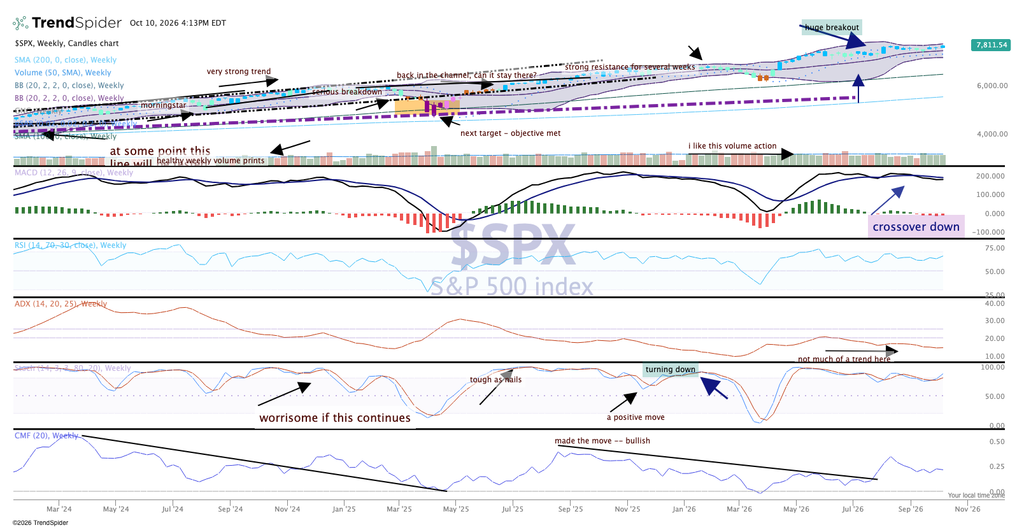
The indicators showed some improvement with a bullish crossover on the stochastics. MACD remains elevated but on a sell signal, the parabolic SAR (stop and reverse) is still in bullish mode, and the candles are blue, which indicate bullishness in the price action.
At some point a strong breakout on volume will hit. This last couple of weeks of upside have printed good volume trends, but not quite strong enough. Bank earnings and option expiration may clear things up.
