Stocks Tumble As Yields Surge
A jump in yields to fresh multi-year highs cascaded through markets Wednesday.
You've reached your free article limit
You've read 0 of 1 free Pro articles.
Quick Summary
- Stocks fell broadly Wednesday pressured by a surge in Treasury yields — the largest move across the curve since liberation day — as well as oil prices breaking their five-day skid.
- A jump in the composite flash PMI from S&P Global to the strongest in over five years (see my analysis here), paired with a hawkish speech from Fed Governor Barr that drove Fed rate hike expectations higher (more on that in the yields section), sent yields rocketing to multi-year (and in many instances multi-decade) highs. A historically weak 5-year Treasury auction added fuel to the fire.
- The 10-year jumped ~14 basis points to 5.11%, its highest close since July 2007 and biggest one-day move since April 2025, and the 2-year ~14bp to ~4.89% (highest since May 2024), while the 5-year breached 5% for the first time since 2007 after the soft $70 billion auction. October hike odds jumped to ~69% from ~55% a day earlier (and just ~9% a month ago), with markets now pricing nearly four hikes in total over the next year.
- All four indexes would drop, led by the rate-sensitive Russell 2000 (-1.8%). The Nasdaq fell 1.1% on Tech weakness, the S&P 500 0.75%, and the Dow Jones Industrial Average 0.68%.
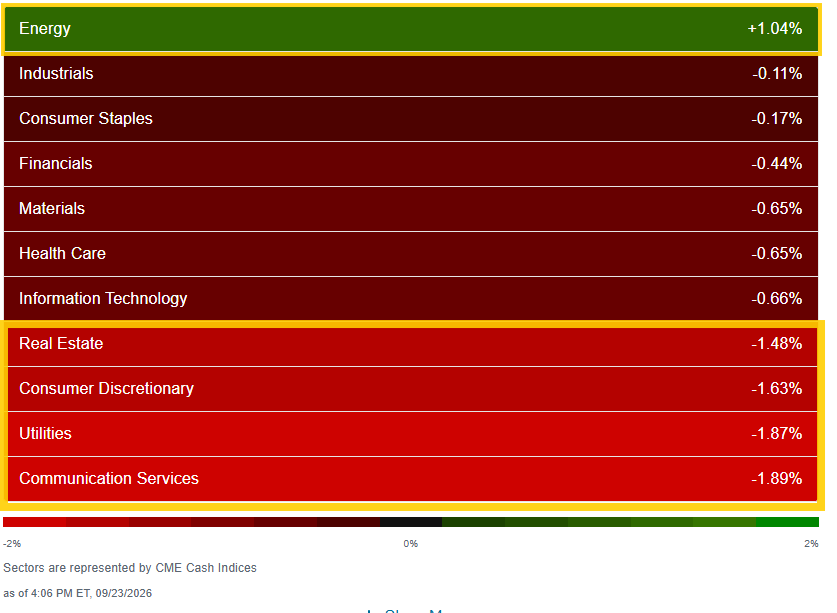
- Breadth collapsed to just 1 of 11 sectors higher — Energy, +1% on the oil move. Semiconductors broke their six-day winning streak.
- Attention Thursday turns to the Trump–Xi summit to be followed by a dinner with top US CEOs (discussed more in the final section). In late breaking news, BBG reports that Treasury Secretary Scott Bessent said he and his Chinese counterpart agreed to extend the so-called Busan agreement for two months.“I don’t know whether a bigger deal can be done. I don’t know whether we will just roll the current deal,” Bessent said in an interview on Fox News.
Market Commentary
Equities:
- Brett Ewing, chief market strategist at First Franklin Financial Services, told CNBC he thought the S&P 500 could hit 8,200 before the year is through.“Our call at the beginning of the year was 8,000 on the S&P. We raised our target, believe it or not, in August to 8,200 by year-end,” he said.
- “Risk sentiment in equities, but also the outlook for interest rates and inflation is going to trade a lot around expectations and movements in the oil price,” said Emma Moriarty at CG Asset Management. “Brent has fallen, but the overall level is still very high and it probably needs to go some way further.”
- “We have a lot of strength in corporate earnings, but we also have this inflationary pressure, and there’s a tug of war there,” Massimo Santicchia, head of U.S. equities at Procyon, said to CNBC, adding that it’s “not just oil” that’s driving inflation. “It’s broader, and it’s particularly in the services sector,” he said. “There’s no way that the Fed is going to lower rates or pause at this point. Probably we’re going to see maybe two, three rate increases.”
- “Our base case is for energy disruption to remain relatively limited and an inflation shock that does not become sufficiently broad or persistent to derail growth,” said Ulrike Hoffmann-Burchardi at UBS Chief Investment Office. “But the current conflict could still escalate and place further strain on energy supplies.”
- “If anything, the data reinforces the risk of a renewed acceleration in demand-driven inflation even if supply-side inflation subsides,” said Vail Hartman at BMO Capital Markets. “As a result, it’s unsurprising to see both October hike odds and terminal policy rate pricing move higher.”
Bonds:
- “This is the market telling us we’ve entered a genuine re-tightening cycle,” said Tony Miano at Wells Fargo Investment Institute. “The entire curve is repricing at once, which means higher discount rates for equities, higher mortgage and corporate borrowing costs, and a higher bar for risk assets.”
- An economy strong enough to survive hikes is different than one that is so strong, it’s adding to price pressures, according to Will Compernolle at FHN Financial. “The former gives the Fed permission to focus on inflation without significant worry of labor-market deterioration,” he said. “The latter necessitates a more aggressive and urgent approach to tightening.”
China:
- “Neither side looks ready to fundamentally reset the trade relationship, with the threats of restricting critical mineral exports countering the US administration’s desire to turn back to tariffs,” wrote Robert Gilhooly, senior emerging markets economist at Aberdeen Investments.
Stock and Sector Breakdown:
Sector breadth weakened to just 1 of 11 sectors higher (from 5 Tuesday, 7 Monday) although the lone sector (Energy) was up over 1%.
Four sectors finished down more than 1% including two of the megacap growth sectors (Communications -1.9% and Consumer Discretionary -1.6%; rate sensitive Utilities and Real Estate were the others). Superheavyweight Tech was -0.7%.
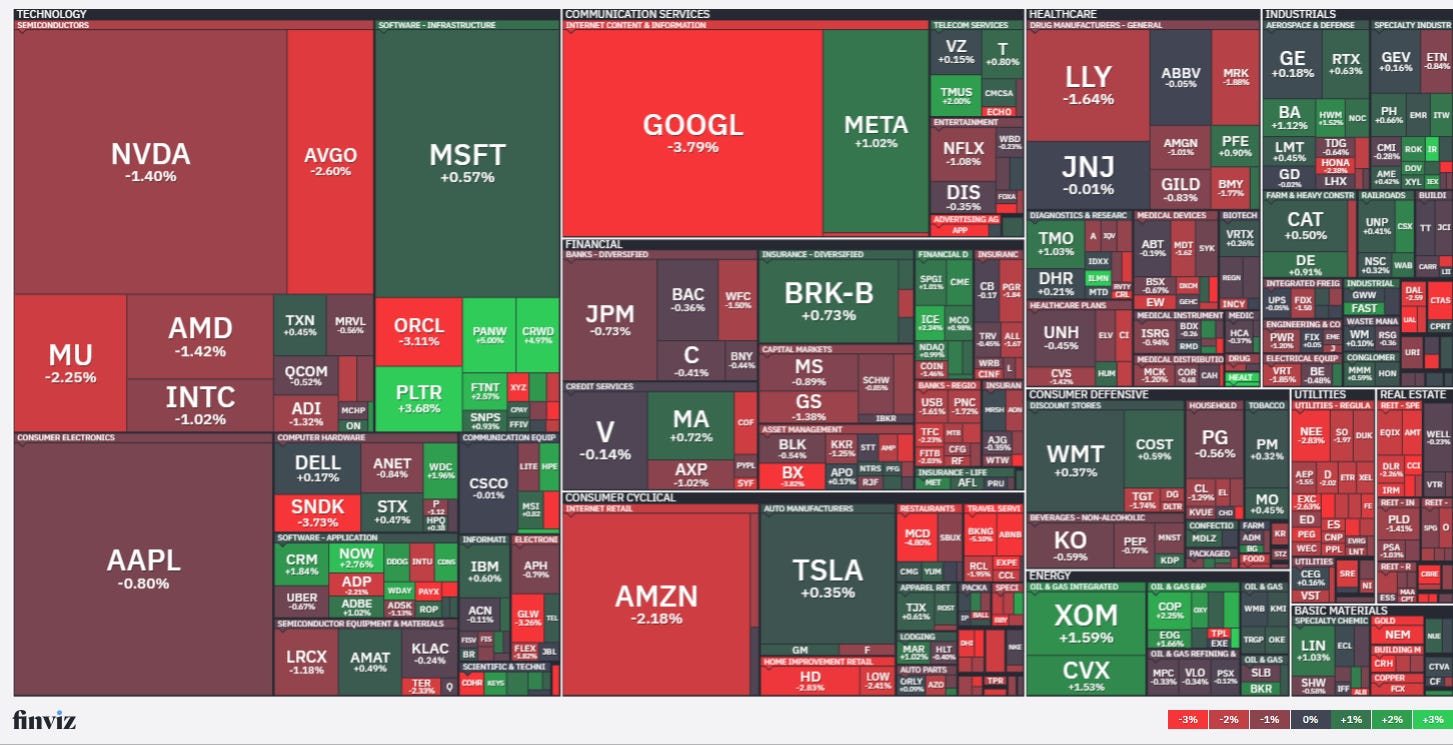
The PHLX Semiconductor Index fell -1.2% following ending its six-day win streak. Mega-cap growth stocks also pulled back, leaving the Vanguard Mega Cap Growth ETF (MGK) down -0.9%. Meta Platforms (META) +1.02% was a notable exception to that weakness, remaining higher amid continued enthusiasm surrounding its Muse AI agent.
If you missed it, see my deep dive on META: After its 35% Run Is Meta Still a Buy? Also James “Rev Shark” DePorre wrote about META as part of a deep dive into the “Super Intelligence” theme. As he writes: “I will be using that term now rather than AI. SI is no longer a new concept or a single monolithic idea. It is changing and evolving, and investment success will depend on identifying the key themes and the stocks that are executing on them best.”
Cybersecurity was another rare bright spot with Palo Alto Networks (PANW) +5.0% and Crowdstrike Holdings (CRWD) +5.0% leading the S&P 500 to the upside. Tuesday Palo Alto announced the launch of an AI-powered, nonstop cybersecurity service for business clients powered by AI models from Anthropic and OpenAI.
On the other side of the tape, after cutting losses Tuesday selling re-emerged in the online travel space with Expedia Group (EXPE) -7.7% and Airbnb (ABNB) -7.7% suffering sizable losses amid worries that META’s Muse AI agent could disrupt established online travel platforms.
McDonald’s (MCD) -4.8% also finished among the day’s weaker names after falling to a new 52-week low following the unveiling of its McDonald’s > NEXT strategy.
Paychex (PAYX) -8.8% was the weakest performer in the S&P despite an earnings beat as the company said revenue for its Management Solutions business was trending toward the low end of guidance.
[Note: chart uses futures prices.]
The number of large SPX winners (up over 3%) dropped to 7 from ~25 Tuesday, ~55 Monday, while the number of large losers (down over 3%) rose to ~25 from 11 Monday. Both of these metrics have remained very subdued the past six weeks rarely getting above 50 and only once above 100.
In other individual stock news,
Shares of IonQ (IONQ) popped more than 4% (although it was up much more during the session) after the company said it successfully tested the first real-time quantum error decoder. See Stephen Guilfoyle’s article on quantum computing stocks: Quantum Computing Leaps Back Into the Scene
Some other stock-specific commentary from TheStreet Pro today:
- Chris Versace – Wall Street Ups Price Targets on 3 Pro Holdings as Microsoft Gets an Upgrade (MSFT, AAPL, AXP)
- Ed Ponsi – Could Viking Therapeutics Disrupt the Weight-Loss Space? (VKTX)
- Bob Lang – Chart of the Day: Boeing Needs to Prove It’s Worthy (BA)
A Look At The Charts
Note on all charts the colored lines are moving averages (the average price over the lookback period — days on the daily charts, weeks on the weekly charts):
20 = green
50 = purple
100 = blue
200 = brownException is monthly charts where blue is 10-month moving average and brown is 20-month moving average.
MACD = Moving average convergence/divergence line, a measure of momentum that compares longer term and shorter term momentum to gauge if a move is strengthening or weakening. This is probably my favorite individual indicator.
RSI = Relative Strength Index (basically what it sounds like) = measures the strength of the move comparing gains to losses over the given lookback window (I use the standard 14 periods).
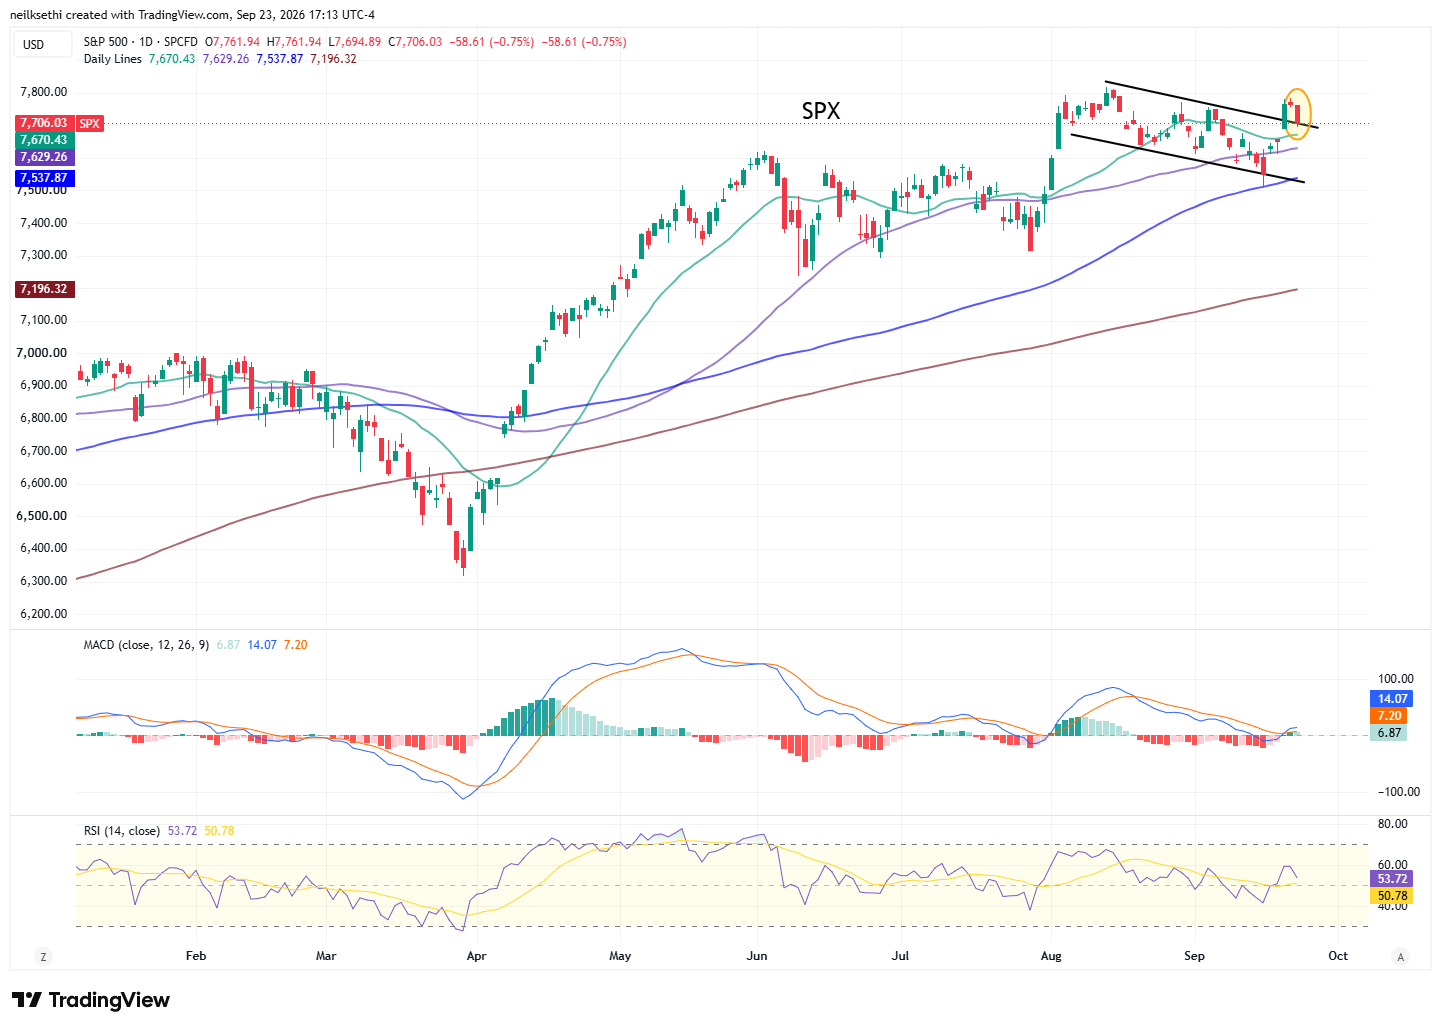
SPX fell back but remains up for the week. The daily MACD remains in a “go long” positioning, and the RSI over 50.
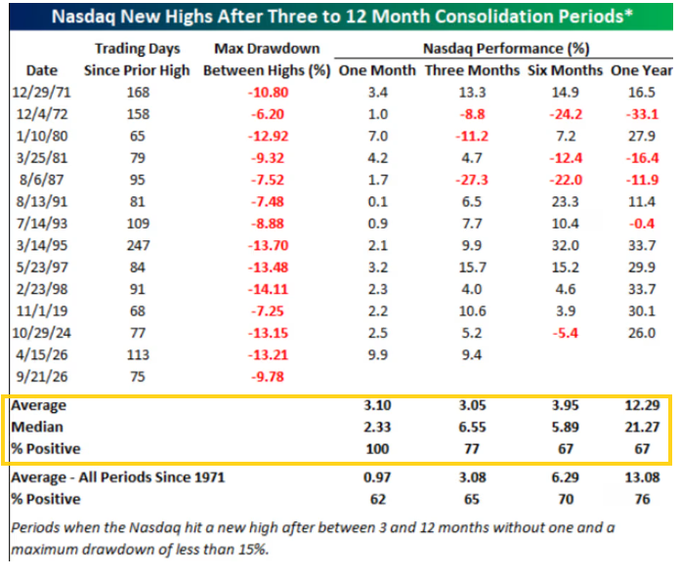
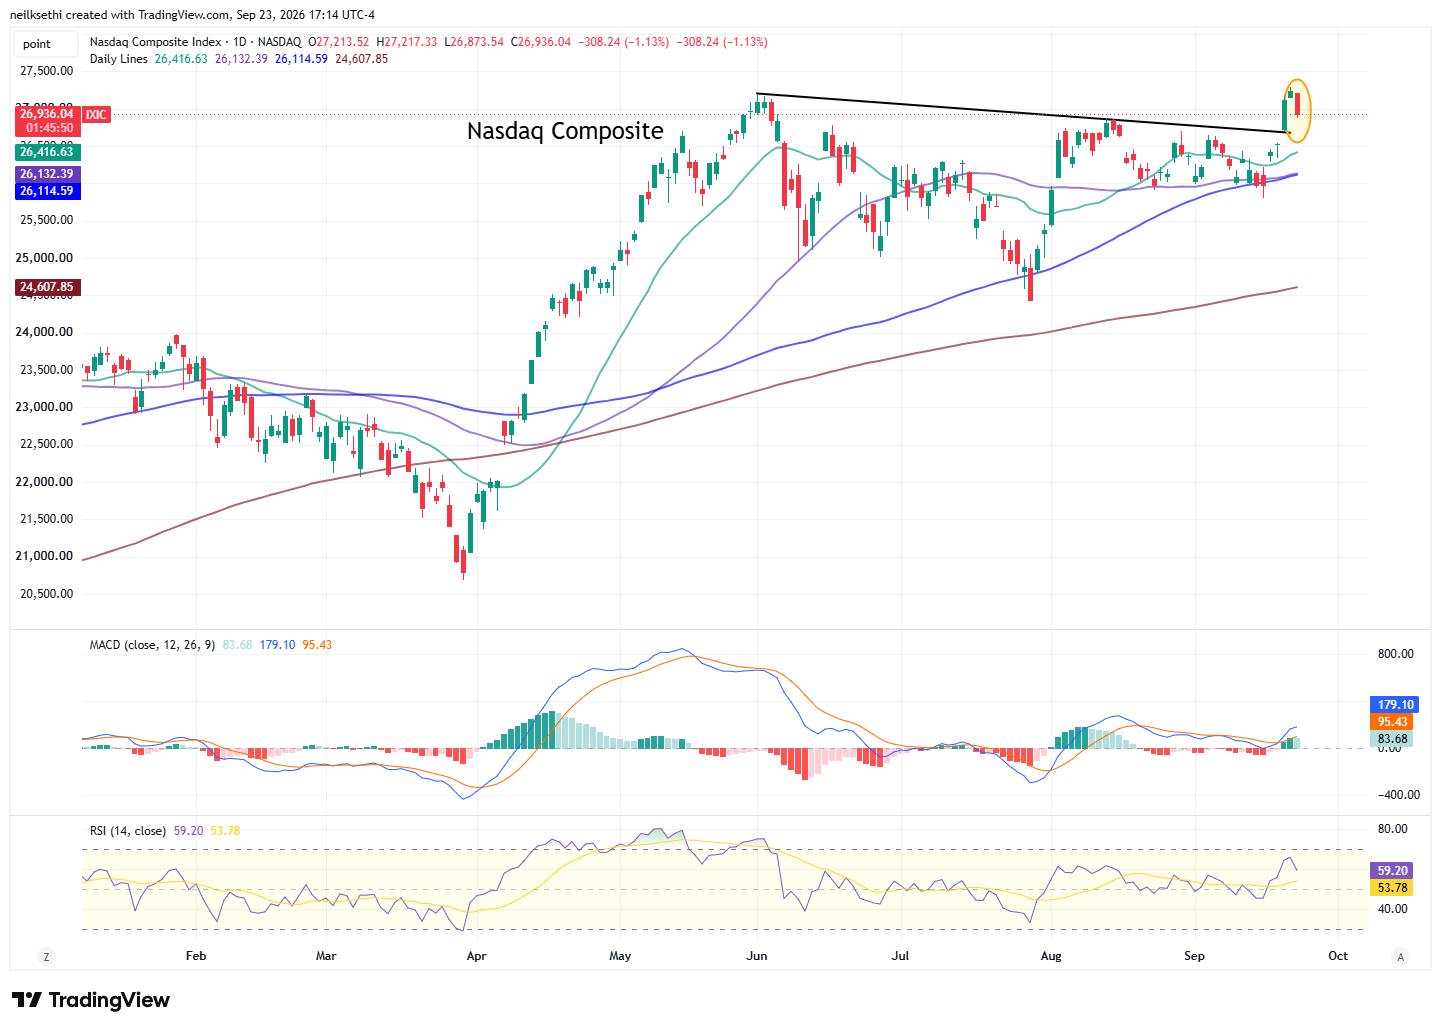
Nasdaq Composite a similar story with a slightly stronger chart.
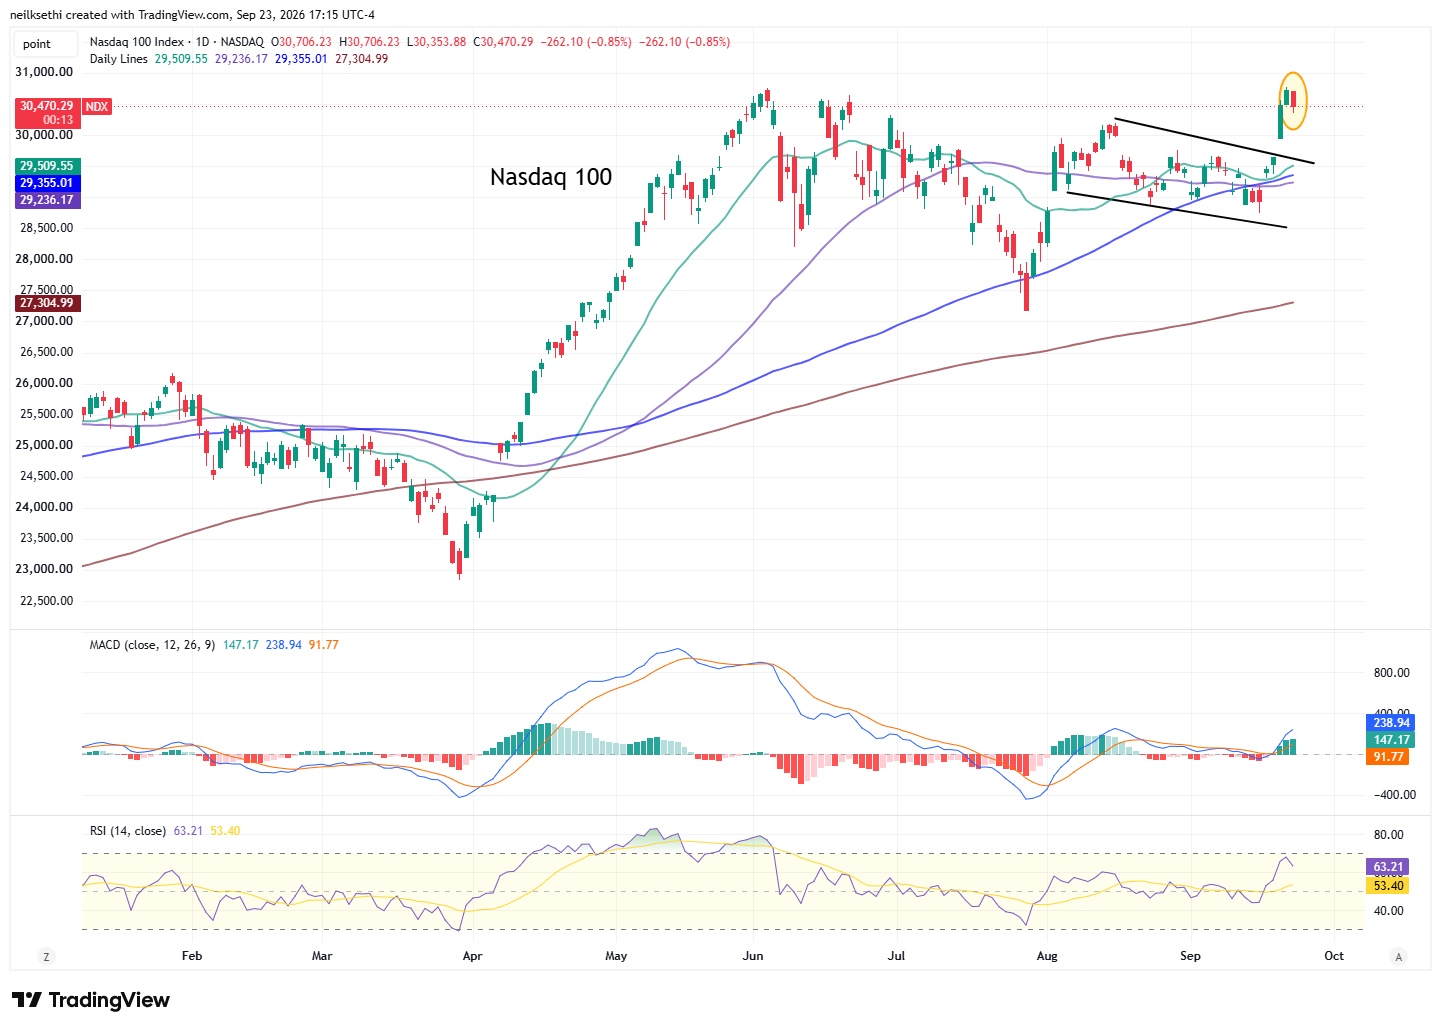
The Nasdaq-100 (QQQ) saw even less relatively damage. Daily MACD and RSI also positive here.
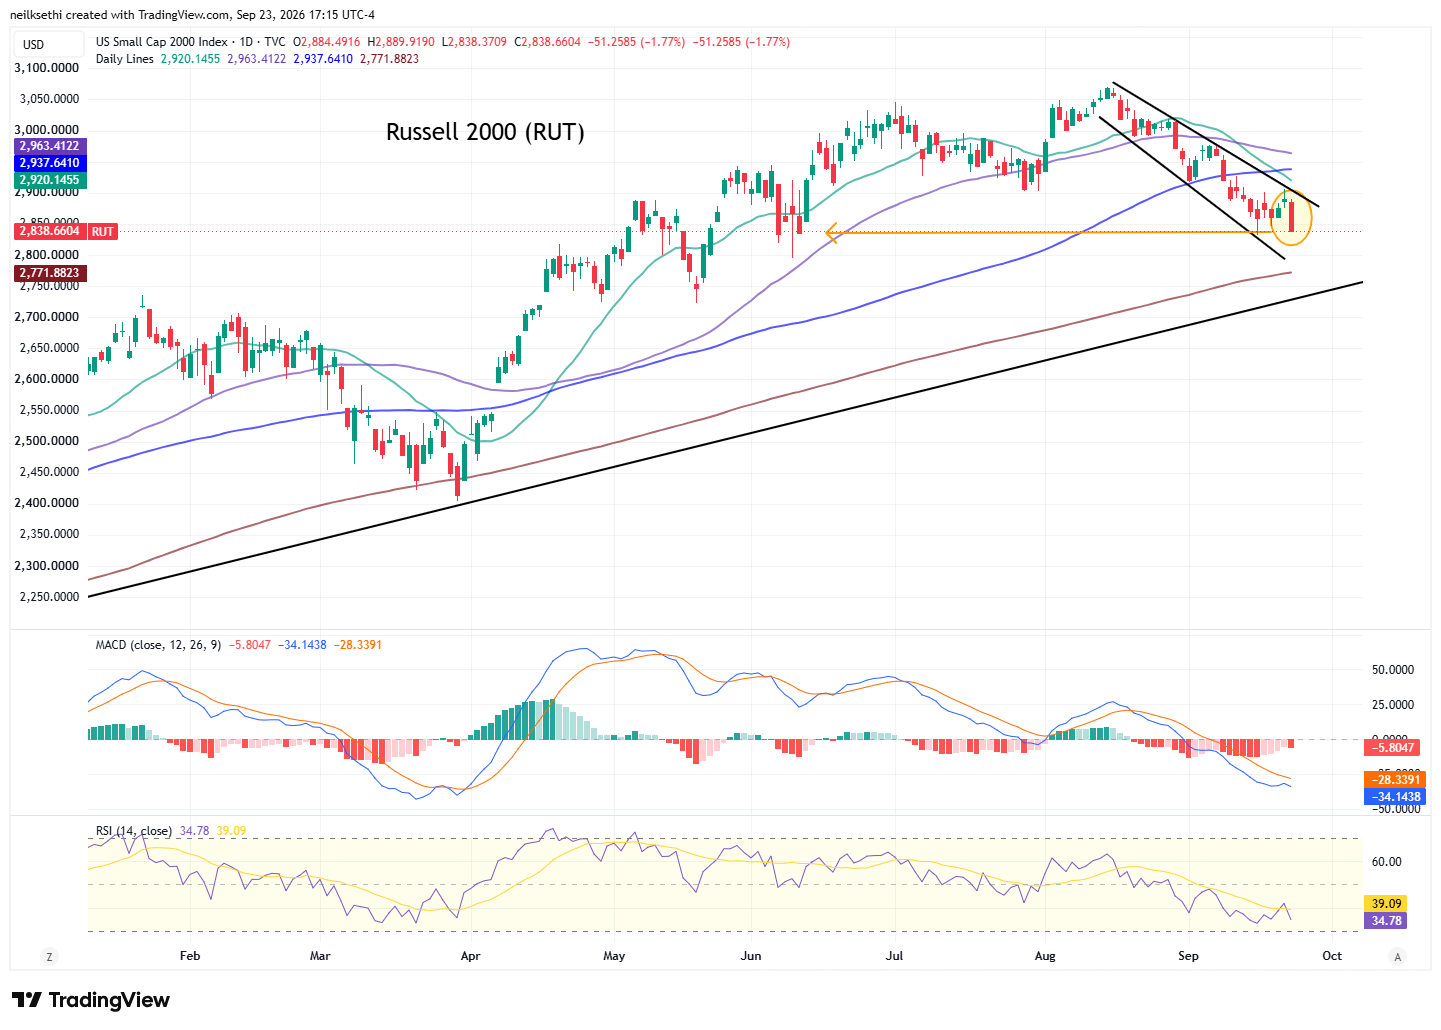
The Russell 2000 (RUT) I said two weeks ago was “much more problematic,” and that remains the case as it fell to the lowest close since June 10th (although I guess positively didn’t break last Wednesday’s intraday low). Its daily MACD remains in “go short” positioning, and the RSI back under 40.
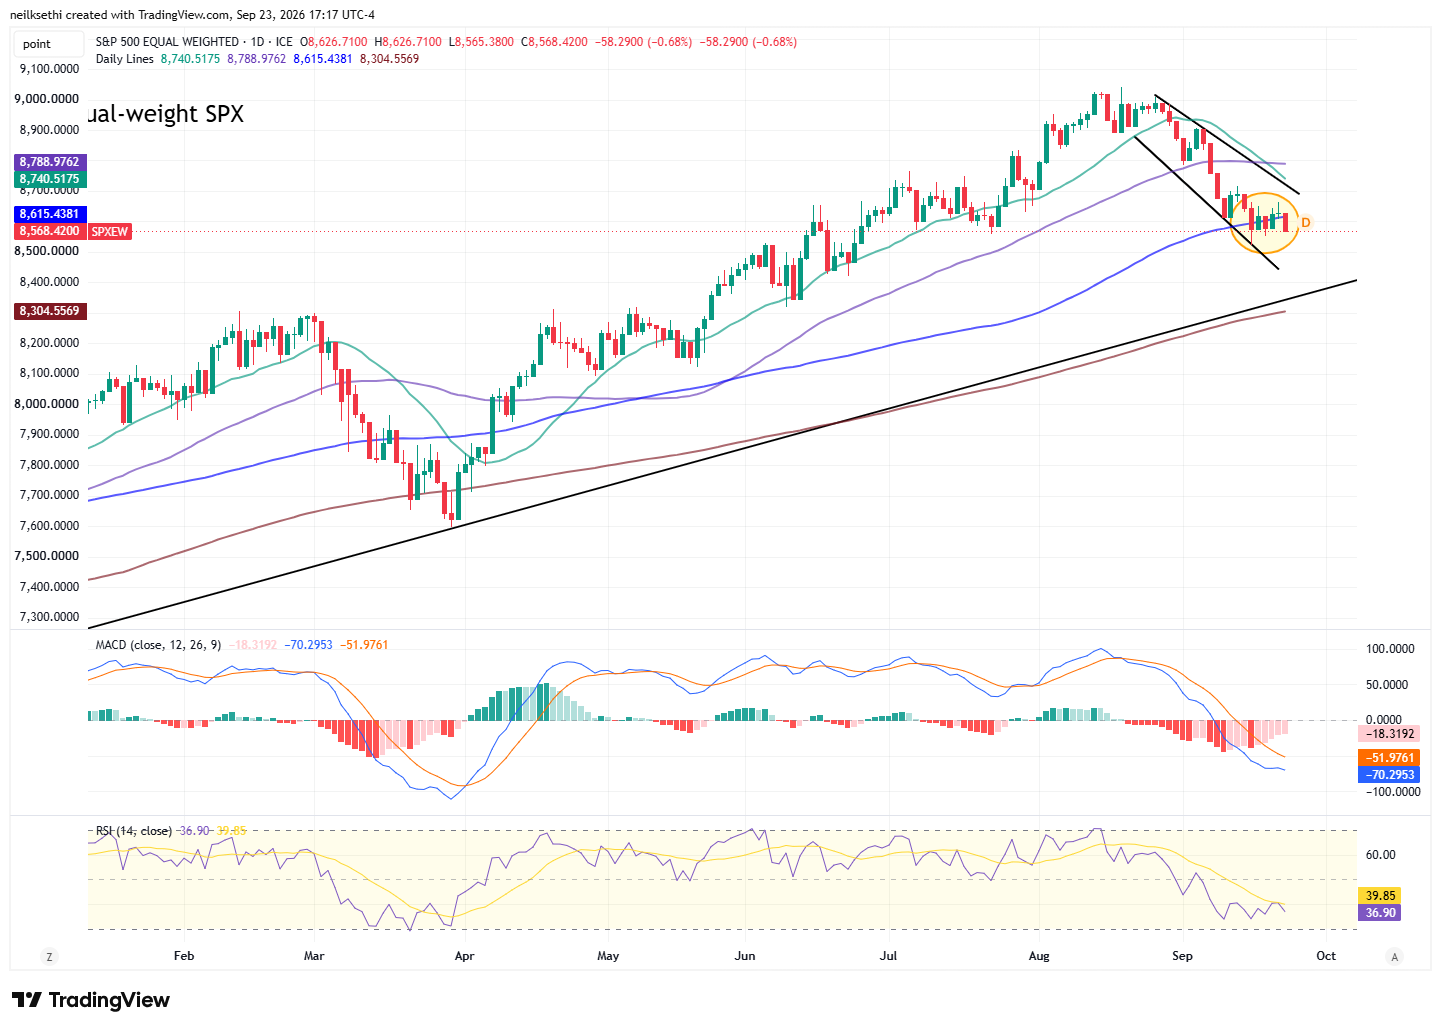
The equal-weighted SPX I said last Wednesday is “back to concerning.” I mentioned early last week “I did take off most of my holdings in (RSP) for now. I’ll be looking for a tradeable bottom to form.” Like the RUT it broke to a new closing low but did not break last Wednesday’s intraday low. Daily MACD and RSI are still weak.
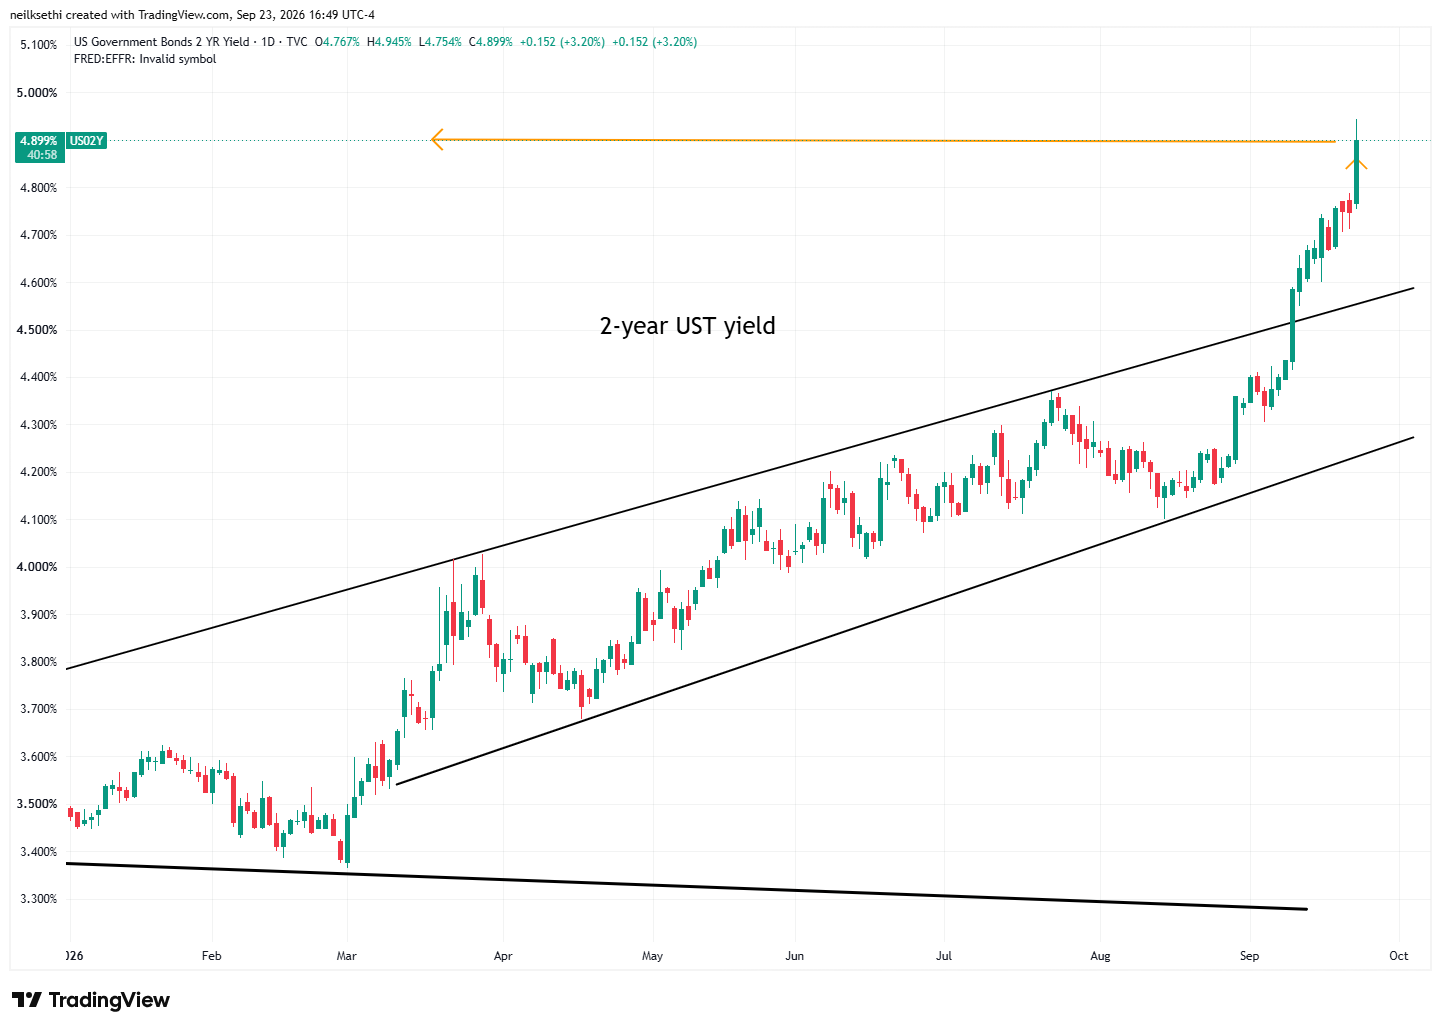
Treasury yields rose sharply across the curve:
The 2-year Treasury rose 15 basis points to the highest since May 2024 (including after-hours). In terms of basis points (not percentages as the chart uses) it was the largest increase since April 9th 2025 (just after liberation day).
It is now ~111 basis points above the Effective Fed Funds rate, so still screaming for (a few) more rate hikes.
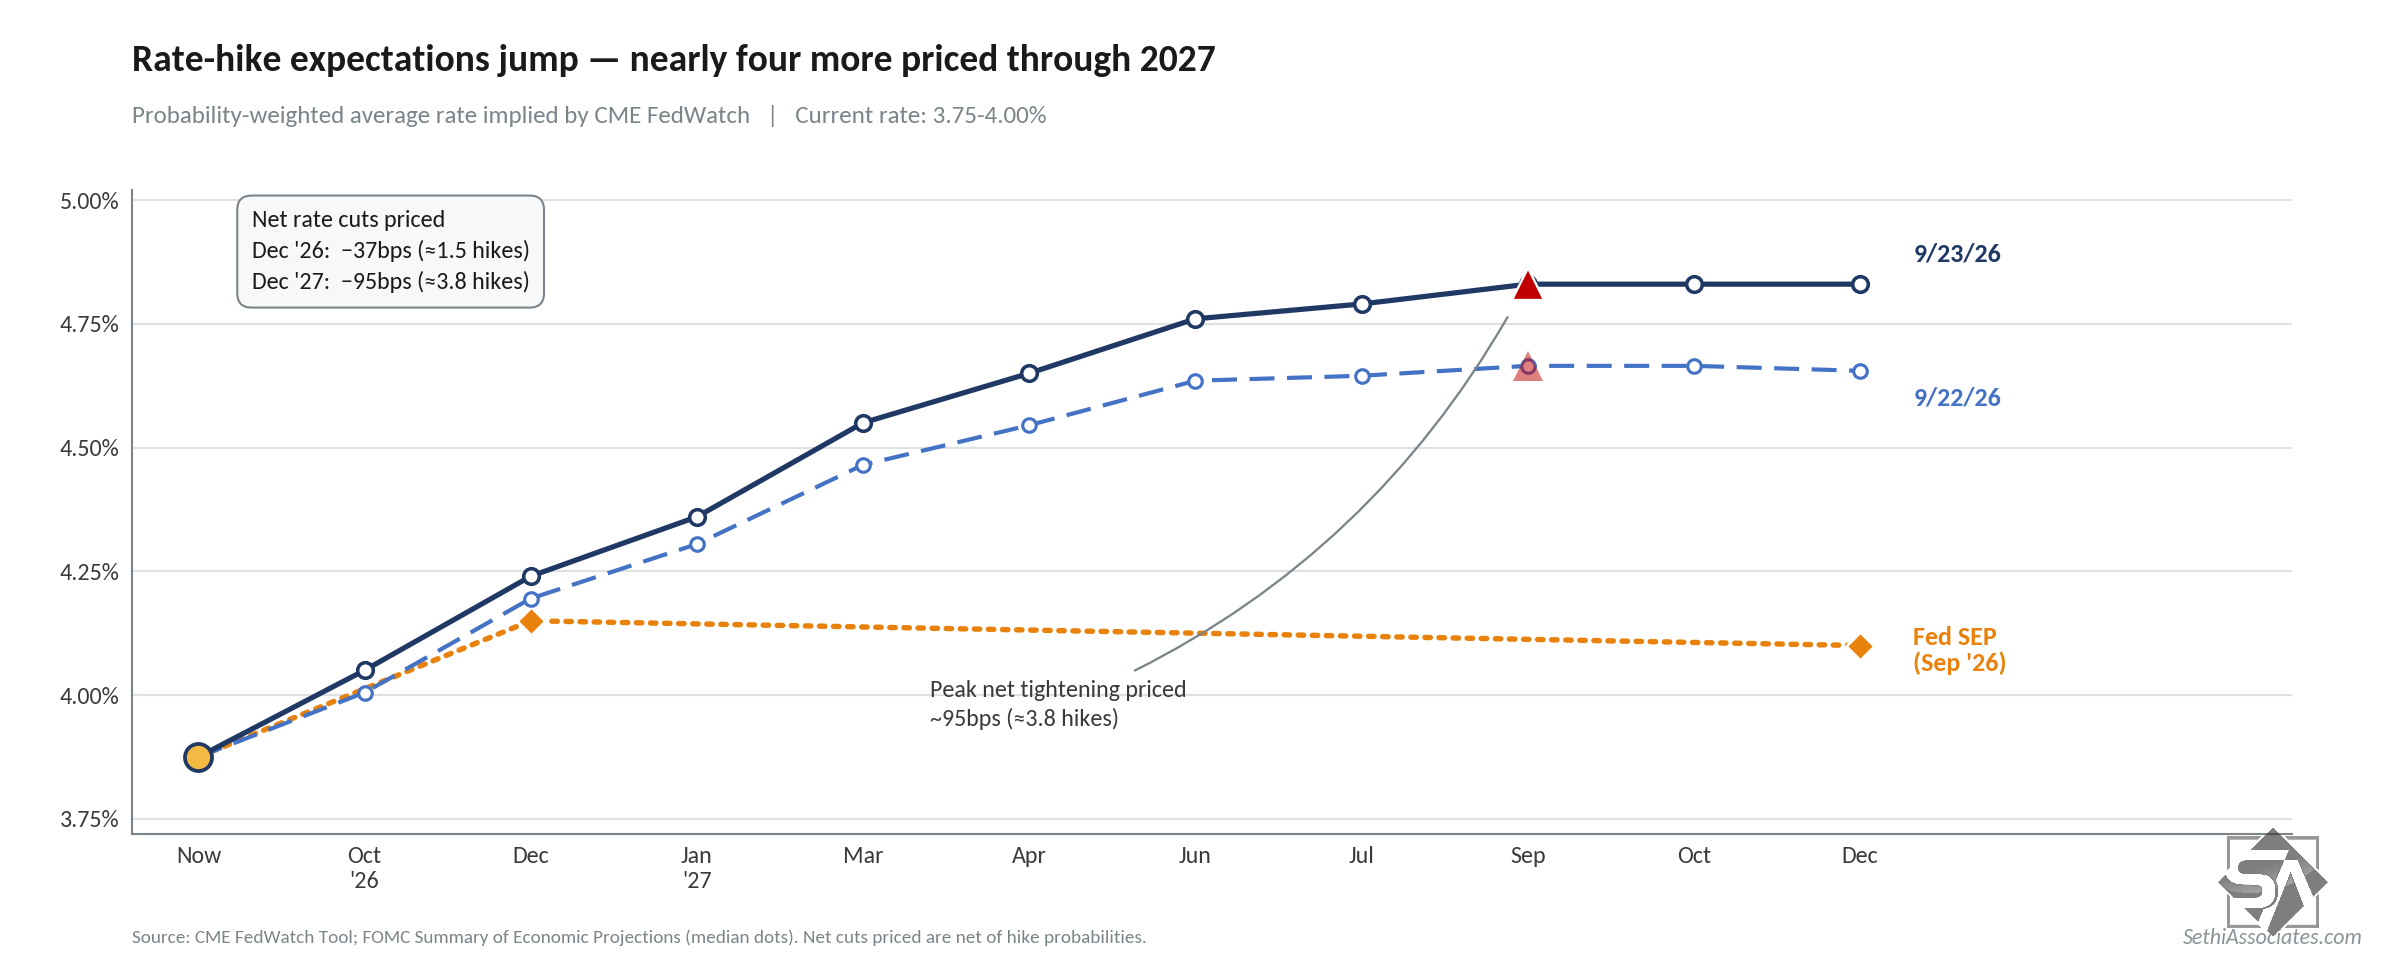
In that regard, Fed fund futures from CME’s Fedwatch tool shot higher as well with the chances for an October hike now 69% and two hikes this year at 53%. Two additional hikes are almost fully priced for 2027 (95 total basis points priced through YE 2027 up from 78 Tuesday).
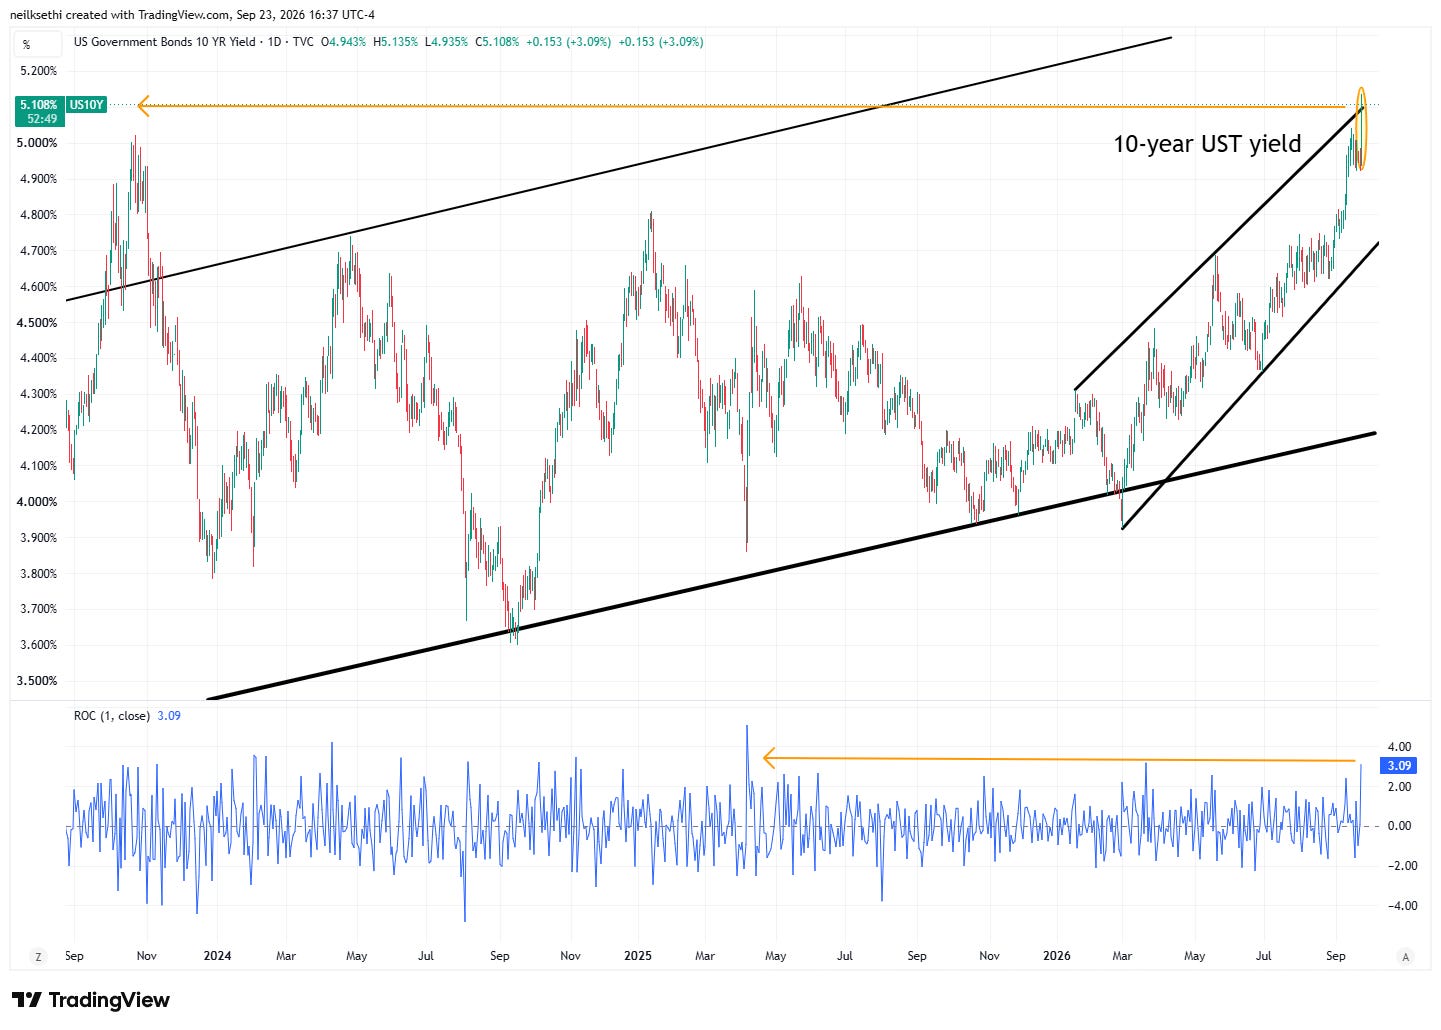
10-year yields shot up 15 basis points to 5.11% including the after-hours session, the highest close since July 2007d. In terms of basis points (not percentages as the chart uses) it was the largest increase since April 7th 2025 (post-liberation day). It’s now starting to push above its channel getting fairly extended.
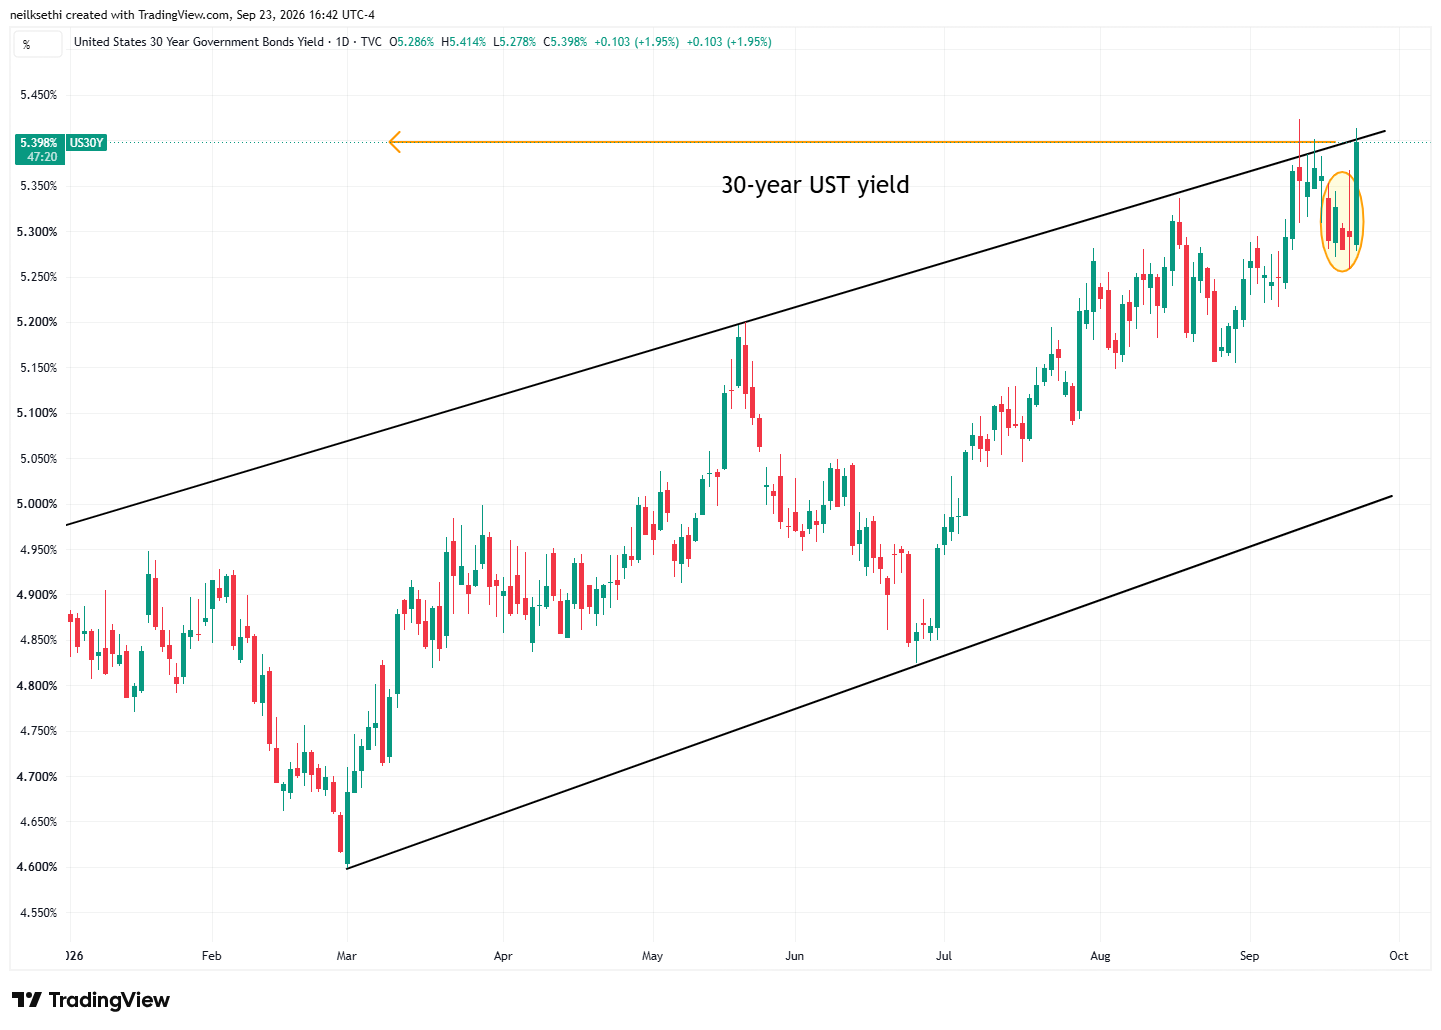
30-year yields up ten basis points ending after hours at 5.40%, also the highest close since 2007 and back at the top if its channel.
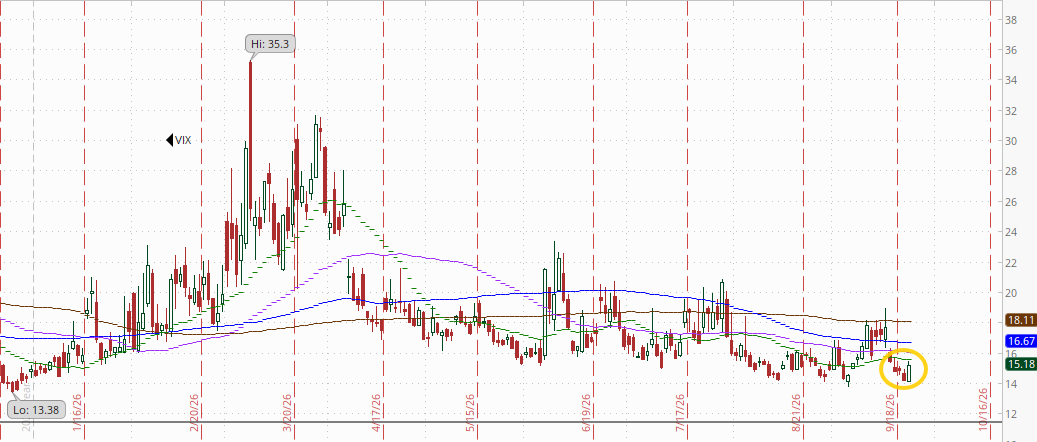
VIX up from the low of the year to 15.2, still fairly tame. That’s consistent with ~0.95% average daily moves in the SPX over the next 30 days.
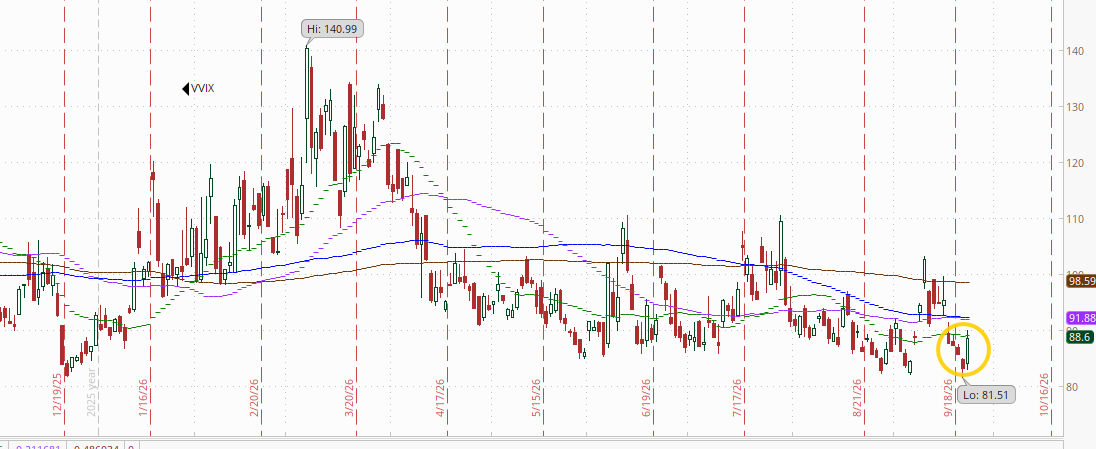
The VVIX (VIX of the VIX) also up to 88.6.
The current level is consistent with “moderate” daily moves in the VIX over the next 30 days (historically, normal is 80-100). Above 100 is the level flagged by Charlie McElligott as indicating higher stress.
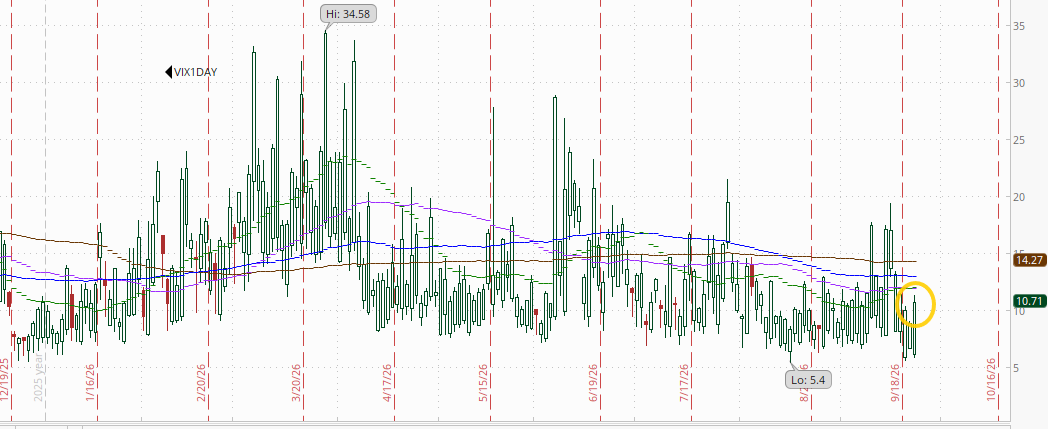
The 1-day VIX also up to 10.7. The current reading isstill just consistent with a move of 0.68% in the SPX next session.
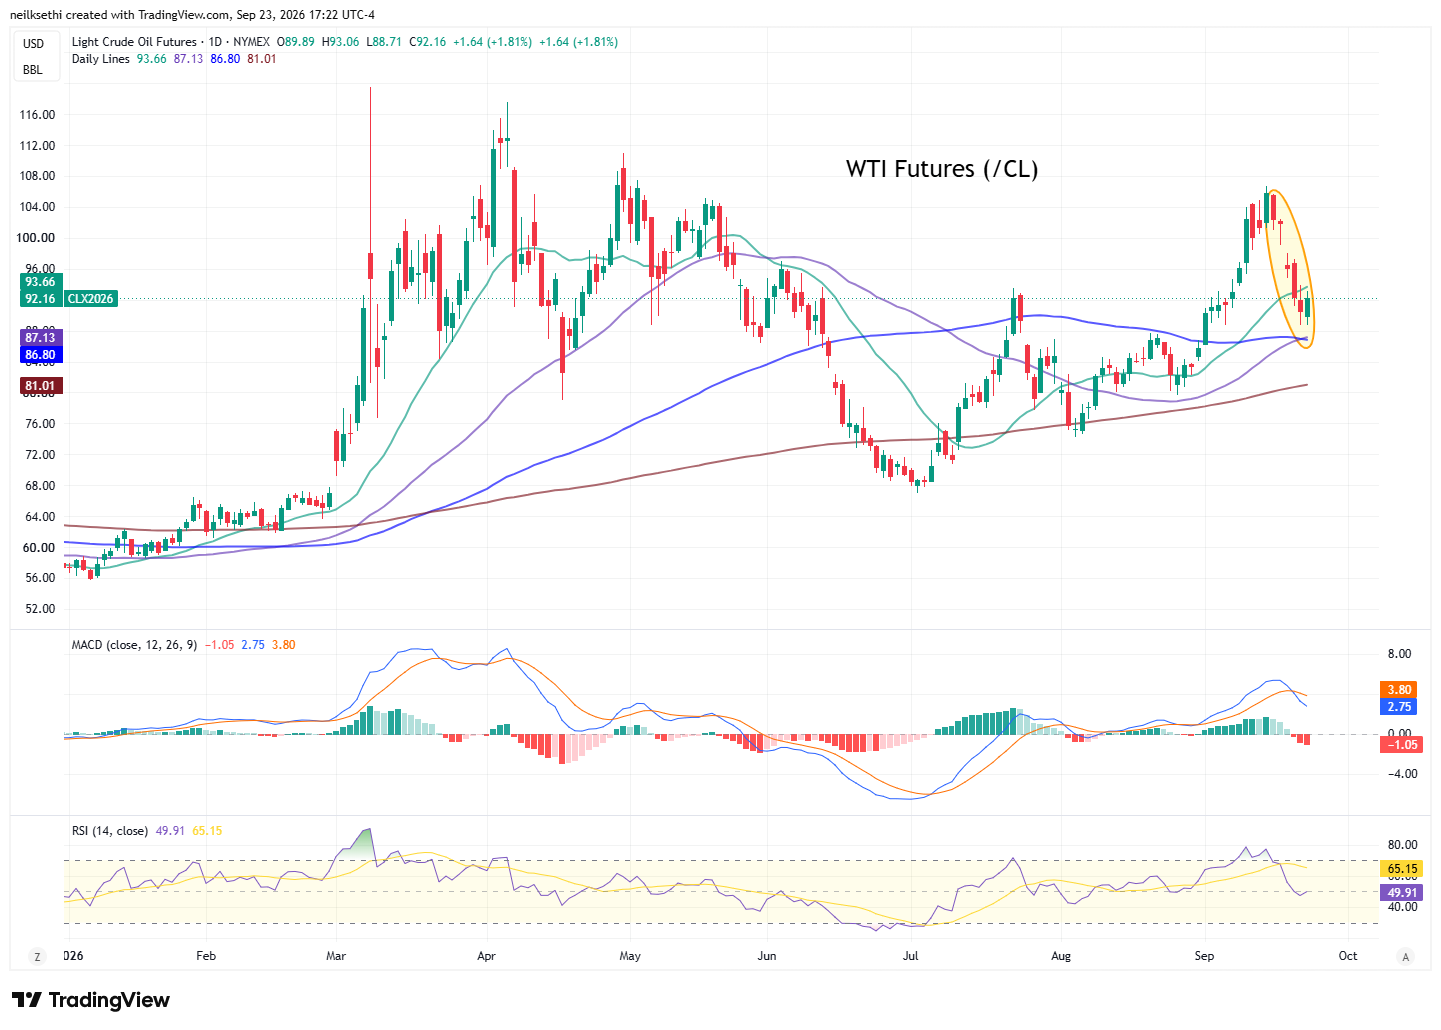
WTI futures (/CL) broke their five-session losing streak although not a huge gain at under 2.0%.
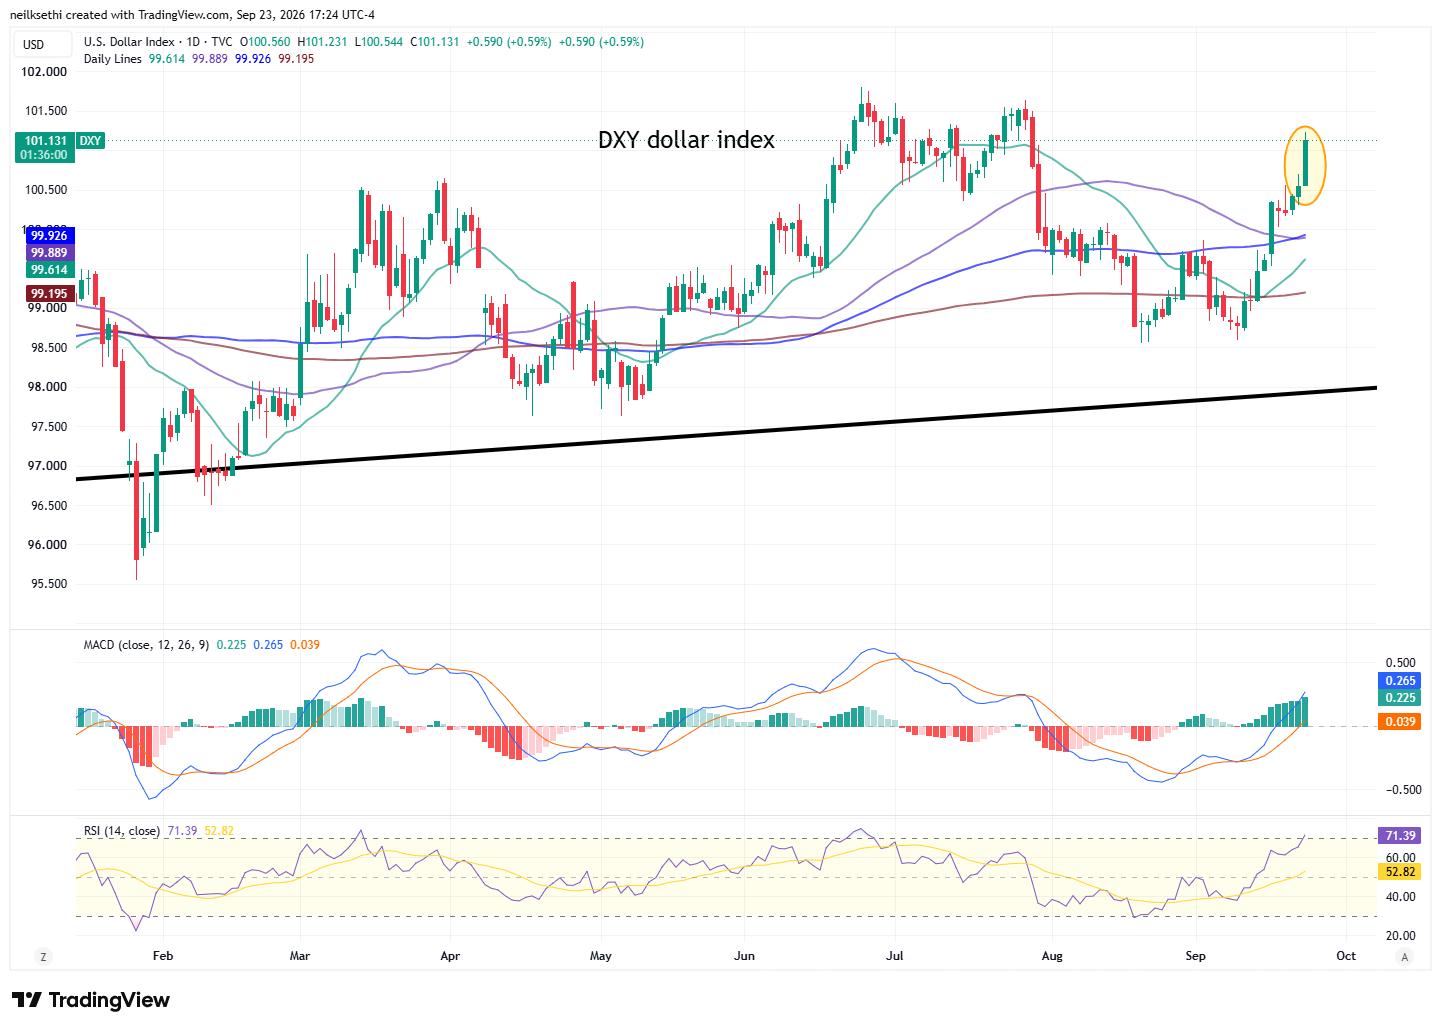
The DXY dollar index (which is fixed weighted with a heavy (57%) weighting vs the euro), jumped another +0.6% now not far from the highs of the year.
As I mentioned last week “The daily MACD remains positive and the RSI is above 60 so it continues to have strong technical support.”
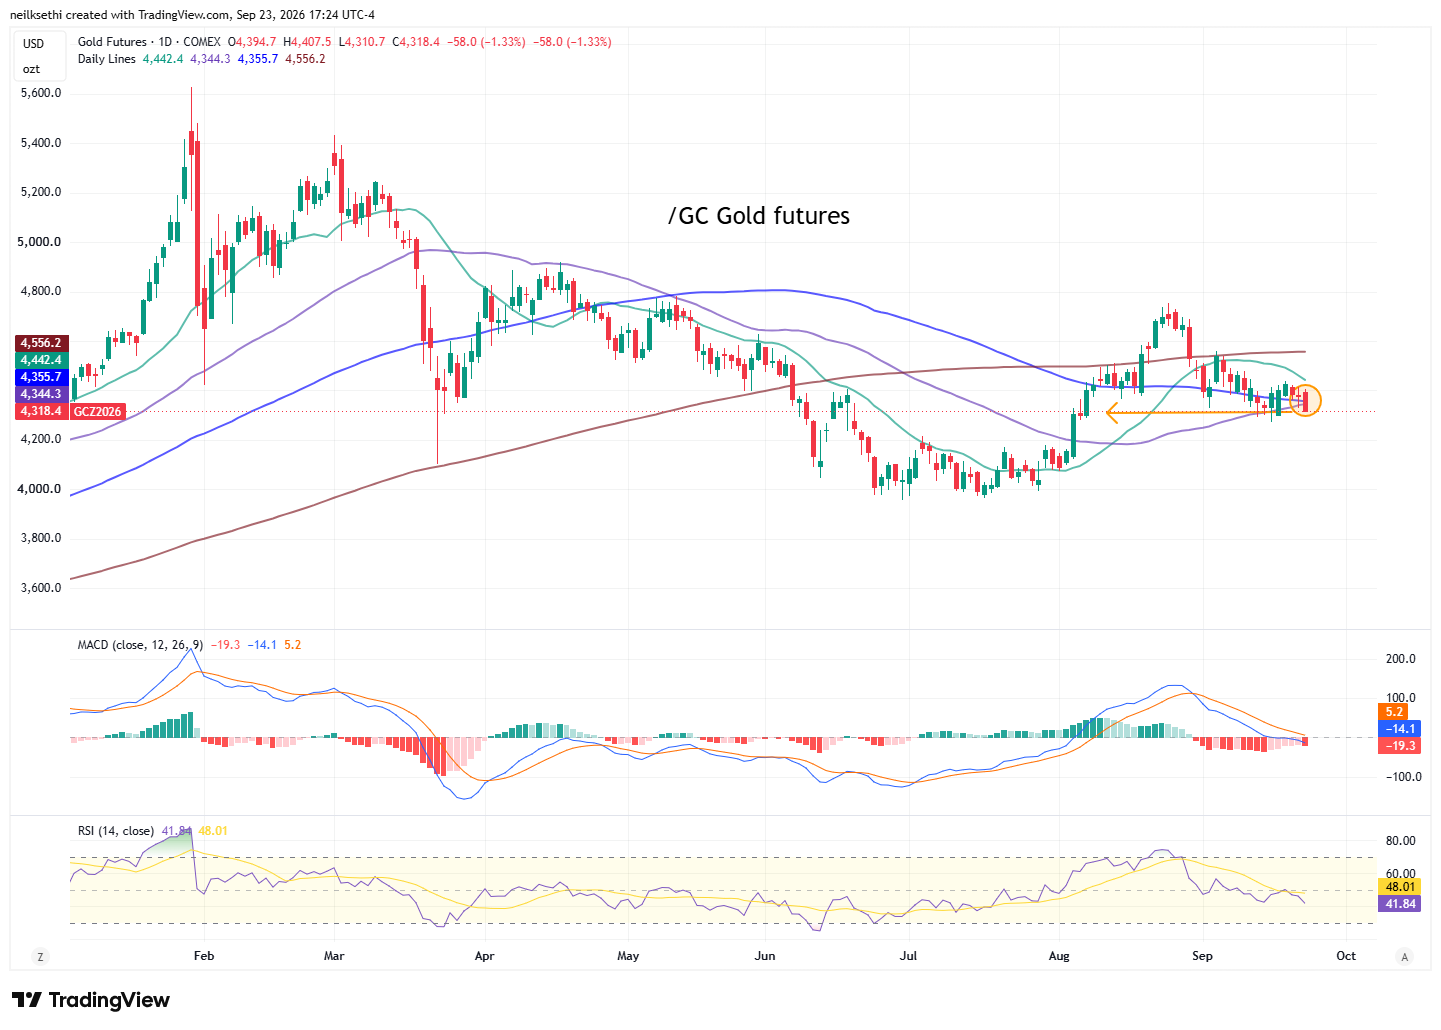
Gold futures (/GC) fell to a 6-week closing low. The daily MACD remains negative and the RSI is under 50, so I’m glad I continued to hold off. Needs to hold last week’s intraday lows.
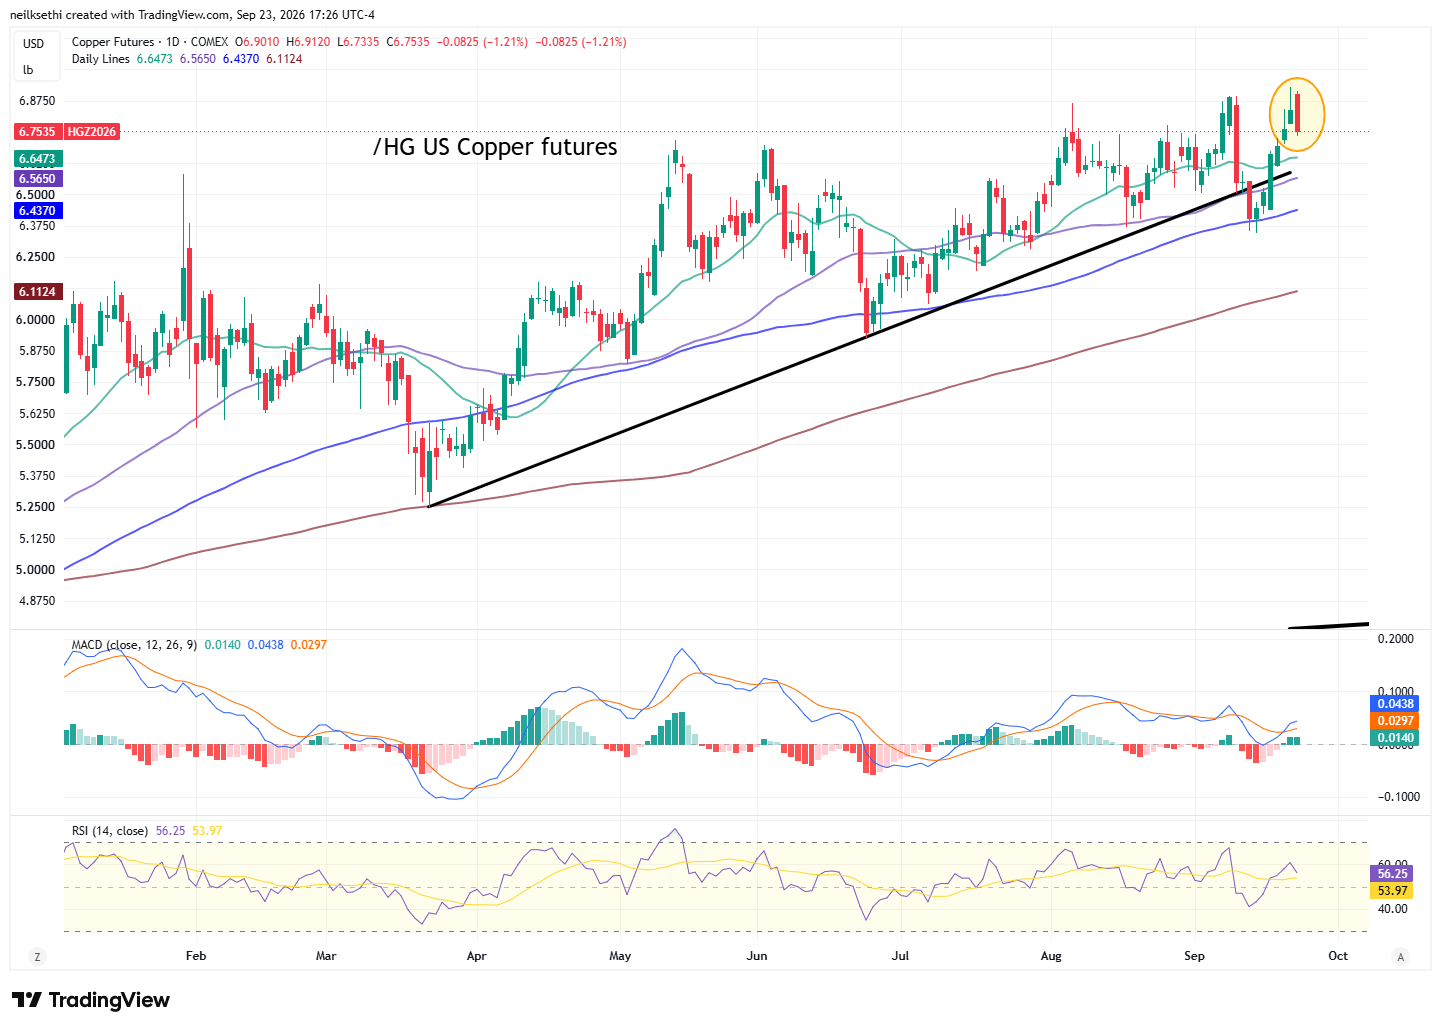
US copper futures (/HG) fell for the first time in seven sessions as they continue to trade with semiconductors. Daily technicals overall remain positive for now.
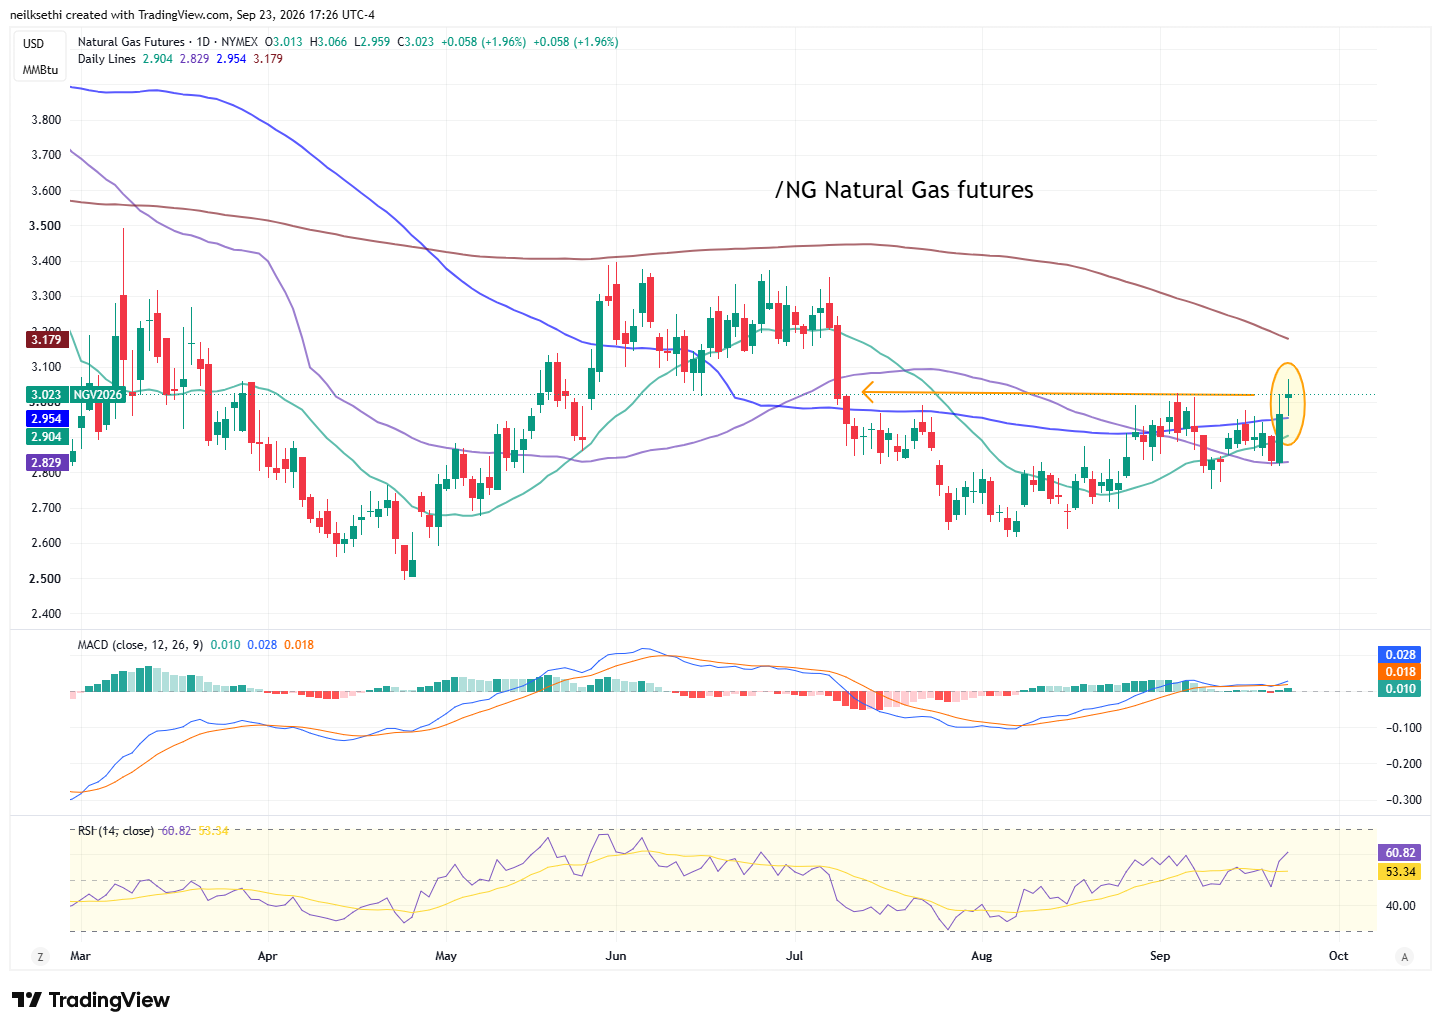
With a nip in the air (at least in Ohio) US natural gas futures (/NG) continued their run adding another 2% to Tuesday’s 4.5% gain and taking them out of their trading range since the start of July and through the $3.03 level. As I said Tuesday “a break over that, though, and this could run,” and I’ll look to get some exposure tomorrow if we don’t see it reverse lower (with the caveat that I have huge positions in several MLP’s that have large natural gas exposure already).
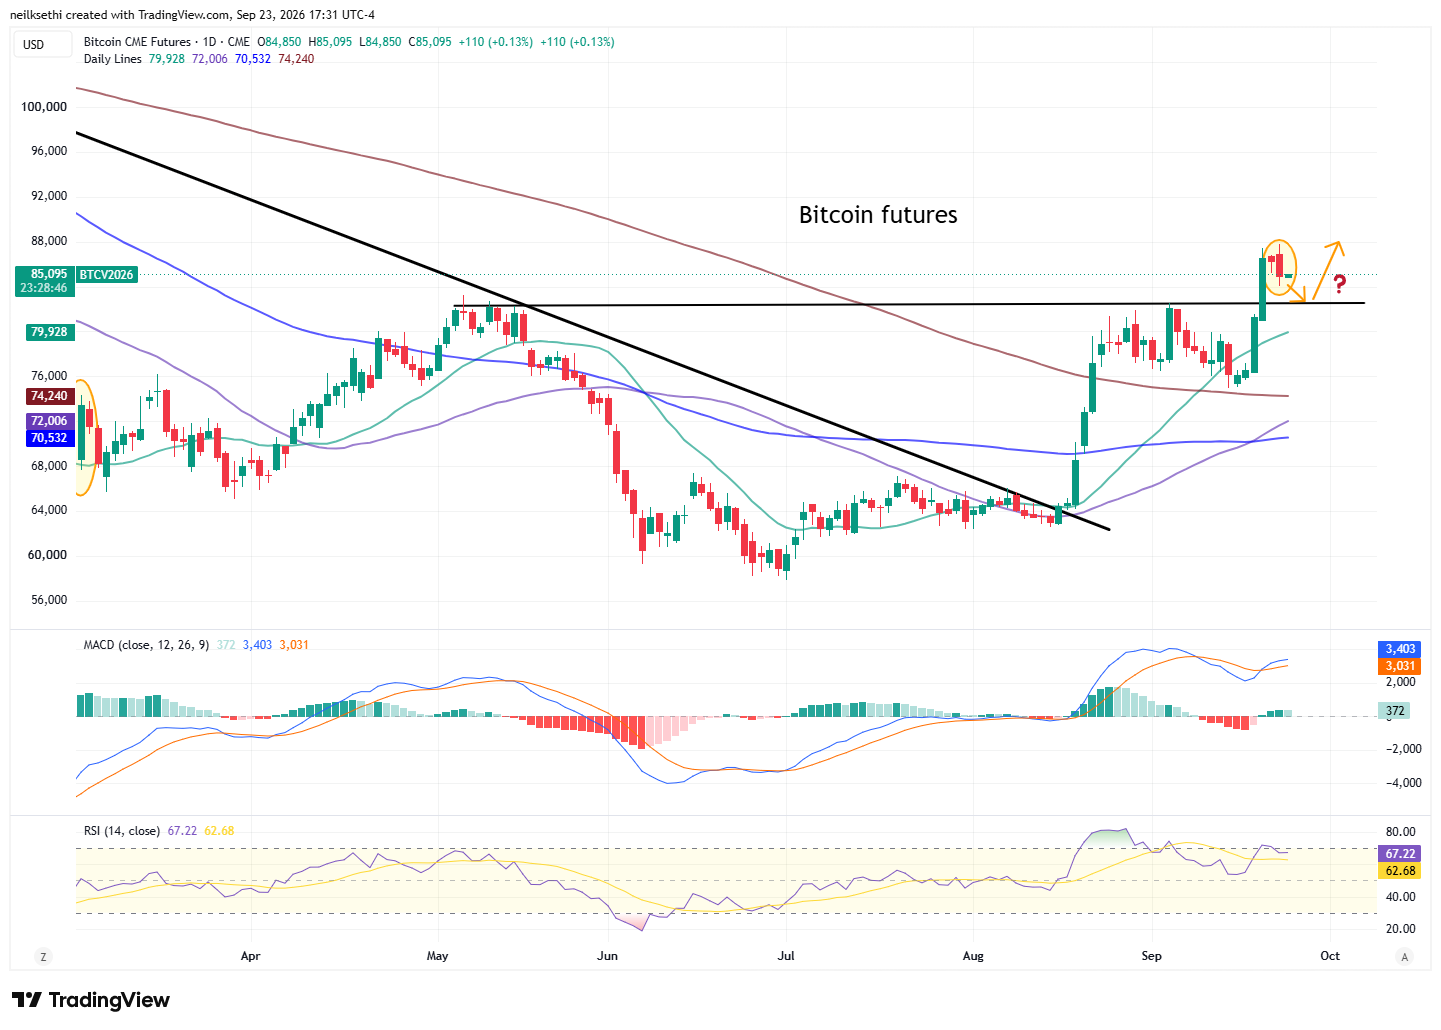
Bitcoin futures fell back so I trimmed a little. Some giveback would be normal after their 13% two-day move, and a natural path might be a retest of the breakout. They also might carve out a bull flag as they have a tendency to do. Daily MACD is positive while the RSI is near 70.
More From TheStreet Pro:
- James “Rev Shark” DePorre – Breakout Buyers Caught in Classic Bull Trap
- Ed Ponsi – Surprise Greenland Deal Has Investors Looking in the Wrong Place
- Chris Versace –
- Stephen Guilfoyle – Financials Flounder
- Bret Jensen – What If OpenAI Fails In 2027?
And From Me If You Missed It:
Miscellaneous:
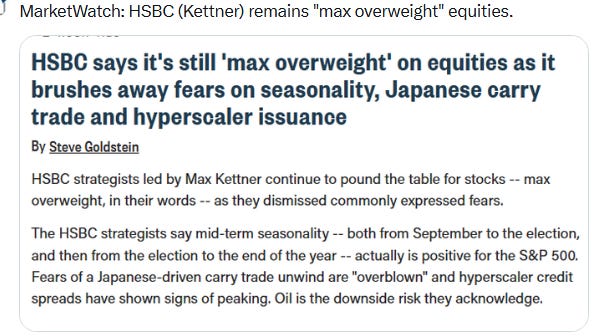
Wrap-Up – The Market Again Bends but Doesn’t Break
The gravitational pull of surging interest rates was too powerful for even the renewed Tech trade to escape Wednesday. I had mentioned in prior weeks that it would be difficult for stocks to succeed if rates were going to continue ratcheting higher, let alone a jump like we saw today.
I had hoped that we had seen the highs, at least in the short term, but clearly not. We are unfortunately now apparently in a “good news is bad news” (and vice versa) cycle, and given my positive outlook on the economy, I’m not sure how much bad news we’re going to get (although we do get new home sales tomorrow which it seems hard to believe will be anything but weak). So it seems we’ll just have to wait for this most recent leg in yields to run its course. We’re already above levels that I thought would cap things so I’m taking the other side of this trade, but it could be some time before that pays off the way things are going.
This hasn’t dented my longer-term optimism though, and the pullback is creating what will prove to be bargains in many stocks. I’ll try to write about some of those later this week or next (Nvidia is up next per reader requests – remember just email me at [email protected] if you want a stock run through the META process).
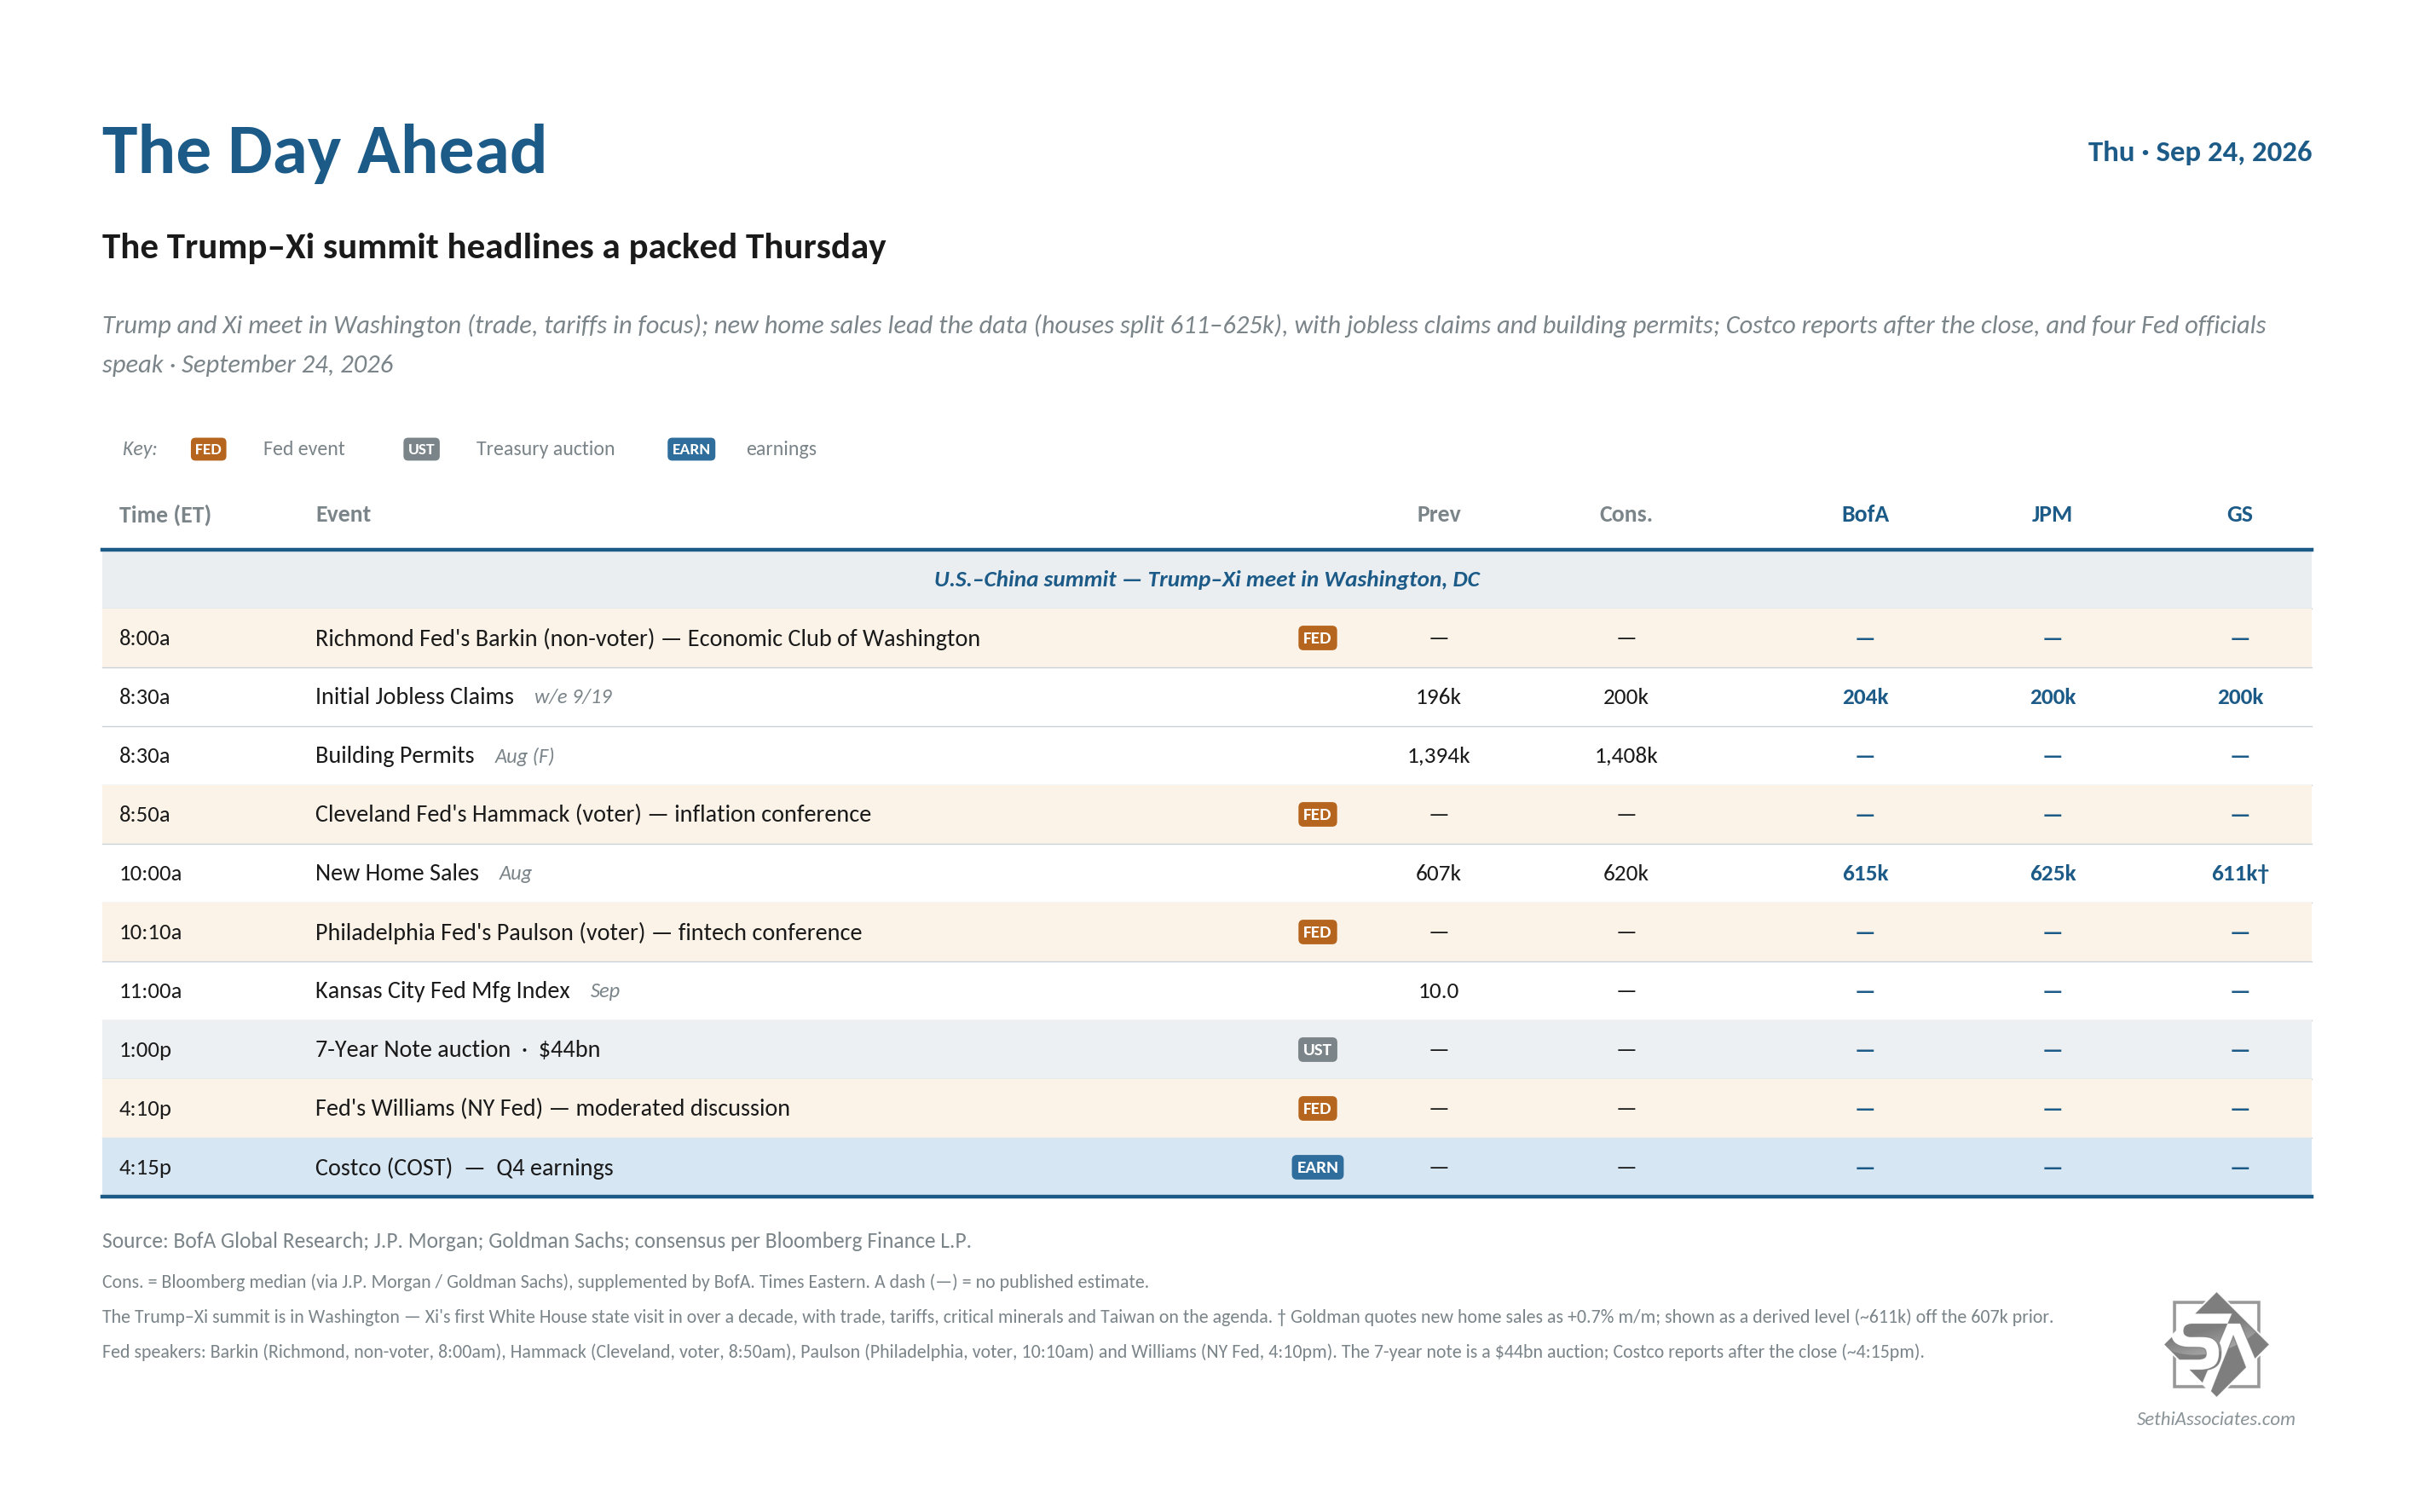
The Day Ahead – Trump Meets Xi
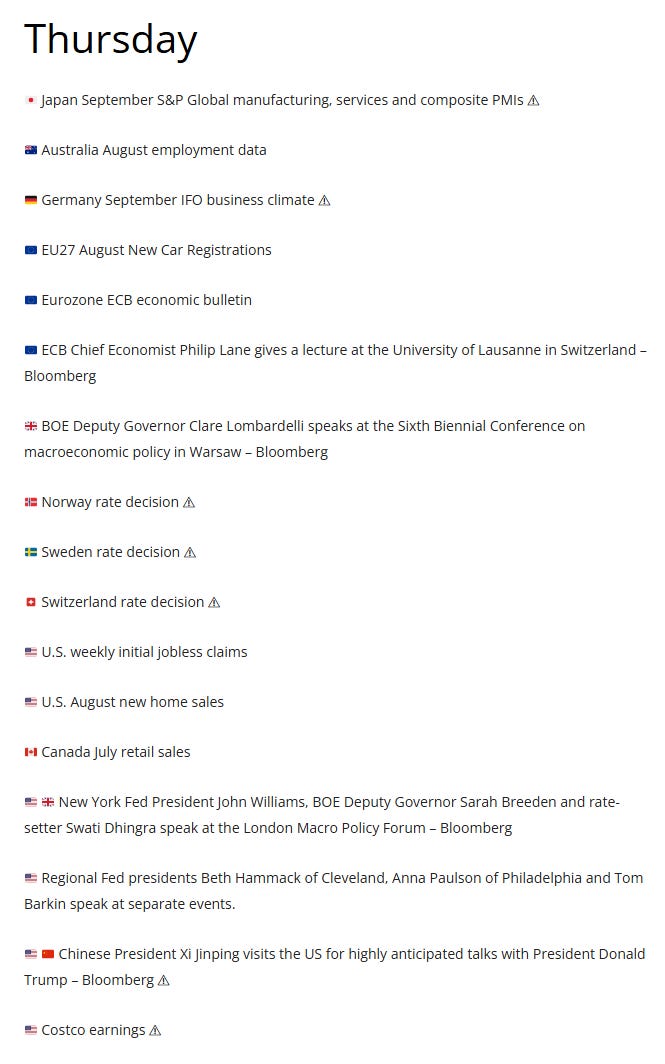
US economic data remains on the lighter side Thursday with August new home sales along with weekly jobless claims.
Fed speakers though out in force headlined by NY Fed President Williams. He stuck to the Treasury market in last appearance (it was at the Treasury market forum after all) but tomorrow he’ll be speaking on a panel at the London Macro Policy forum so maybe we’ll get more thoughts on monetary policy from this important centrist voice. We’ll also get regional Fed presidents Beth Hammack of Cleveland, Anna Paulson of Philadelphia and Tom Barkin
Non-Bill (>1yr in maturity) US Treasury auctions wrap up with 7-year notes. Can’t get much worse than today’s 5-year auction I guess.
As noted in the Week Ahead we are now in the weird middle ground between Q2 and Q3 earnings. Thursday we’ll get two SPX components reporting headlined by Costco (COST) along with Darden Restaurants (DRI).
Ex-US highlights are policy decisions from Norway, Sweden and Switzerland, Japan September flash PMIs, Germany September Ifo survey, the ECB economic bulletin, France September consumer confidence and business confidence, EU27 August new car registrations, Canada July retail sales, Australia labor force survey
Perhaps most importantly, President Trump is due to host Chinese President Xi Jinping in Washington, D.C. with the four T’s (Tariffs, Technology, Taiwan, and Tehran) all on the agenda. Thursday night will be a dinner that will bring together a robust gathering of US corporate leaders including CEOs from Microsoft, Nvidia, Apple, Meta, Amazon, Tesla, OpenAI, and AMD among others. Trump told reporters last week that he expected to notch “a lot of different deals” during the event.
From Christophe Barraud’s international Week Ahead rundown:
As a reminder, if you do put a comment in for me on a post please be sure to put @NSethi9999 in front. Comments are encouraged!