Sell Rosh, Buy Yom in 2026?
There’s an old adage about selling stocks before Rosh Hashanah and buying them back on Yom Kippur. Is there a chance that this strategy works in 2026?
You've reached your free article limit
You've read 0 of 1 free Pro articles.

It seems like Labor Day should be here already, doesn’t it? Yet we still have another week to go. And then, right after that comes Rosh Hashanah, the Jewish New Year.
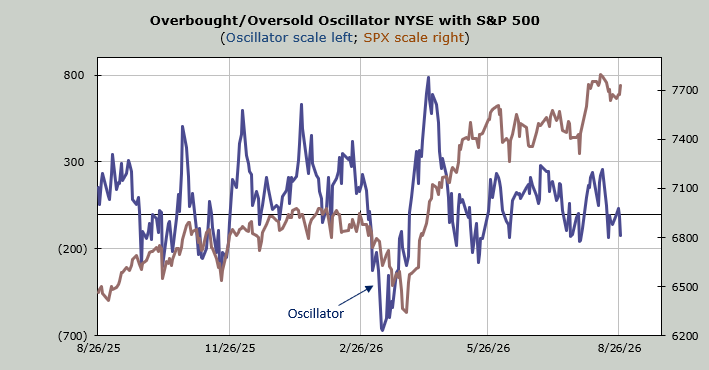
Why do I bring this up? Because of that old Wall Street adage that I have not heard yet this year: Sell before Rosh Hashanah, Buy before Yom Kippur. If that adage is to come to pass, it means we should start to see some weakness in the market in the next week or so.
I thought of that on Thursday as the Daily Sentiment Indicator (DSI) for the VIX finally broke under 15 and moved to 13. A flashing red light would be a single-digit reading, but I consider a sub-15 reading a flashing yellow light. Anyone who has raised children knows those ‘tween years’ are difficult!
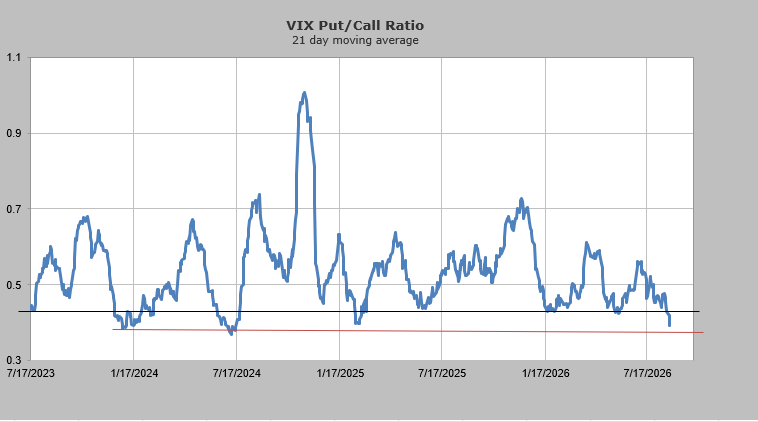
To go along with that, let’s revisit the chart we looked at the other day for the 21-day moving average of the VIX put/call ratio. Two days ago, it was still at .41. Today, it stands at .39. The red line shows us that it got this low back in 2024. Twice.
In January 2024, we got a few days of downside as the S&P lost 100 points over the course of four trading days, about two percent. However, in July of 2024, the S&P embarked on a ten percent drawdown.
Then there’s the folks at the National Association of Active Investment Managers (NAAIM) who have increased their exposure up to 102.66. Once over 100, they are on margin. You can see they have not been on margin since July 2024 (green arrow).
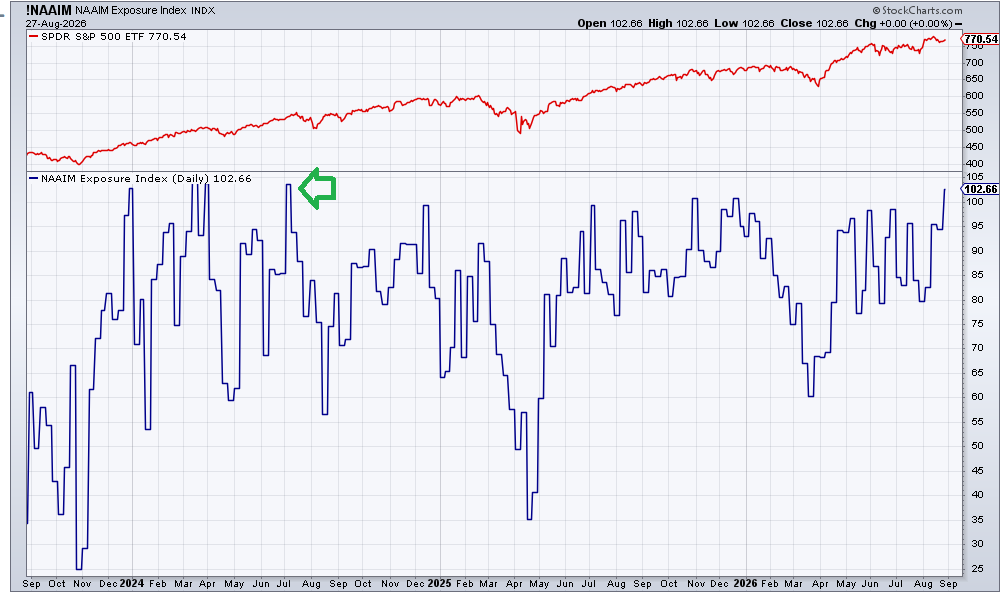
You can also see they were on margin heading into January 2024. The other time in the last three years they were on margin was the spring of 2024, and here too we had a six percent pullback in April.
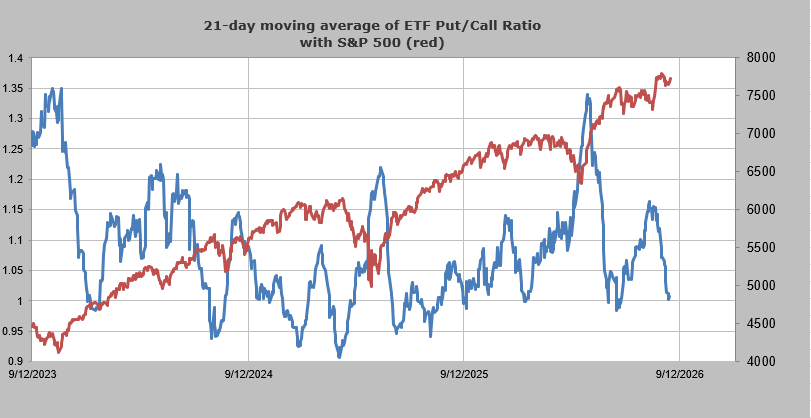
Even the 21-day moving average of the put/call ratio for ETFs shows a high level of complacency as it is back to where it was in early June when the semiconductors peaked.
I am certain someone will cite the AAII as being bullish, so once again, I will reiterate my view on the AAII readings. This is my opinion, and I realize it is not shared by others, but I think it is a garbage survey and tends to be useful as a contrarian indicator when confirmed by other sentiment indicators. I would remind everyone that these folks were 50% bearish in February 2025, which was weeks before the Tariff Tantrum came our way. So much for being contrarian.
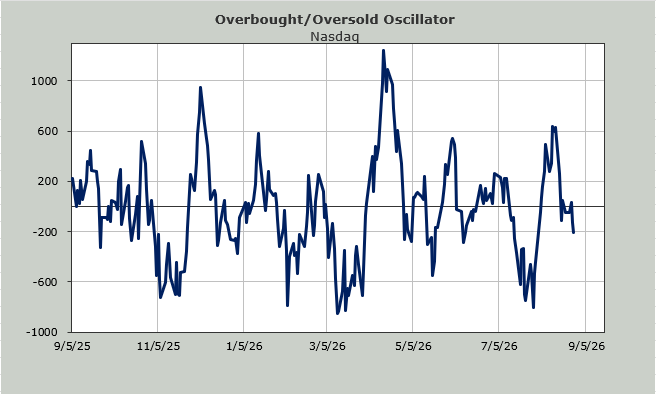
Thursday’s action was heavily concentrated in NVDIA, which is no surprise since we know in the Either/Or Market, when NVDIA rallies, it tends to do so at the expense of the others. And the others were weak. Not extreme, but they surely didn’t enjoy the rally. So the indicators did not change.
I think we’re due some volatility.