A Look at Tuesday’s Charts – The 2-Year Surges as Stocks Make a Third Higher Low
The 2-year yield had its biggest gain since April 2025 and Nasdaq-100 failed at its 200-DMA, but the S&P 500 made a third straight higher low as the VIX fell again.
You've reached your free article limit
You've read 0 of 1 free Pro articles.

This is the companion to tonight’s evening update (The Equity Bounce Runs Into a Hawkish Fed).
In sort, the CPI report I flagged in last night’s update (AI Bounce Drives Broad Market Rally) as the next catalyst came in hot, and two Fed officials made the case for the Fed to consider quickening the pace of rate hikes, taking the steam out of Monday’s bounce, although stocks pared back over half their losses by the close.
Note on all charts the colored lines are moving averages (the average price over the lookback period — days on the daily charts, weeks on the weekly charts):
20 = green
50 = purple
100 = blue
200 = brown
MACD = Moving average convergence/divergence line, a measure of momentum that compares longer term and shorter term momentum to gauge if a move is strengthening or weakening. This is probably my favorite individual indicator.
RSI = Relative Strength Index (basically what it sounds like) = measures the strength of the move comparing gains to losses over the given lookback window (I use the standard 14 periods).
S&P 500
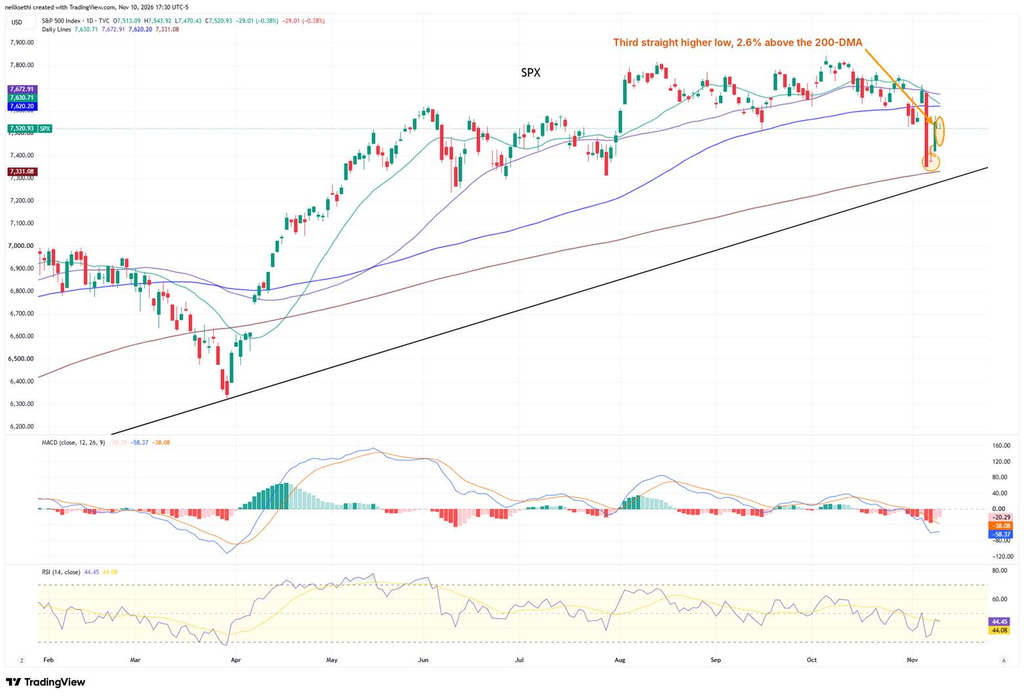
The SPX fell 0.38% to 7,521 after trading as low as 7,470, but that was still its third straight higher low, meaning traders are buying dips. It remains about 2.6% above its 200-DMA (7,331) but below its 20-, 50- and 100-DMAs (7,631, 7,673 and 7,620). The MACD remains in “go short” positioning, and the RSI is at 44. I remain long.
Nasdaq Composite
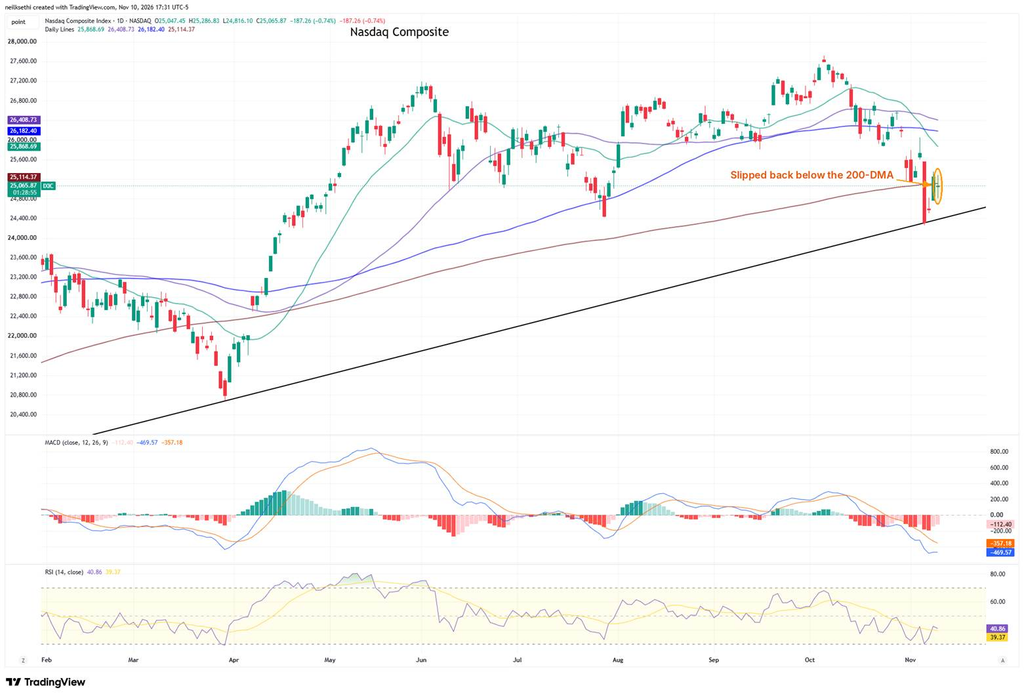
The Nasdaq Composite fell 0.74% to 25,066, slipping back below its 200-DMA (25,114) a day after reclaiming it. It’s also below its 20-, 50- and 100-DMAs (25,869, 26,409 and 26,182). The MACD remains in “go short” positioning, and the RSI is at 41.
The Nasdaq-100 (QQQ)
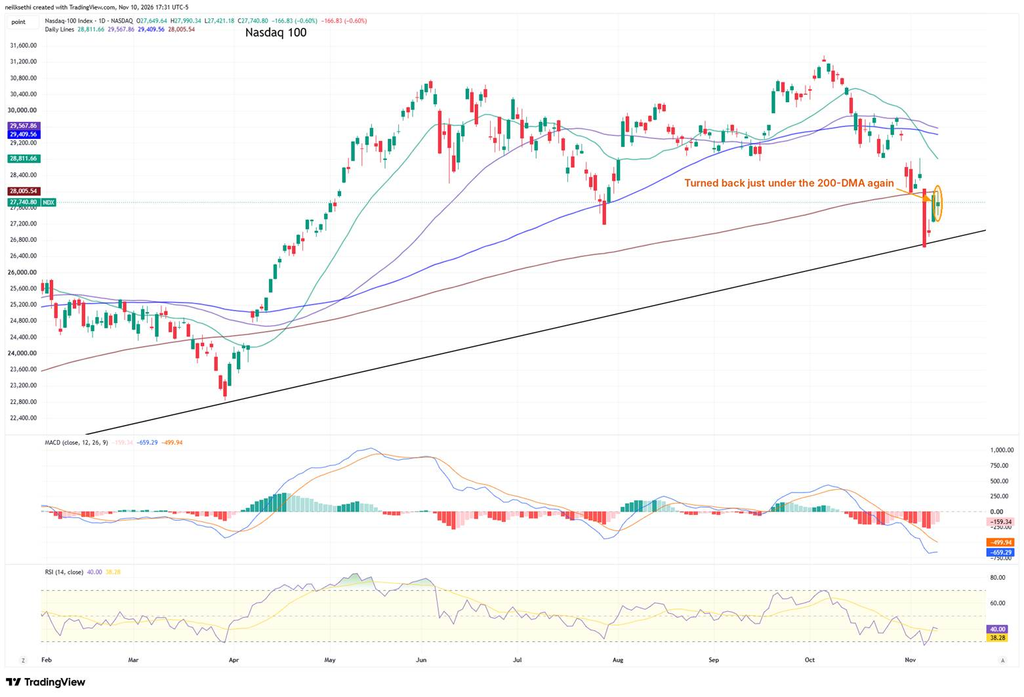
The Nasdaq-100 fell 0.60% to 27,741 after turning back just under its 200-DMA (28,006) again, with a high of 27,990. The MACD remains in “go short” positioning, and the RSI is at 40. I remain short unless it reclaims its 200-DMA.
The Russell 2000 (RUT)
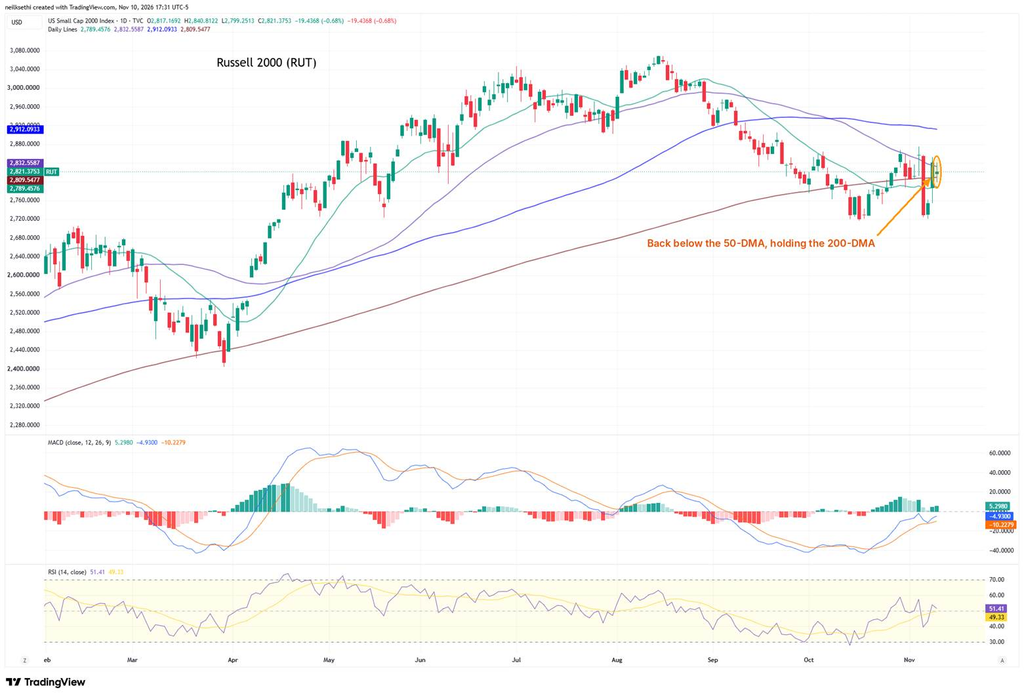
The Russell 2000 fell 0.68% to 2,821, slipping back below its 50-DMA (2,833) but holding above its 20- and 200-DMAs (2,789 and 2,810). It’s still below its 100-DMA (2,912). The MACD remains in “cover shorts” positioning, and the RSI is at 51. I remain long.
The equal-weighted SPX (RSP)
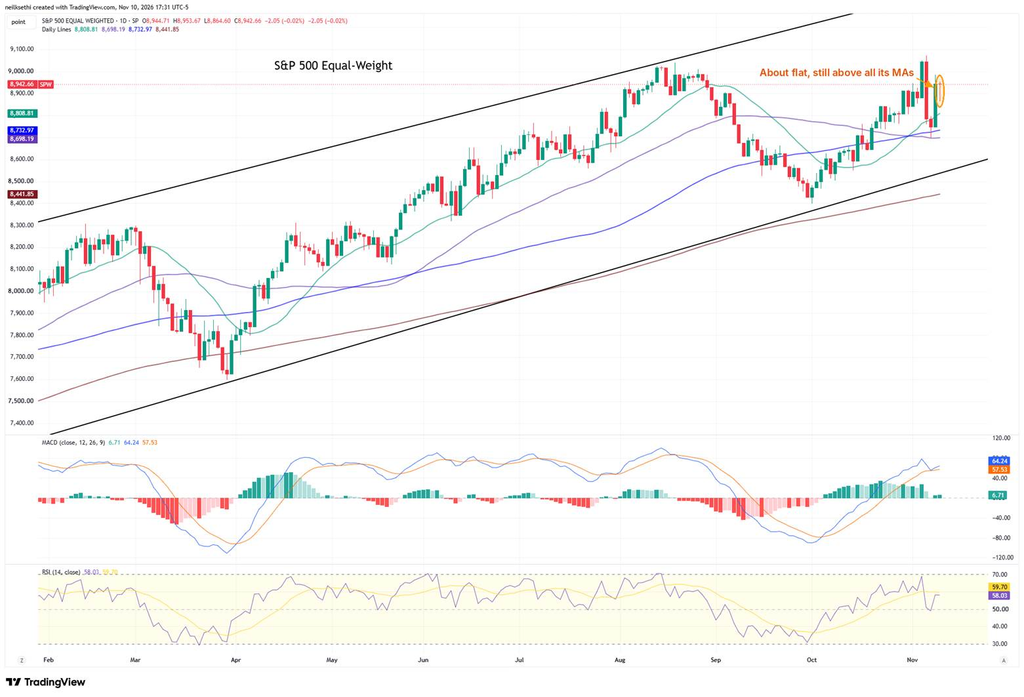
The equal-weighted SPX was about flat (-0.02%) at 8,943, holding above all its moving averages, including its 20-DMA (8,809). The MACD remains in “buy longs” positioning, and the RSI is at 58. I remain long.
The 2-year Treasury
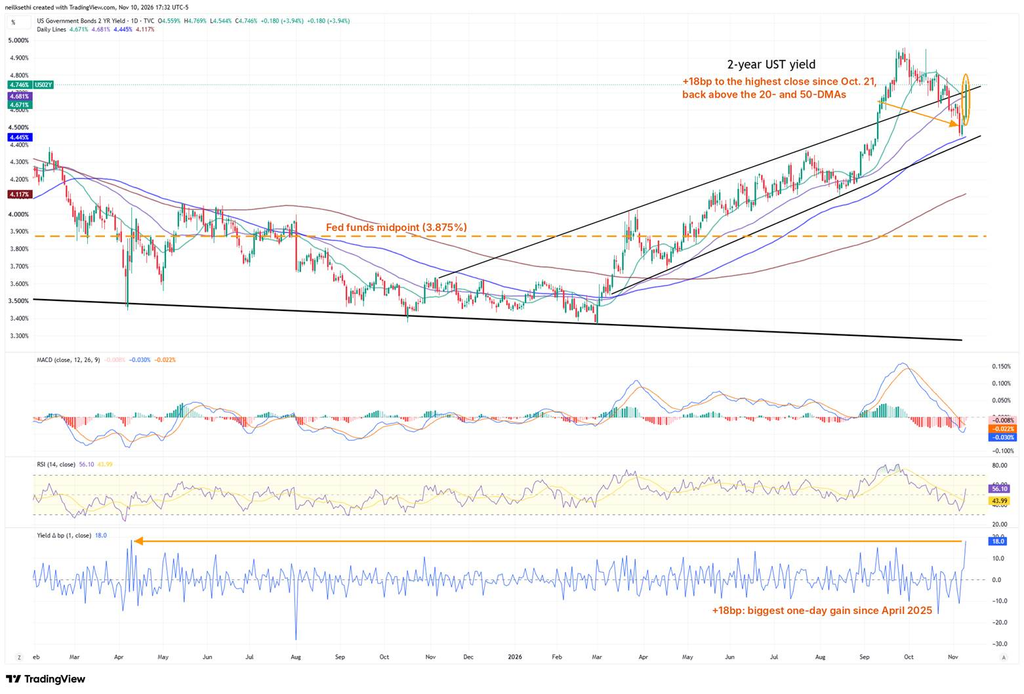
The 2-year yield jumped 18 basis points to 4.75%, its biggest one-day gain since April 2025 and its highest close since October 21. That took it back above its 20- and 50-DMAs (4.67% and 4.68%) and the channel line it broke below in late October, and it leaves it about 87bp above the midpoint of the Fed funds target range (3.875%). The MACD is in “go short” positioning, and the RSI is at 56. If it extends tomorrow, a retest of the September highs may be in the cards, which might be a good buying opportunity.
10-year yields
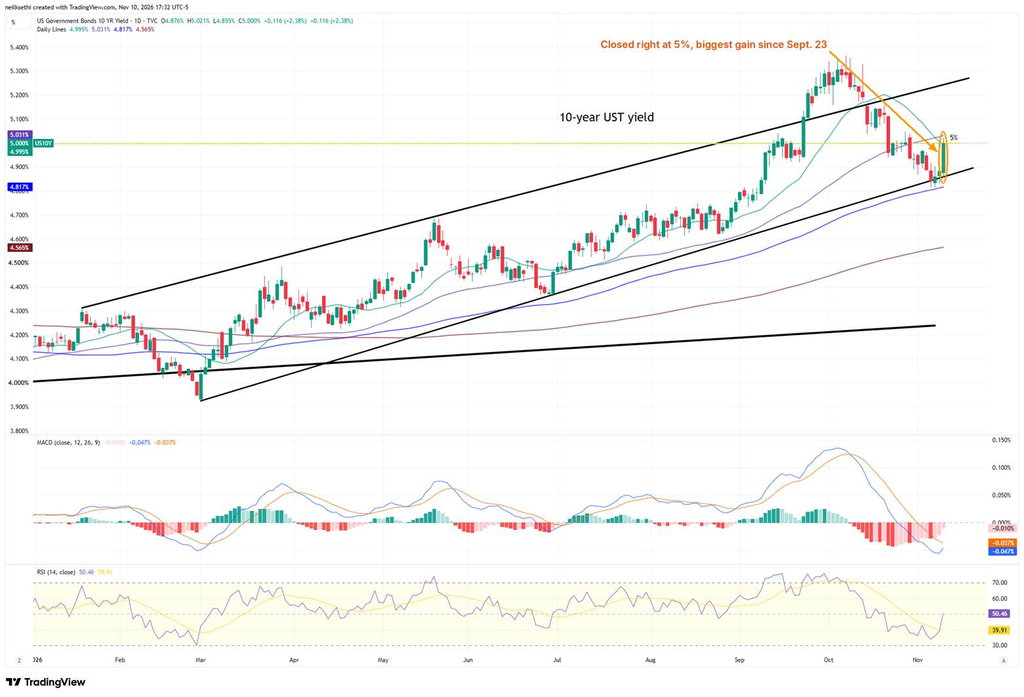
The 10-year yield jumped 11.6 basis points to 5.00% after topping out at 5.02%, its biggest gain since September 23 and its highest close since October 28. That puts it back above its 20-DMA (4.995%), but just below its 50-DMA (5.03%). The MACD is in “go short” positioning, and the RSI is at 50.
30-year yields
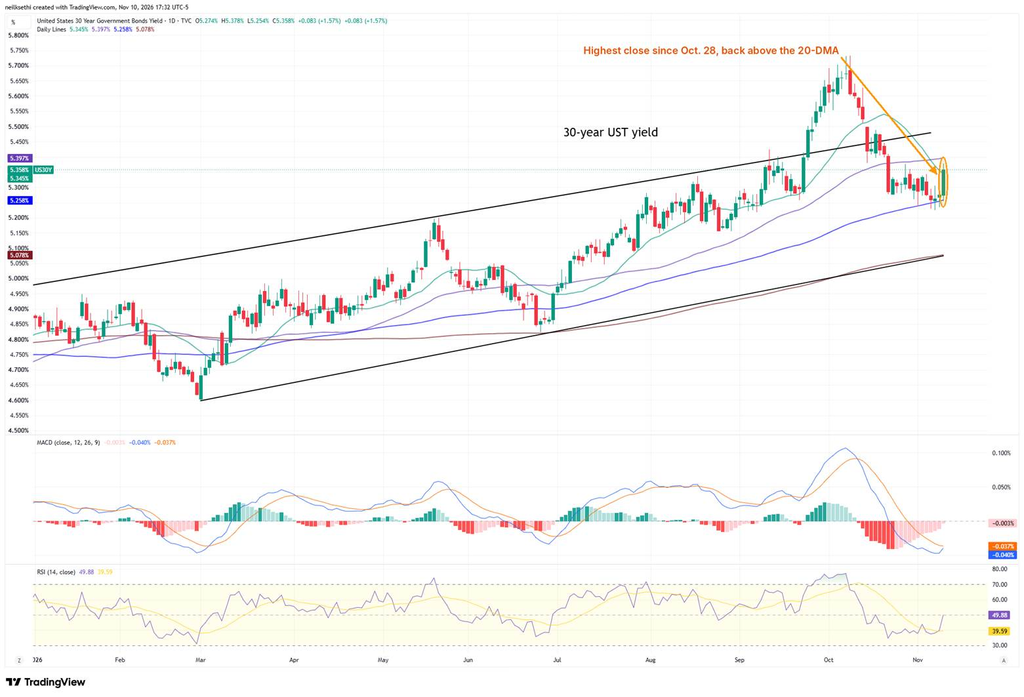
The 30-year yield rose 8.3 basis points to 5.36%, its biggest gain since September 23 and its highest close since October 28, moving back above its 20-DMA (5.35%) but staying below its 50-DMA (5.40%). The MACD is in “go short” positioning, and the RSI is at 50.
VIX
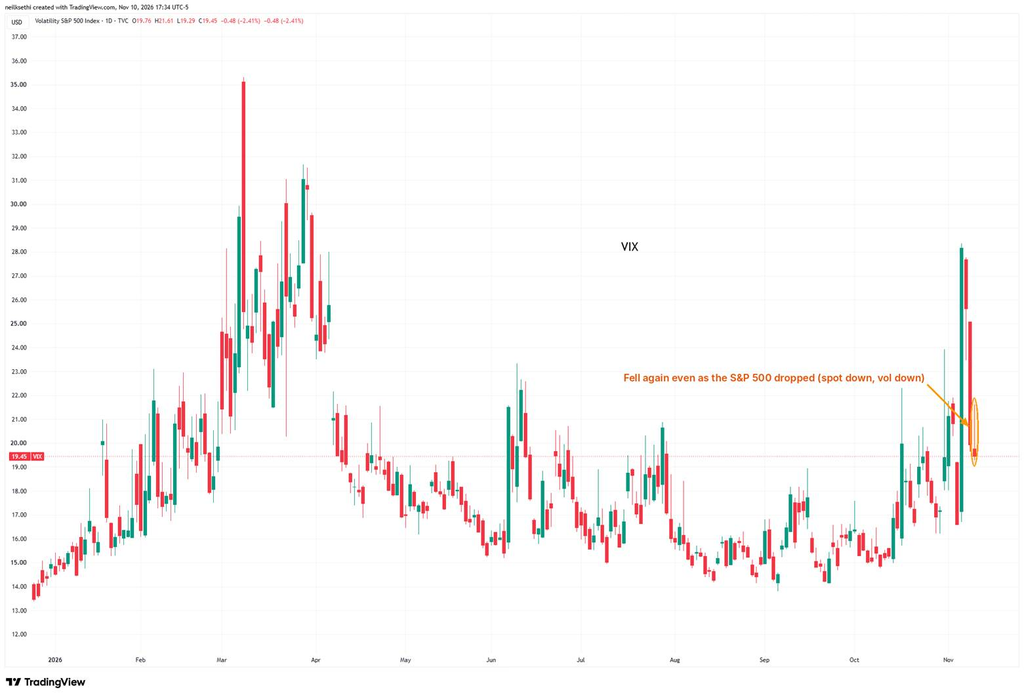
The VIX fell 2.41% to 19.45, its lowest close since November 4, even as the S&P 500 fell 0.4%. As noted in tonight’s evening update, a spot-down, vol-down day that size has come on only 4% of comparable S&P 500 down days since 1990, and it’s the first since March 2025. The VIX now implies a daily move of about 1.23% over the next 30 days. I plan to have a Stock Market Today post on equity returns following such a move tomorrow.
VVIX
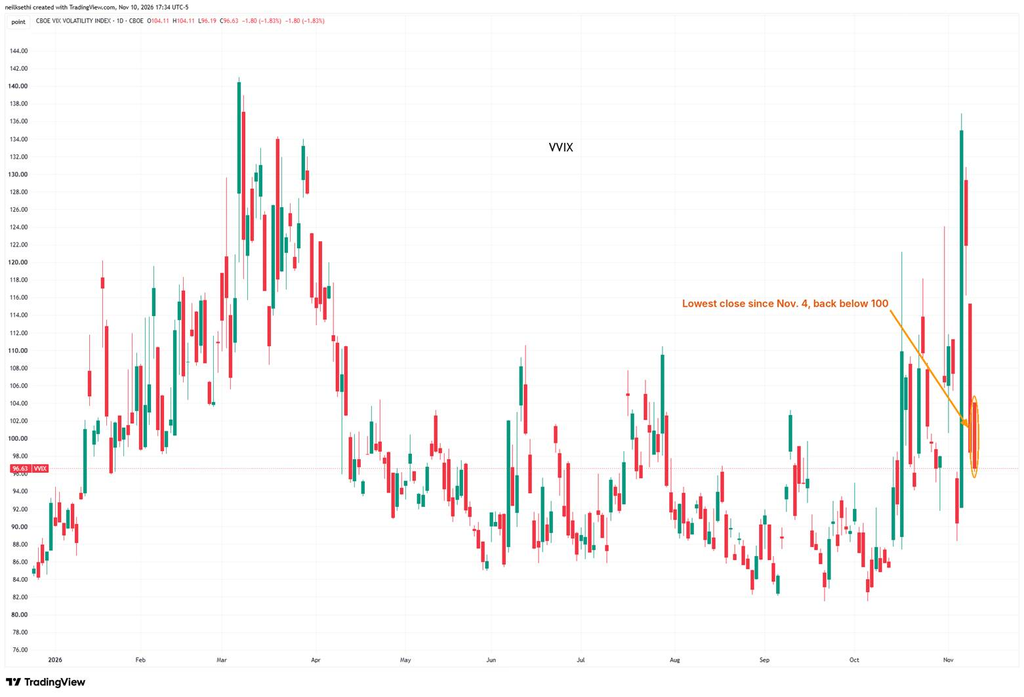
VVIX (the VIX of the VIX) also fell 1.83% to 96.63, its lowest close since November 4. The current level is consistent with “moderate” daily moves in the VIX over the next 30 days (historically, normal is 80-100, although we haven’t been below 80 since July 2024), and it remains below the 100 level flagged by Charlie McElligott as indicating higher stress.
1-day VIX
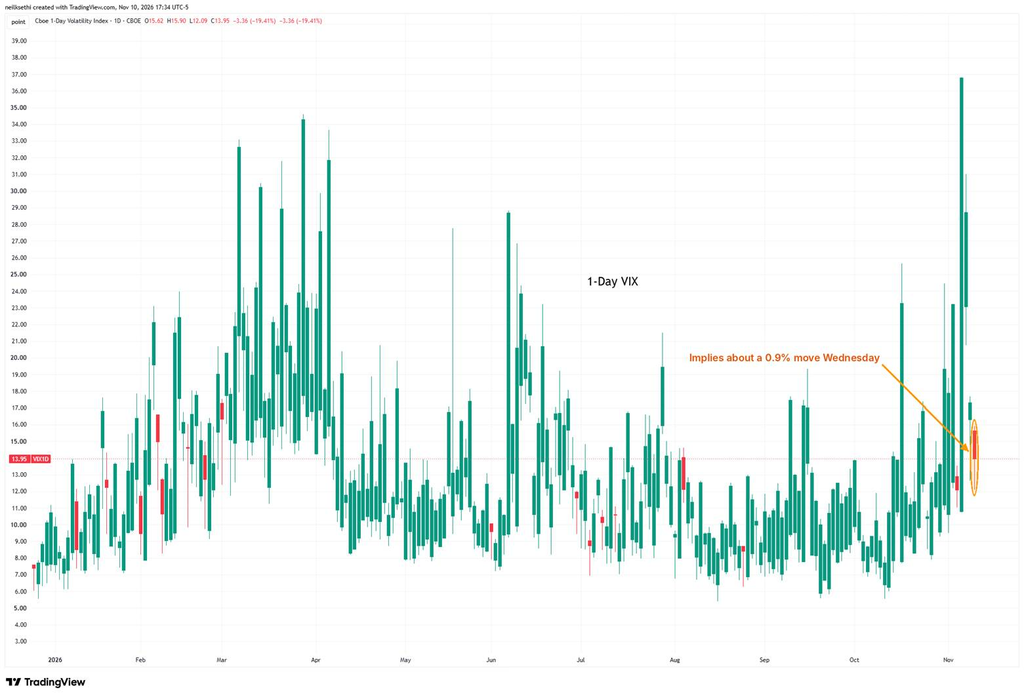
Monday’s 1-day VIX implied a move of about 1.09% for Tuesday, and the SPX fell 0.38%. The 1-day VIX then fell 19.41% to 13.95, implying a move of about 0.88% for Wednesday.
WTI futures (/CL)
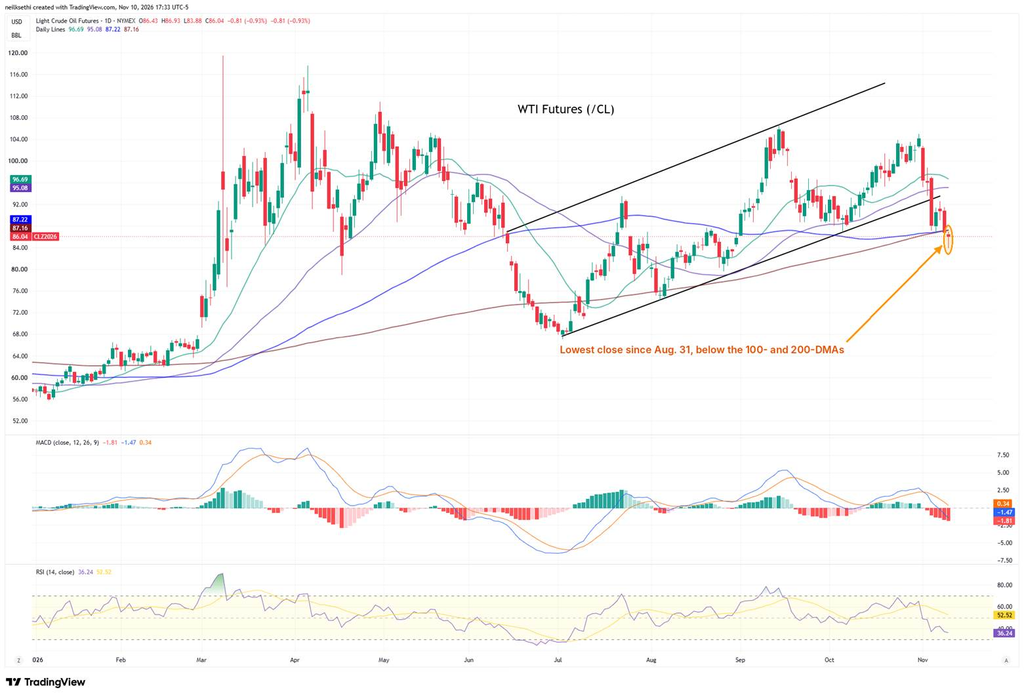
WTI futures fell 0.93% to $86.04, their lowest close since August 31, after falling as low as $83.88. They remain below their 100- and 200-DMAs (both about $87.20). The MACD is in “go short” positioning, and the RSI is at 36.
DXY
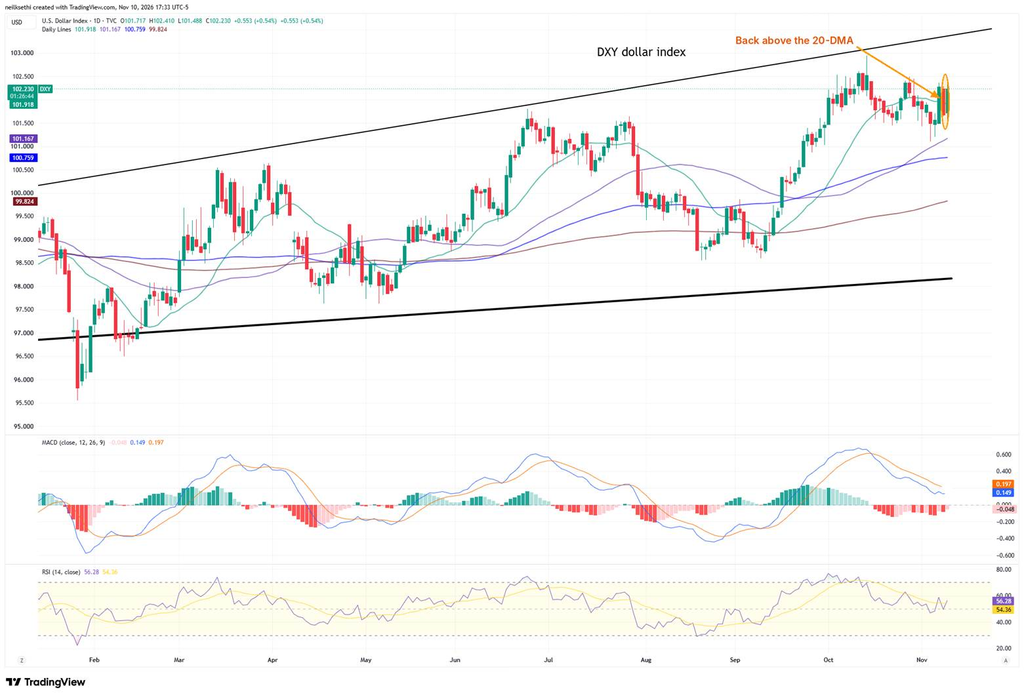
The DXY dollar index rose 0.54% to 102.23, moving back above its 20-DMA (101.92) and staying above its 50-, 100- and 200-DMAs. The MACD is in “sell longs” positioning, and the RSI is at 56 so no clear direction signal.
Gold futures (/GC)
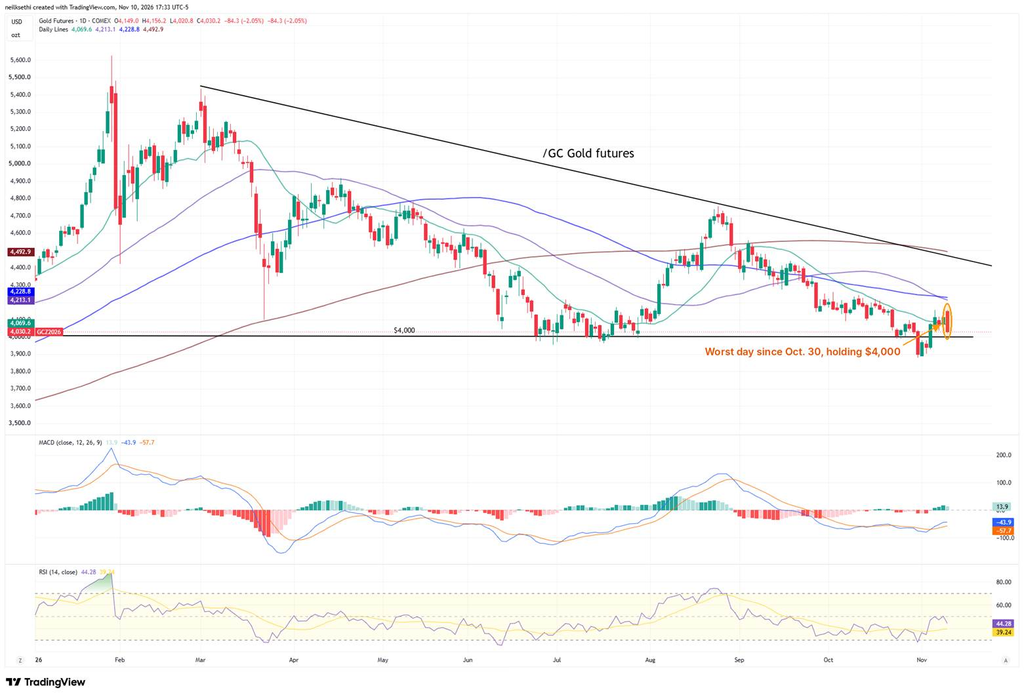
Gold futures fell 2.05% to $4,030.20, their worst day since October 30, slipping back below their 20-DMA ($4,070) but holding above $4,000. They’re still below their 50-, 100- and 200-DMAs and the downtrend line from the March high. The MACD is in “cover shorts” positioning, and the RSI is at 44.
Copper futures (/HG) and the copper ETF (CPER)
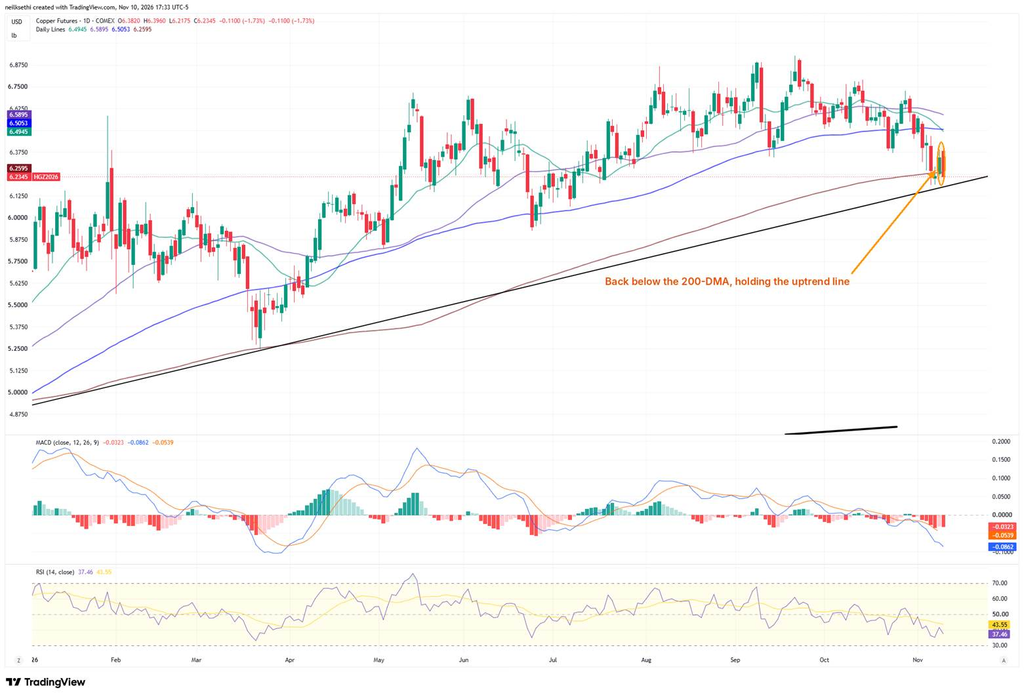
Copper futures fell 1.73% to $6.23, slipping back below their 200-DMA ($6.26) but holding their uptrend line. They’re still below their 20-, 50- and 100-DMAs. The MACD is in “go short” positioning, and the RSI is at 37.
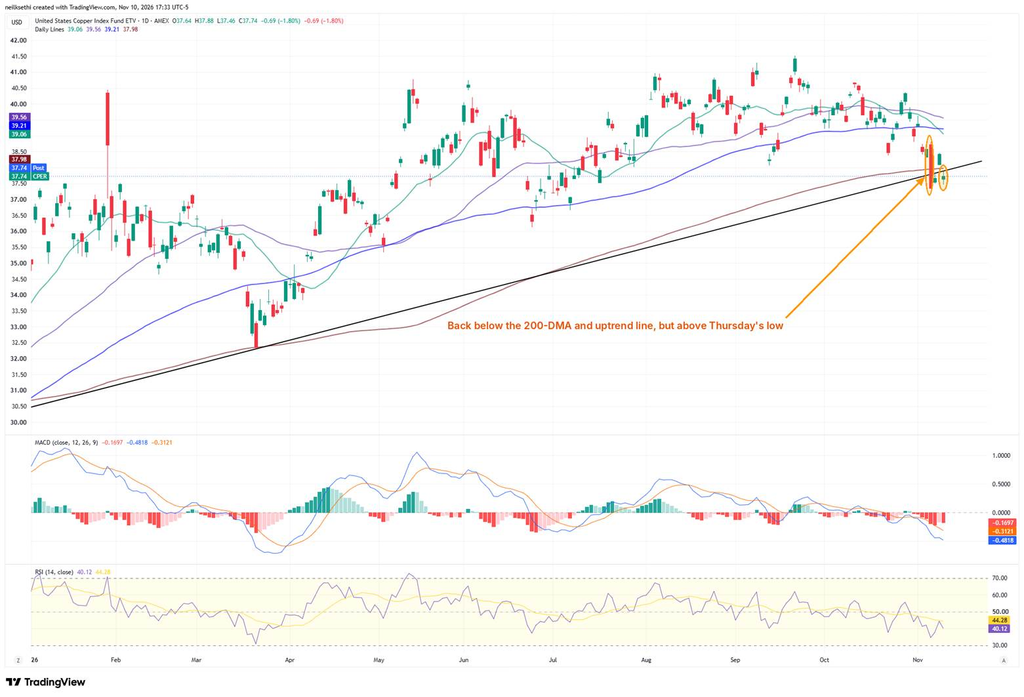
The copper ETF (CPER) fell 1.80% to $37.74, slipping back below its 200-DMA ($37.98) and the uptrend line, but it held above Thursday’s low ($37.33). I’m giving my CPER long the benefit of that Thursday low.
Natural gas futures (/NG)
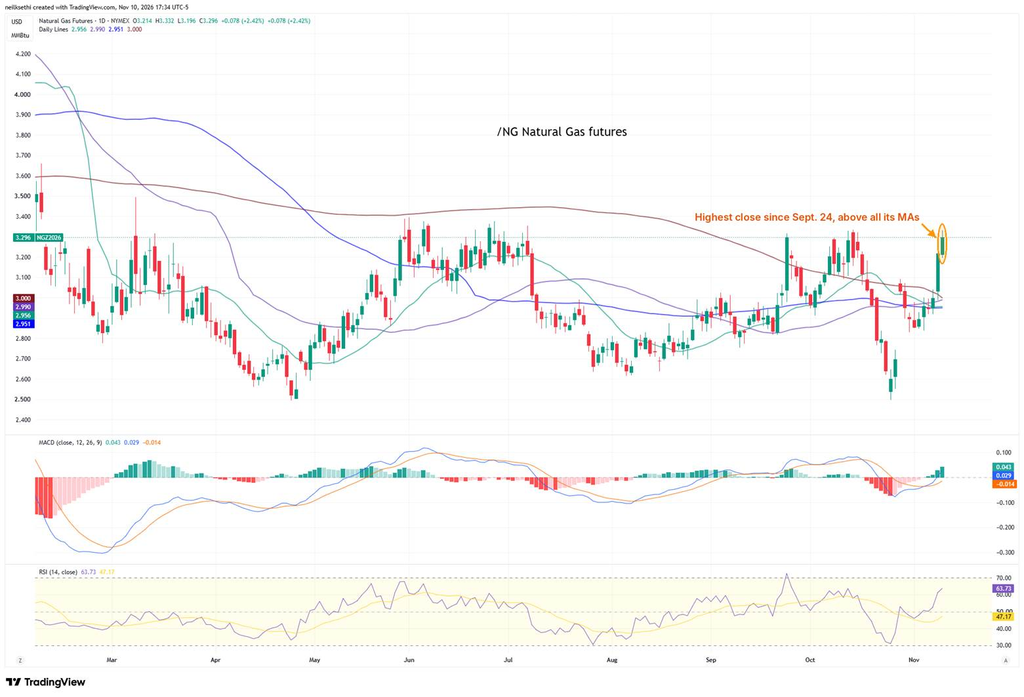
Natural gas futures rose 2.42% to $3.30, their highest close since September 24, staying above all their moving averages. The MACD is in “buy longs” positioning, and the RSI is at 64. The $3.40 level has capped its moves since mid-February. A close above could see a bout of short covering.
Bitcoin futures
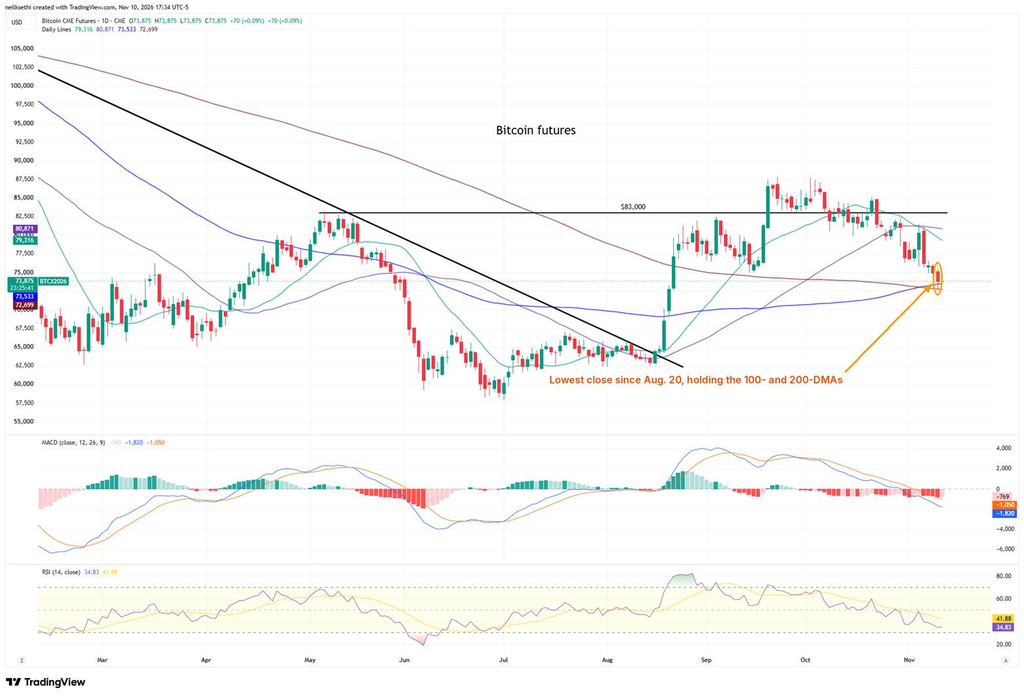
Bitcoin futures fell 1.51% to 73,805, their lowest close since August 20, but held above their 100- and 200-DMAs (73,533 and 72,699). They’re still below their 20- and 50-DMAs. The MACD is in “go short” positioning, and the RSI is at 35. If they break the 200-DMA I might go short.
Market breadth
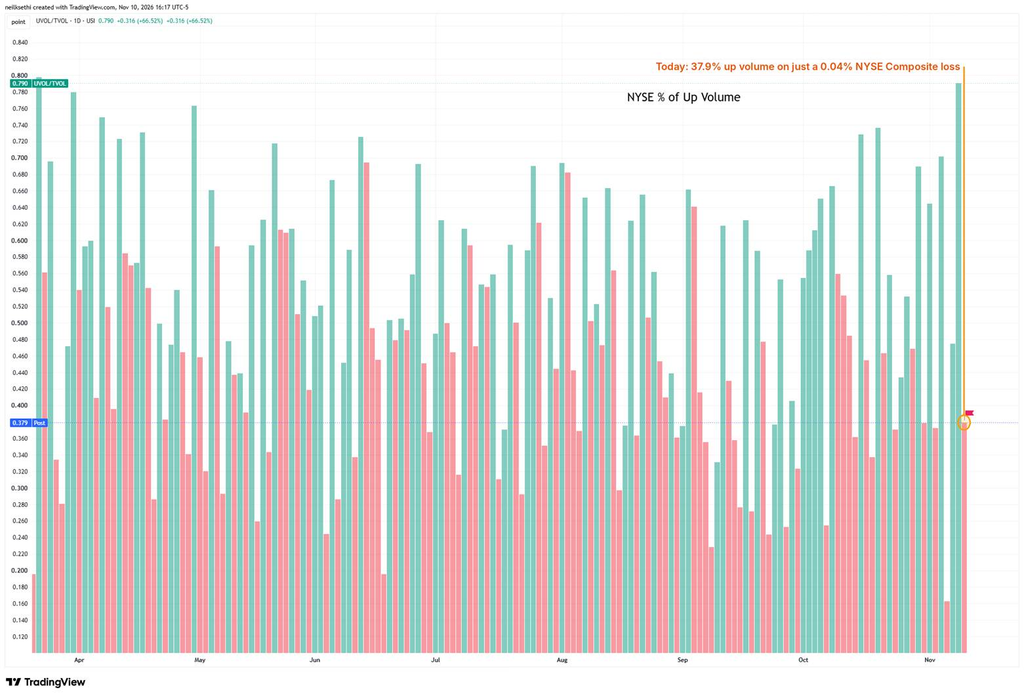
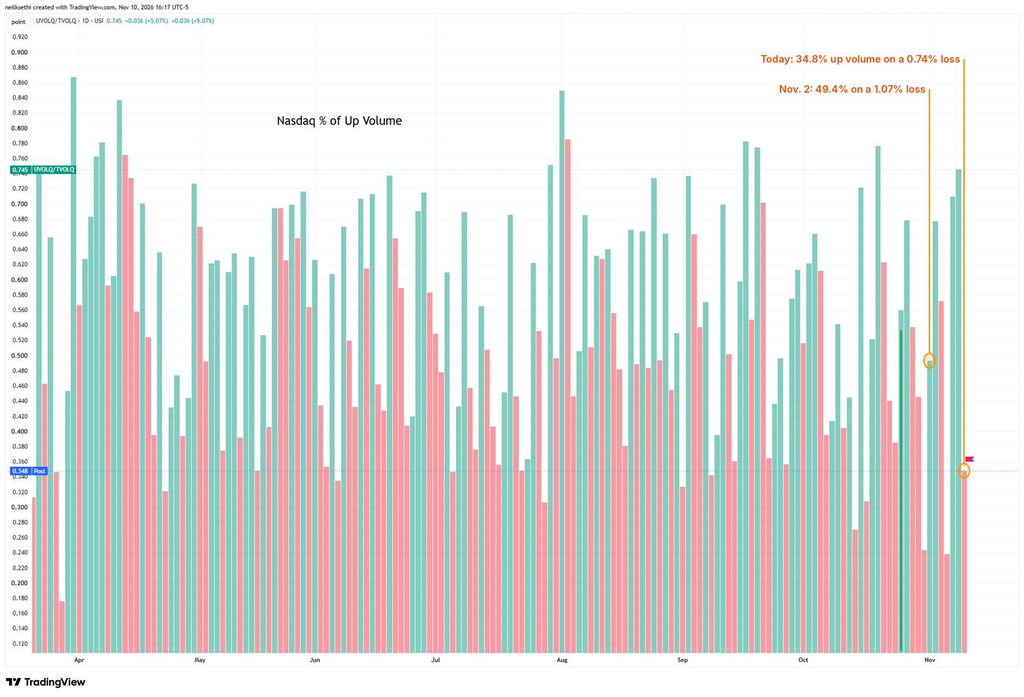
Positive volume was very weak at 37.9% on the NYSE despite just a 0.04% dip in the NYSE Composite, and it was also weak at 34.8% on the Nasdaq on a 0.74% loss. Compare the Nasdaq with November 2, when Nasdaq positive volume was 49.4% on a 1.07% loss.
52-week highs minus lows on the Nasdaq fell to -212 from -91, its 52nd straight negative session and now the longest run since November 2022. On the NYSE, it fell to -69 from -23.
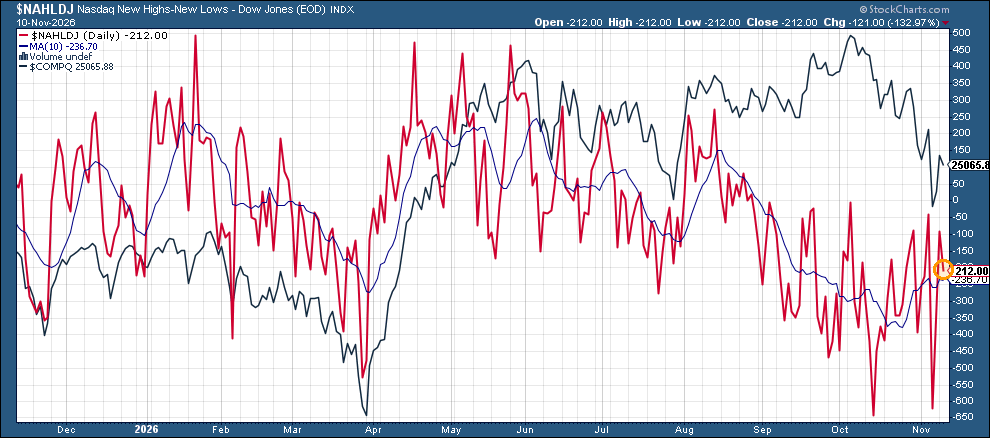
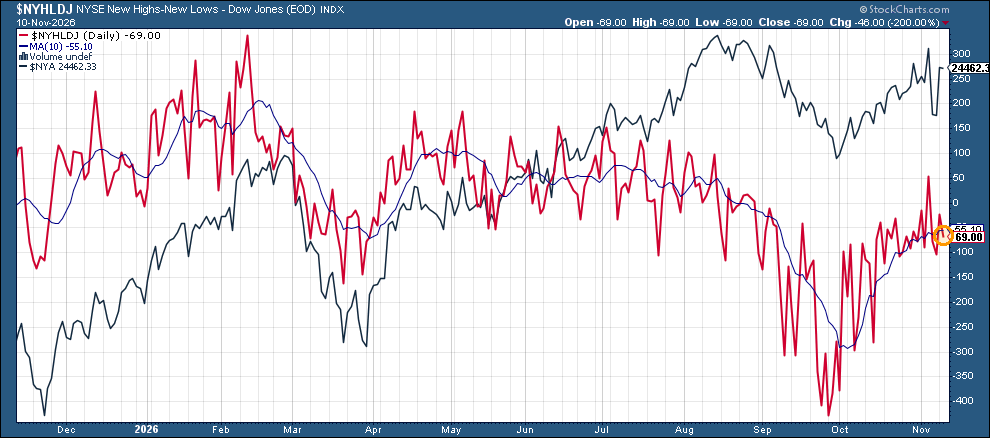
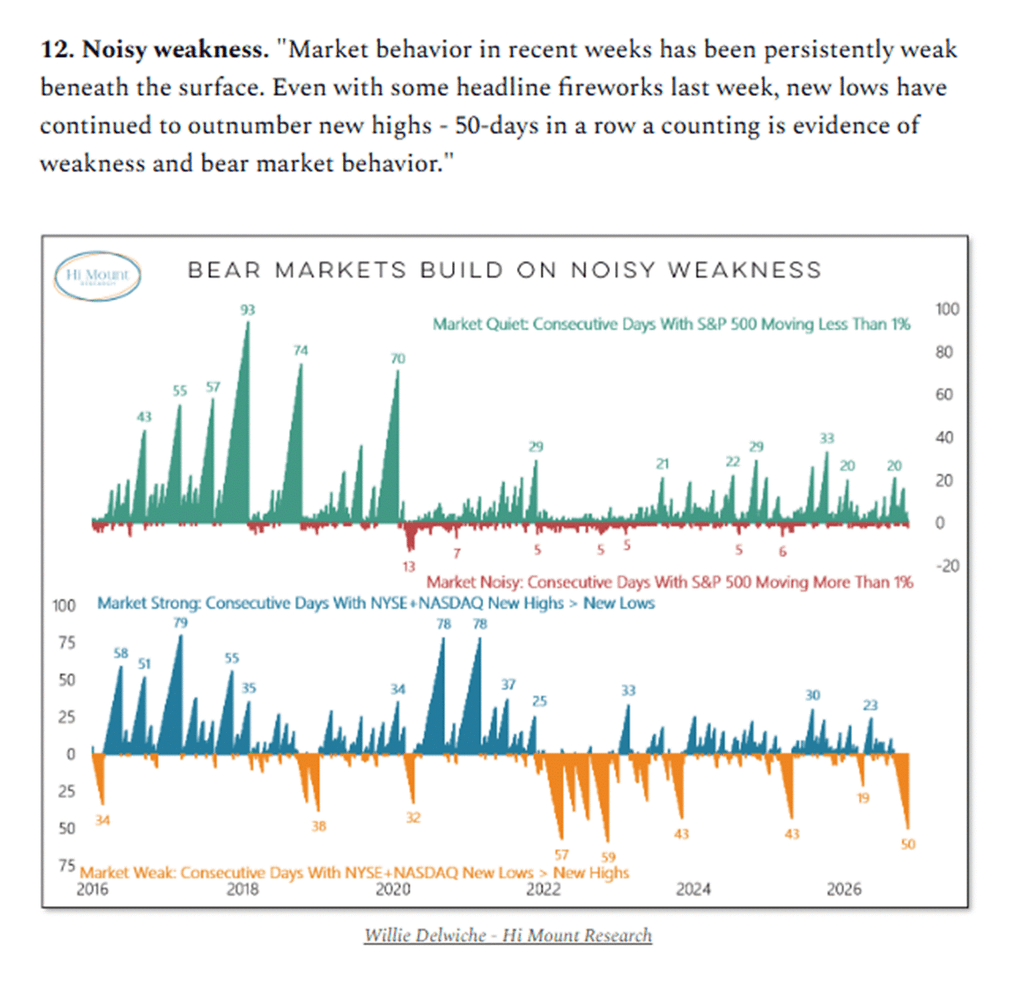
Willie Delwiche of Hi Mount Research noted that new lows have outnumbered new highs on the NYSE and Nasdaq combined for 50 straight days through last week, which he called “evidence of weakness and bear market behavior.” On his chart going back to 2016, only two runs were longer, 57 and 59 days, both in 2022, while the runs in 2023 and in 2025 stopped at 43.
At the time of publication, in terms of securities mentioned, Sethi was long CPER, IWM, RSP, SPY and numerous Treasury ETFs, and short QQQ.