The Bounce Isn’t the Story. The Shift in Sentiment Is.
A 2022 sentiment/market pattern is reappearing. Here’s how that played out. Also, two charts I’ve really got my eye on and much more.
You've reached your free article limit
You've read 0 of 1 free Pro articles.
The Market
Another bounce. And with pretty much the same sort of statistics we’ve seen when the semis bounce: everything else mostly sits it out. The Either/Or Market. Perhaps with Nvidia (NVDA) getting smacked around again in after hours it leaves some room for the “others” to rally but the real change Wednesday was sentiment.
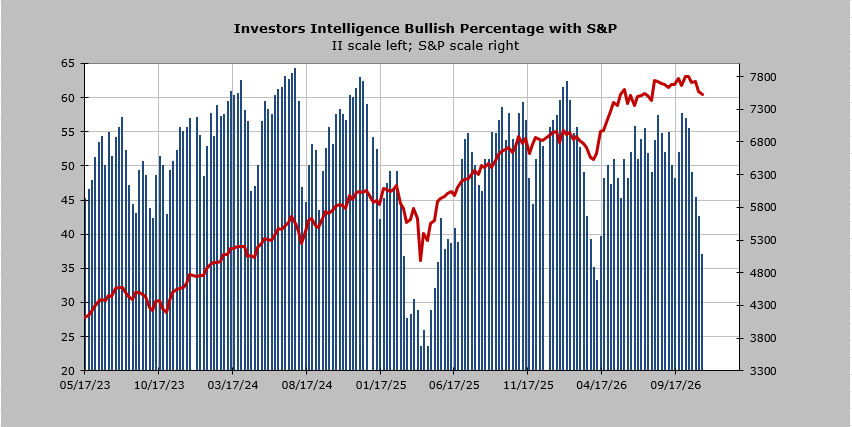
The Investors Intelligence bulls dropped to 37%. They were at 33% at the spring low. The bears jumped to 24%. They were at 31.5% at the April low. But I delved into it a bit more.
Recall when I first showed that chart of the Sentiment Cycle and the Nasdaq I noted there were some similarities to the statistics we saw in 2022. So I went back and looked at the Investors Intelligence readings from 2022 and found it interesting. The question we have to ask ourselves is if this is a bear market as 2022 was or if this is more akin to the spring low.
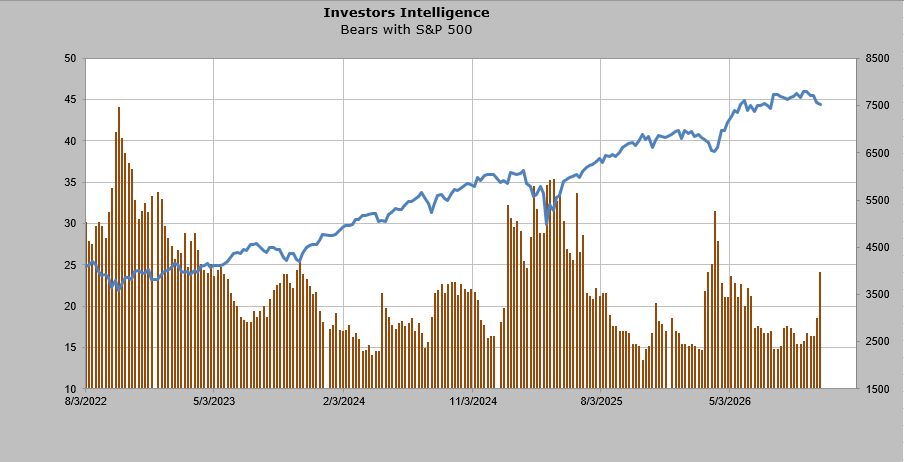
On the chart of the S&P 500 from 2022 point A saw the bulls come down to 35%. That was a nice rally as the S&P rallied almost 10%. Then we came down again.
Point B saw the bulls at 30%. Again we saw a great rally. That netted the S&P a rally just over 10%. Then we came down again.
Point C netted a rally of just shy of 10%, we whooshed down and then enjoyed another 10% rally. Then we came down again.
Point D led to a much more extended rally in both time and price as we rallied not only 18% but also to a higher high than the late May rally. Then we came down again. The final low was in October.
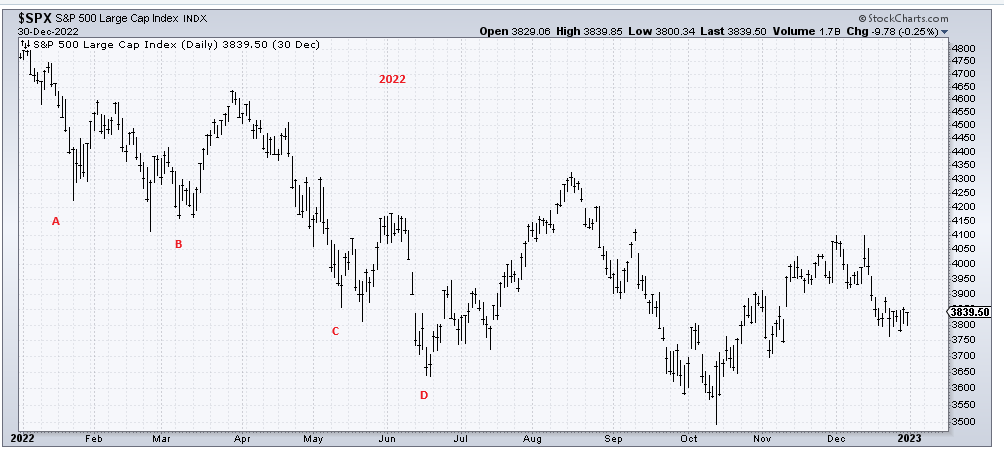
Since I don’t think last week was the great capitulation low everyone seems to (now) think it is my guess is we will enjoy this rally — in fits and starts — a bit more, and then we’ll see if the indicators, which I anticipate to get overbought around Thanksgiving, will begin to roll over.
Let’s enjoy the change in sentiment while we can.
New Ideas
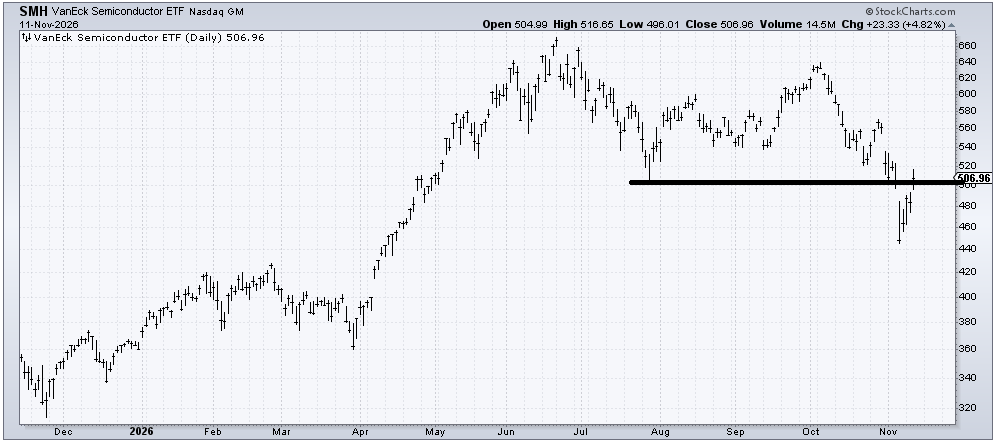
There are two charts I have my eye on. The first is the VanEck Semiconductor ETF (SMH). Not just because of Nvidia (NVDA) but because I had said I thought it should fill that gap at $500. It did so Wednesday. If it cannot hold onto this general area, call it $480-500, that would mean that spike low from last week should get tested.
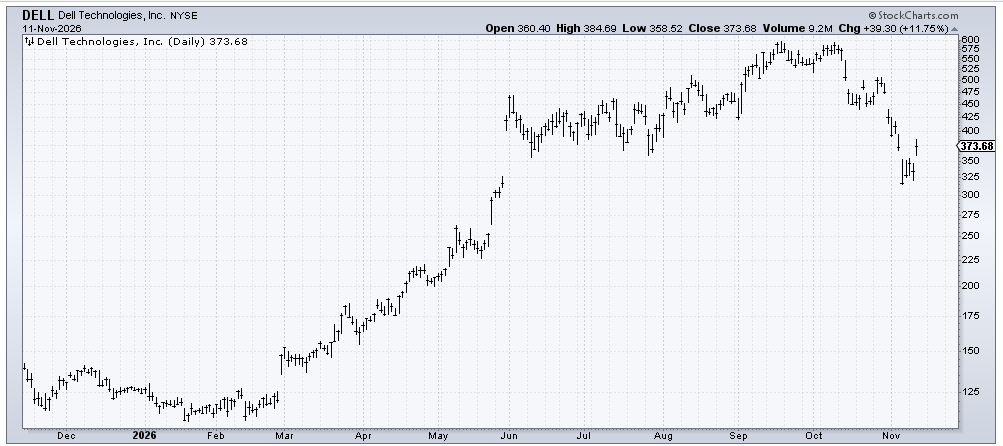
The other stock I have my eye on is Dell Technologies (DELL). I was asked about it so often in the last few weeks that I am now interested in the pattern that has developed. I said I thought it should fill that gap at $375. It did so Wednesday. But it did so on a gap up, potentially leaving the trading over the last week down there as an island. If the stock fills the gap, then we’re right back where I thought we were: an oversold stock set to fill a gap. If it does not fill that gap (call it $350) then the stock has room to get into that $425-450 area.
Today’s Indicator
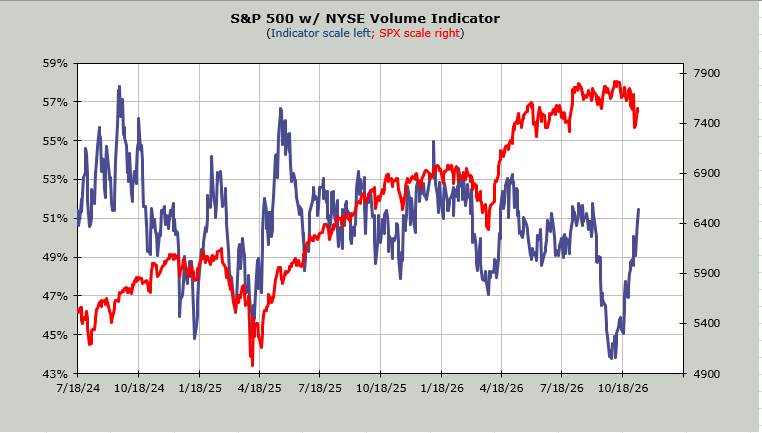
The Volume Indicator is at 51%. It gets overbought in the mid-to-upper 50s.
Q&A/Reader’s Feedback
Helene welcomes your questions about Top Stocks and her charting strategy and techniques. Please send an email directly to Helene with your questions. However, please remember that TheStreet.com Top Stocks is not intended to provide personalized investment advice. Email Helene here.
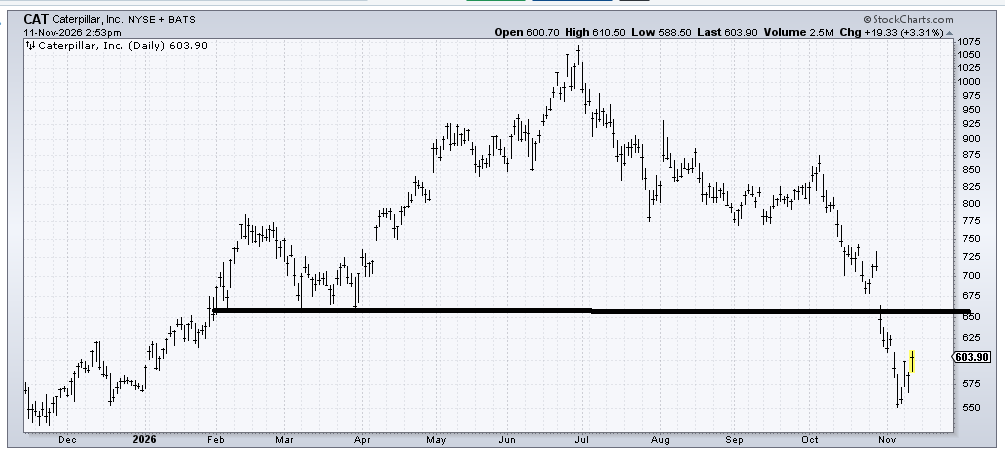
Caterpillar (CAT) has a very near-term target/resistance around $625-650. I don’t know if it gets there in a straight line but it ought to give it a try over the next week or so.
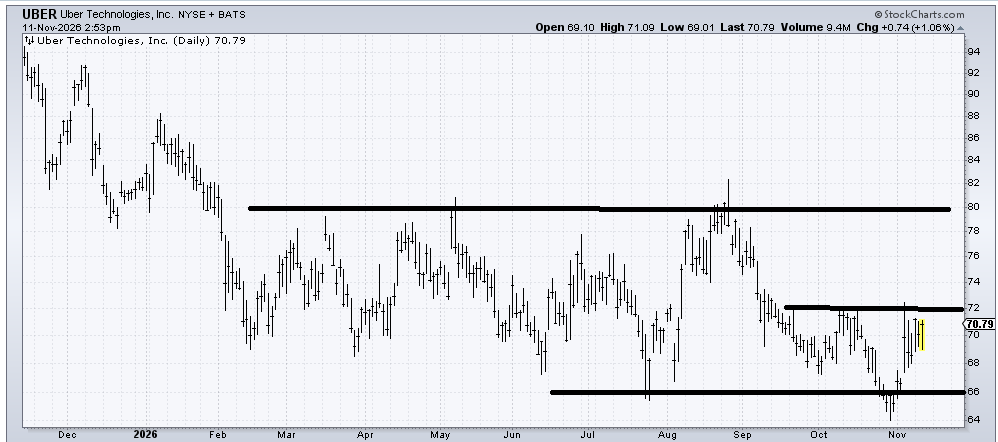
Uber (UBER) once again has bounced off the lows, although notice each trip down the low is fractionally lower each time. In any event, $72 is resistance in the very near term so I expect it will take some time for the stock to get itself up and over before it makes its way toward the upper $70s where I would expect it to peter out. If I am wrong, then we’ll know because it won’t be able to get over $72.
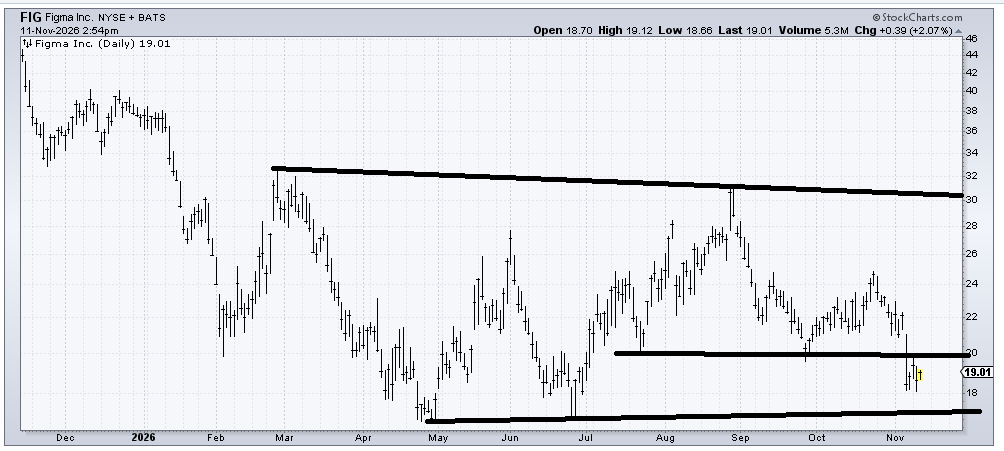
I don’t love the chart of Figma (FIG) because it broke support at $20 and has not snapped back quickly. So if it can get up and over $20 in a hurry, then I’d be impressed. I’d love to see it have a quick move down to tag the lower line and then reverse because that would signal to me the sellers are done. And if we got something like that I’d call this a good tax-loss candidate for a rally.