Setting New Price Targets for Nvidia, S&P 500, Nasdaq Composite
Nvidia, the S&P 500, and the Nasdaq Composite are breaking out in unison.
You've reached your free article limit
You've read 0 of 1 free Pro articles.
It’s like waking up from a bad dream.
Stocks were falling farther from their highs. The semiconductor and AI-focused names that led us higher were faltering. Sector rotation seemed inevitable.
Then you wake up, and it’s just like old times. Two of the major indexes are trading at all-time highs. The entire party is led by a very familiar name.
We Have Liftoff
The S&P 500 reached a new all-time high on Tuesday. It was the 28th record high for the large-cap index this year, and the first new high since Aug. 13, nearly two months ago.
How high will the S&P 500 go from here? The index has just broken out of a two-month consolidation pattern known as an ascending triangle (black dotted lines). This bullish formation suggests a new target of 8200 for the bellwether index.
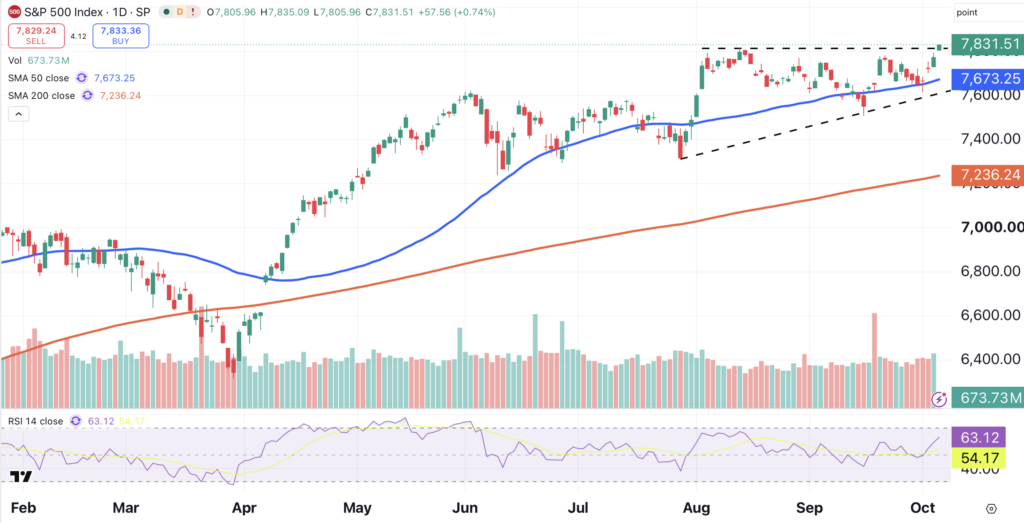
Charts via Tradingview
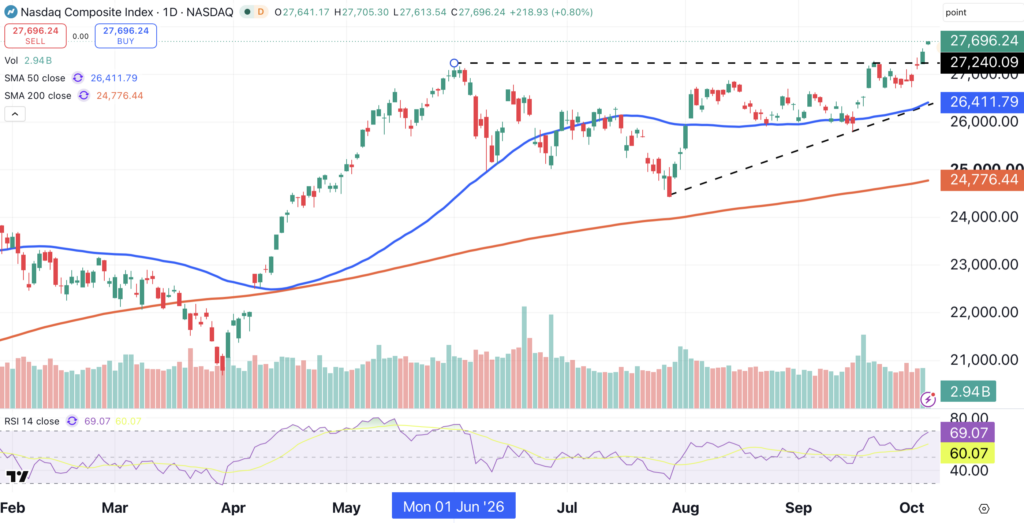
The Nasdaq Composite is enjoying a similar ascending triangle breakout (black dotted lines). According to this chart, the new target price for the tech-laden index is 30,000.
Meanwhile, the Dow Jones Industrial Average has failed to keep pace. The Dow Jones last closed at an all-time high on Aug. 5, and is trading below its downward-sloping 50-day moving average (blue).
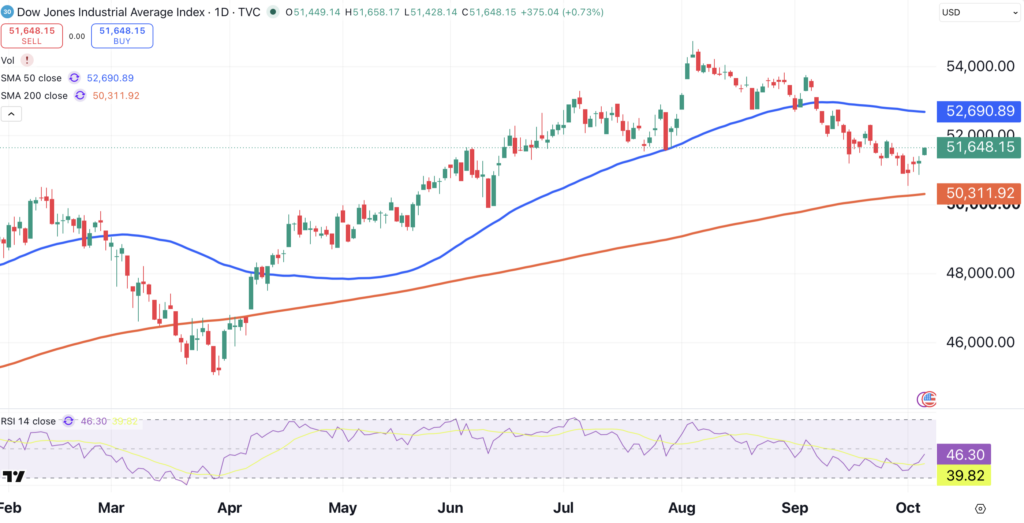
The Dow is being held back by underperformers like Nike (NKE), down 45% this year, International Business Machines (IBM), down 24%, and McDonald’s (MCD), down 23% year-to-date.
I’m Your Captain
The leader of this breakout has been Nvidia (NVDA). This stock has just exited a five-month consolidation.
After viewing the S&P 500 and Nasdaq Composite charts, it comes as no surprise that Nvidia’s consolidation takes the form of a large ascending triangle pattern (black dotted lines).
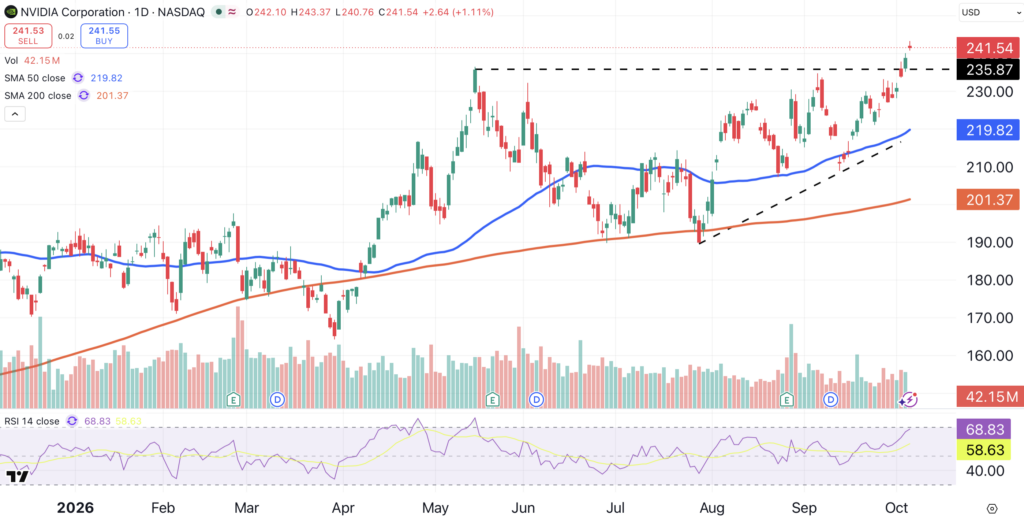
Nvidia has now gained 28% so far this year. Based on its pattern, Nvidia is headed for our new price target of $280. Nvidia’s market capitalization is now $5.7 trillion, a figure that was unthinkable just a few years ago.
The Catalyst
The catalyst that re-ignited buying in Nvidia appears to be the company’s stock buyback plan. The chipmaker recently announced an increase of $150 billion, bringing the total authorized buyback figure to $235 billion.
As of the end of July, Nvidia was sitting on nearly $100 billion in cash and cash equivalents. That figure represents a nearly 75% year-over-year increase. The chart below demonstrates the growth of Nvidia’s cash pile in quarterly increments over the past 10 years.
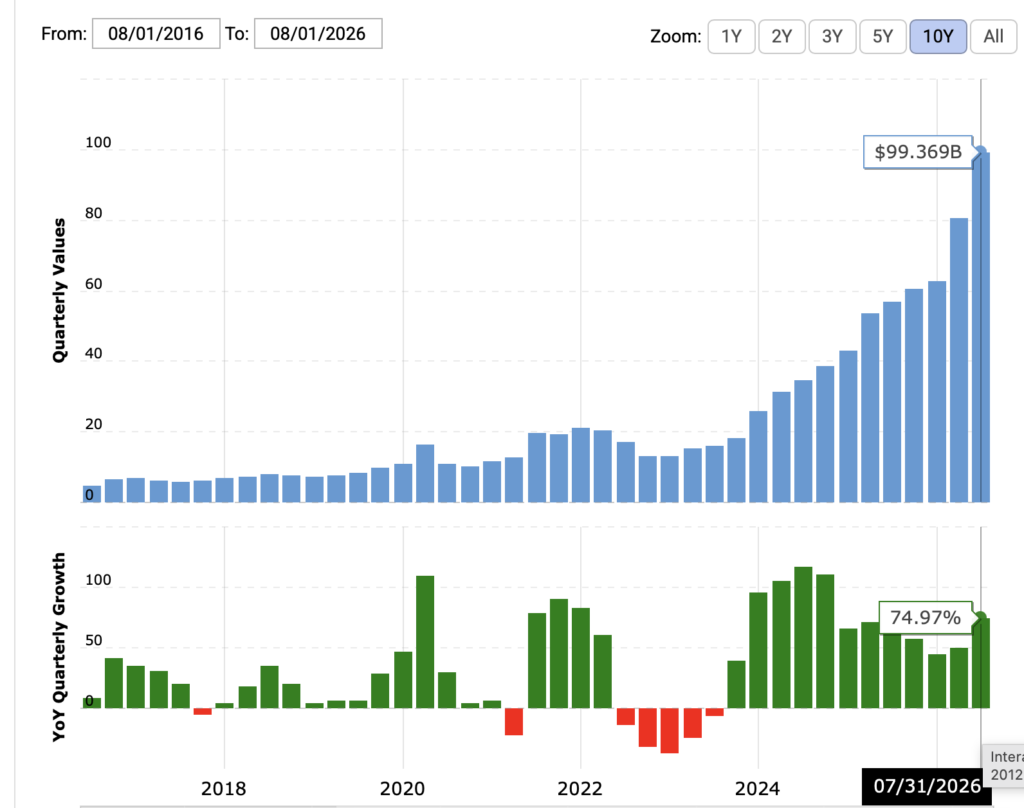
Image via Macrotrends
Still Not Overvalued
Despite the stock’s amazing run, Nvidia shares aren’t overvalued. Nvidia trades at about 25-times trailing earnings, and 28-times forward earnings. That’s pretty much in line with the S&P 500’s valuation.
Just one year ago, the stock traded at 57-times trailing earnings, and 40-times forward earnings.
When we factor in growth, Nvidia’s PEG, or price/earnings-to-growth, ratio makes the stock seem inexpensive. Nvidia has a PEG ratio of 0.49, vs. 1.72 just one year ago. A PEG ratio below one is an indication that a stock may be undervalued.
At the time of publication, Ponsi was long NVDA.