Oil Was Discovered on TV Today
Figuratively speaking, of course. Plus, stocks are getting overbought.
You've reached your free article limit
You've read 0 of 1 free Pro articles.
The Market
Finally, a down day. And we are still short-term overbought. You can see the Overbought/Oversold Oscillator is at the top of the page.
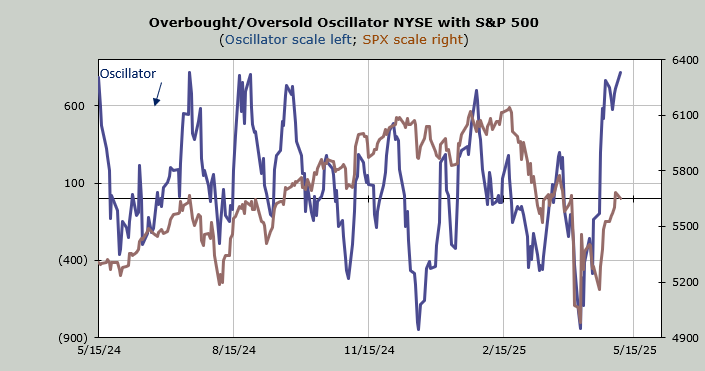
You can also see the numbers this Oscillator is dropping over the next week. There is no doubt that it will be hard to chime in with higher numbers on Tuesday, Wednesday, and Thursday this week as we drop those big numbers off the ten-day moving average.
This doesn’t mean we will go down every day, but the upside momentum will be tough.
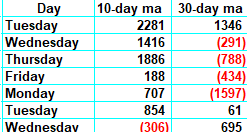
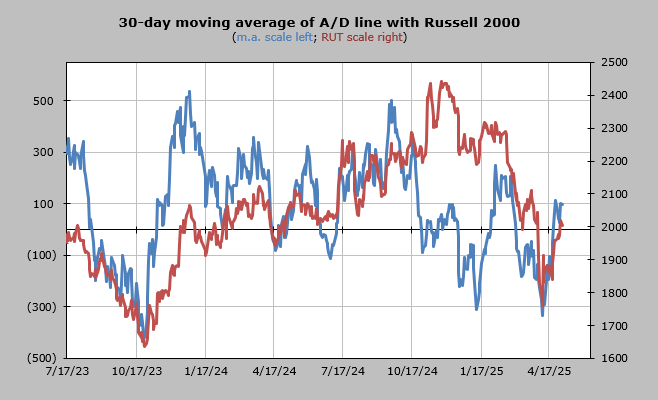
If you look at that table above, you will see there are still some red numbers to drop on the 30-day moving average (chart shown below). They are not big red numbers, but they are red. In about two weeks’ time, the 30-day will stop dropping red numbers, which will make that intermediate term indicator overbought.
Typically, what happens is we get a pullback (from that obvious resistance at 5700 on the S&P) and we rally again. If that pattern comes to pass, that next rally becomes the test. Do folks get more bullish on that rally? Does breadth begin to lag? Does the McClellan Summation Index roll over?
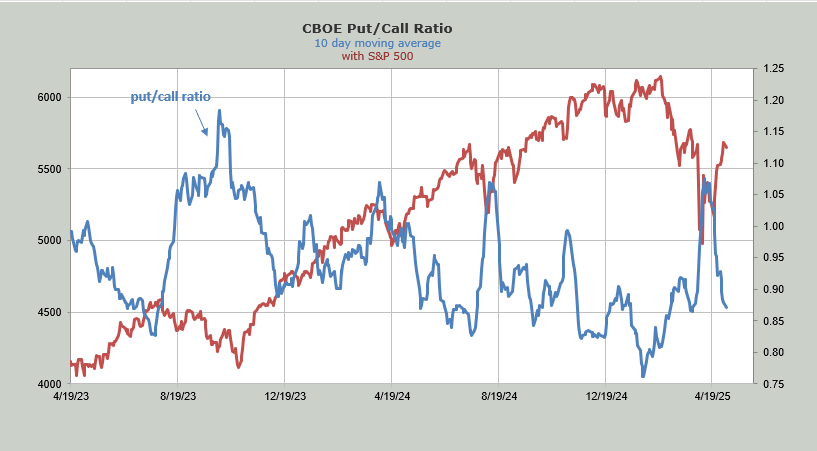
If we get some of those indicators rolling over, then I’d start to look for a decline, especially if sentiment has pushed toward the bullish camp. I expect we’ll see the first real change in sentiment in the ten-day moving average of the put/call ratio. It is currently around 0.88. Once it gets under 0.85, I consider that a major change in sentiment (right now it’s only a minor one).
New Ideas
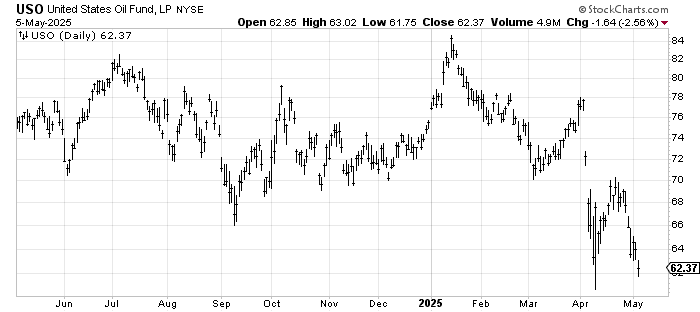
The folks on TV finally ‘discovered’ oil today with the OPEC announcement. The DSI, which was 10 last week is 13 tonight. I’d love to see a single digit reading tomorrow (likely would only come with another buck loss in oil) but my sense that spike lows tend not to break (or not break by much) still holds. I expect we’re close to an energy rally.
Today’s Indicator
The 30-day moving average of the advance/decline line is discussed above.
Q&A/Reader’s Feedback
Helene welcomes your questions about Top Stocks and her charting strategy and techniques. Please send an email directly to Helene with your questions. However, please remember that TheStreet.com Top Stocks is not intended to provide personalized investment advice. Email Helene here.
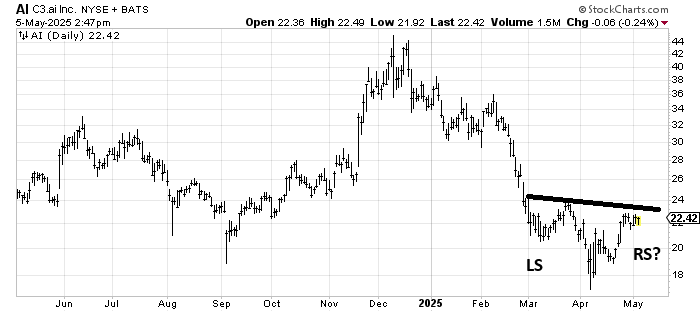
C3 ai AI has the best ticker around when it comes to AI stocks. The chart isn’t bad either. It has developed a potential head and shoulders bottom. If it breaks out, it would measure near 30, which happens to be the next resistance.
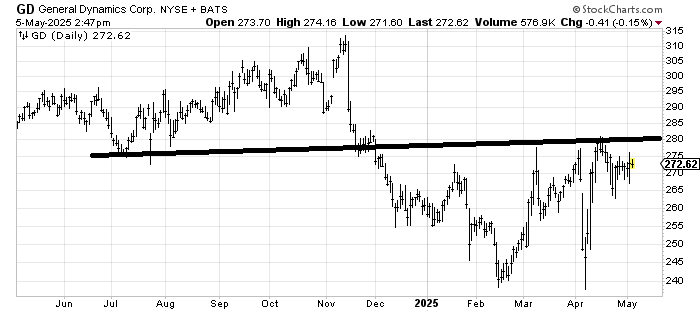
General Dynamics GD is trying to make a bottom. I am not certain I would call a move over 280 a breakout since there is still resistance all the way up, but the stock has been building a base for five months now.
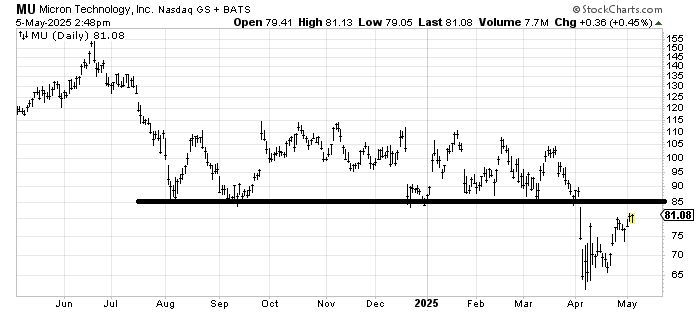
Micron MU does not have a base to speak of. And it has a lot of resistance starting at 85 all the way up to 110. That makes it hard for me to get excited over the stock right here.
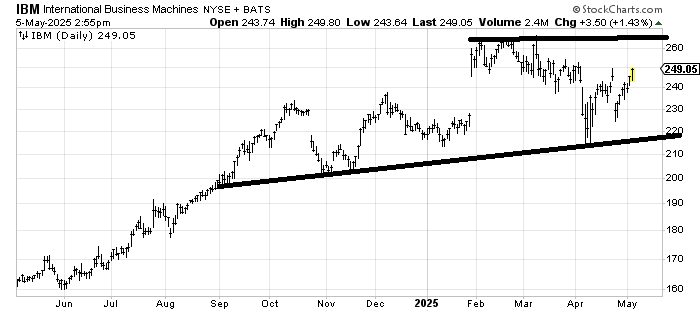
IBM IBM has resistance all the way up, so it’s hard for me to get excited about it here, but in general, the first quarter decline basically filled the gap and did not make a lower low, so I’d say the trend is intact. I just can’t get excited unless/until it pulls back or sets up a better pattern.
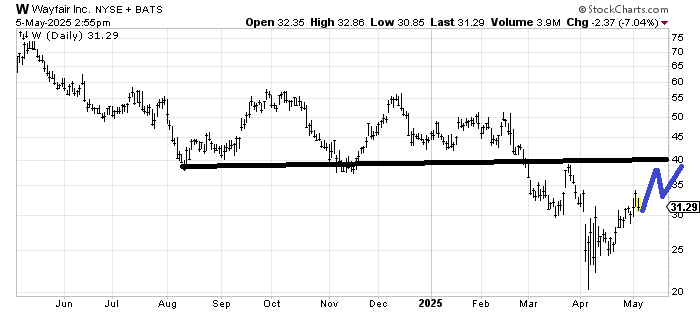
Wayfair W met its downside target when it got to 25 in early April (and subsequently whooshed to 20). It ought to start the bottoming process now. Much will depend on how it handles the current pullback. If it can hold 29-30, then I’d look for a rally near the upper 30s, then another pullback, then another rally, maybe to 40, then a pullback, etc., as it tries to eat through the resistance. Right now, it’s just the potential for a base because it hit the target.