Is the Market Fine, or Is it Shaping Up to Be a Redo of 2022?
The major indexes have yet to break, but a minor shift in sentiment suggests that traders could be turning bearish.
You've reached your free article limit
You've read 0 of 1 free Pro articles.

The Market
I want desperately to tell you that there was panic in the market today, but I did not see it.
We saw down volume clock in at 78%, so no panic there. We saw the put/call ratio at .93. I’ll call that a bit more concern, but nothing special. We saw the VIX head upward, which I give credit to.
But we saw the Transports green. We saw Staples green. We saw Utes green. In a panic, we see a market that feels like there is nowhere to run and nowhere to hide, so as long as folks are hiding in staples and drugs and utes, there is no panic.
So, is this a bear market? I have said it before. I have compared this market decline to 2022. The only place that doesn’t seem to know it is the major indexes because they do not break. A few weeks ago, I noted the levels. They have still not broken. That puts a lot of charts in the middle of nowhere.
Before I get to sentiment, I want to answer a question on the ‘others’. When I refer to the ‘others’, I mean mostly the RSP or IWM names. Anything that is not a mega cap/large cap tech stock—the names that move the indexes. At some point, this ‘game’ will change, and it will change because, as the mega-cap tech stocks see their prices fall and some of the others see their prices lift, the jaws that were so wide for so long contract and narrow.
Anecdotally, almost every guest on television seems to think the market is just fine. They point to the staples as a place that is ‘working’ in the market. I want to take you back to late September when I first recommended Proctor and Gamble. At the time, there were folks recommending nearly every group out there but, blech, not the staples! Eww.
That sentiment remained in place for much of October. Even a week or so ago, we heard what a terrible thing it is to have a market that is led by staples, utes, and drugs. I heard none of that this week. Now it’s a blessing that these groups are rallying or at least not falling. You see that subtle change in sentiment?
But that is anecdotal. What is not anecdotal is that the Investors’ Intelligence numbers are not far from flipping to more bears than bulls. The ratio of bulls to bears is 1.54 as of last week. Get that under 1.0, and I’ll think we’ve really pushed sentiment to bearish. Another week or so of put/call ratio readings in the 90s and maybe we’ll have pushed the ten-day moving average up near .95. Give us a few readings over 1.0 and then we’ll have seen a real change.
But now it’s time to turn your attention to the DSI for the S&P. It is now 25. We talked about this a few weeks ago when it got into the 30s. Then the market rallied for a day or so, and it didn’t go much lower. Until now. Get this into the teens, and we’ll be close to seeing this into the yellow zone (15 or under). Nasdaq is at 30, which is a bit surprising (should be lower than the S&P, but I don’t make the rules!). Anyway, there is nothing to fuss over yet, but this is now getting within the range where we need to pay attention.
Since we’ve now seen three straight red days for the major indexes, we probably see a rally tomorrow, but we should hope we don’t because we want to get to Panic. That is the way to get to a decent, playable rally.
New Ideas
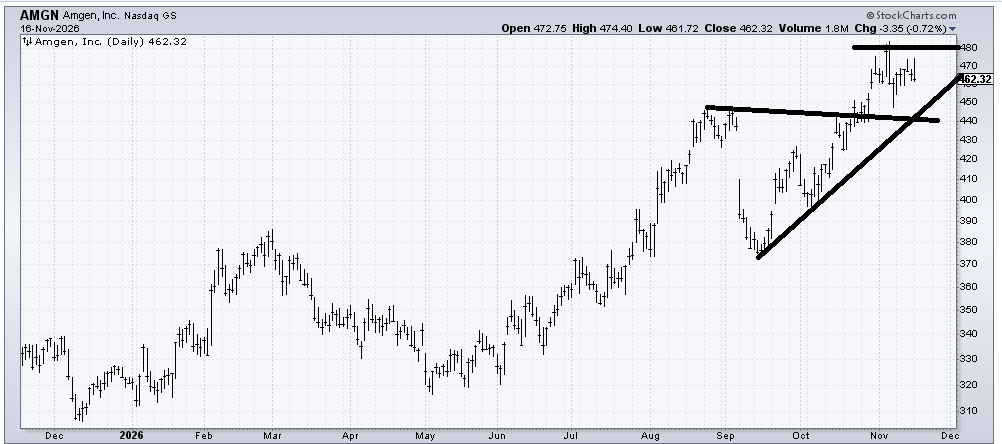
Amgen (AMGN) has done nothing wrong yet. But someone asked about it recently, so I want to follow up by noting I think the stock is vulnerable, back into that 440 area.
Today’s Indicator
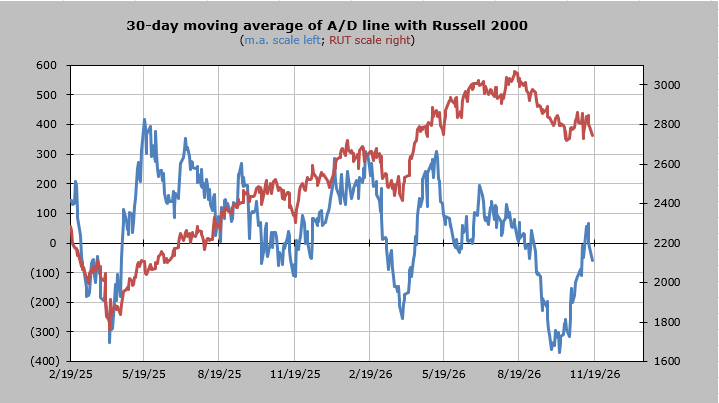
The 30-day moving average of the advance/decline line is overbought.
Q&A/Reader’s Feedback
Helene welcomes your questions about Top Stocks and her charting strategy and techniques. Please send an email directly to Helene with your questions. However, please remember that TheStreet.com Top Stocks is not intended to provide personalized investment advice. Email Helene here.
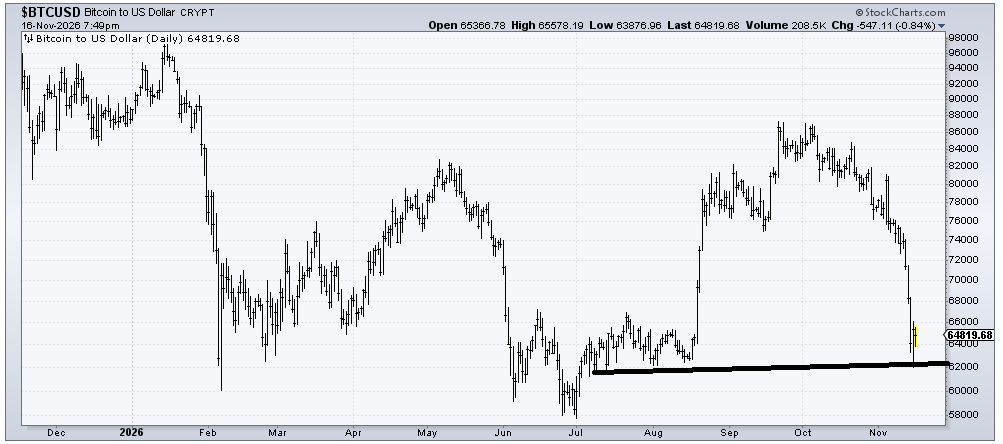
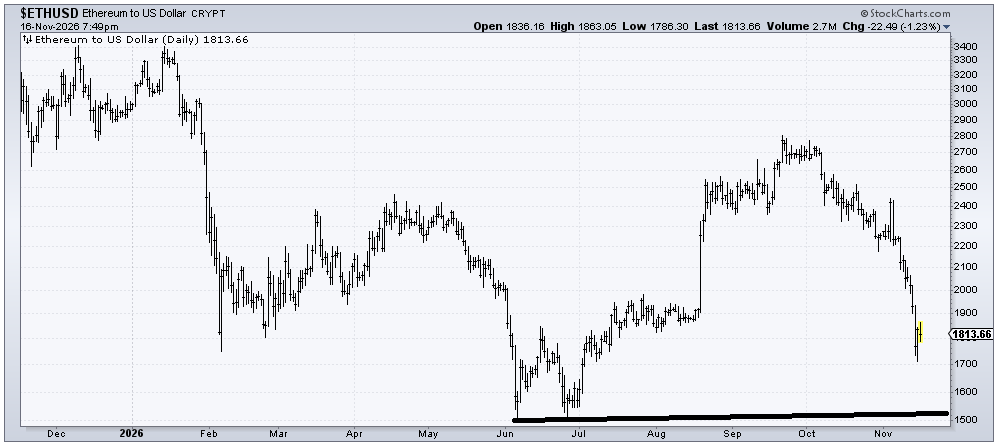
Ethereum and Bitcoin have the same chart, so if I thought that these were anything but scams, I might think they are both making the right shoulder of a head-and-shoulders bottom. More so, I would look to the DSI for a sign it has gone too far, and unless/until the DSI for BTC gets to single digits, the best I can say is oversold enough to bounce. The current DSI is still over 20.
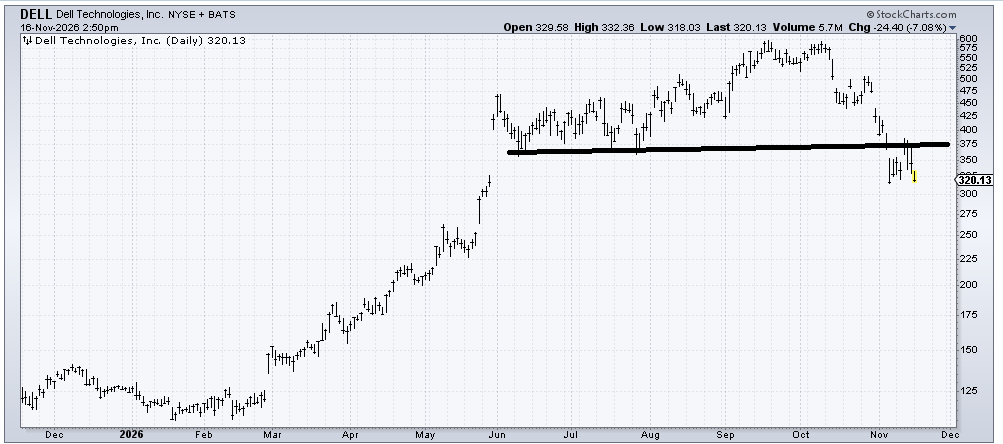
Dell (DELL) filled that gap at 375 and could do no more. So far, it has been unable to break the recent low, but I expect it will. Maybe not this week or next week, but unless this can get back over 375 like it means it, that’s a top that has broken down.
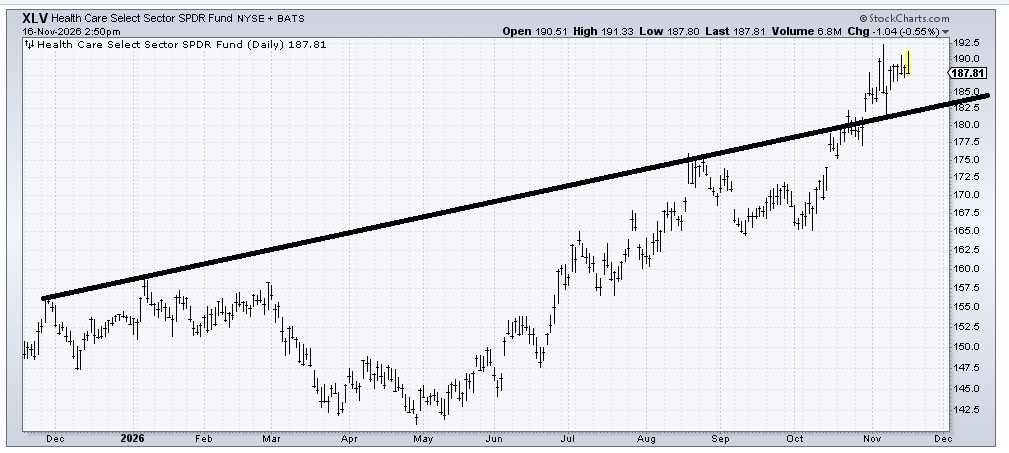
XLV is a long-term bullish chart, but I still think it has gone too far and is overbought. If it breaks back under that line, it would be bearish. I’m a profit taker in the short term, but otherwise it hasn’t done anything wrong.
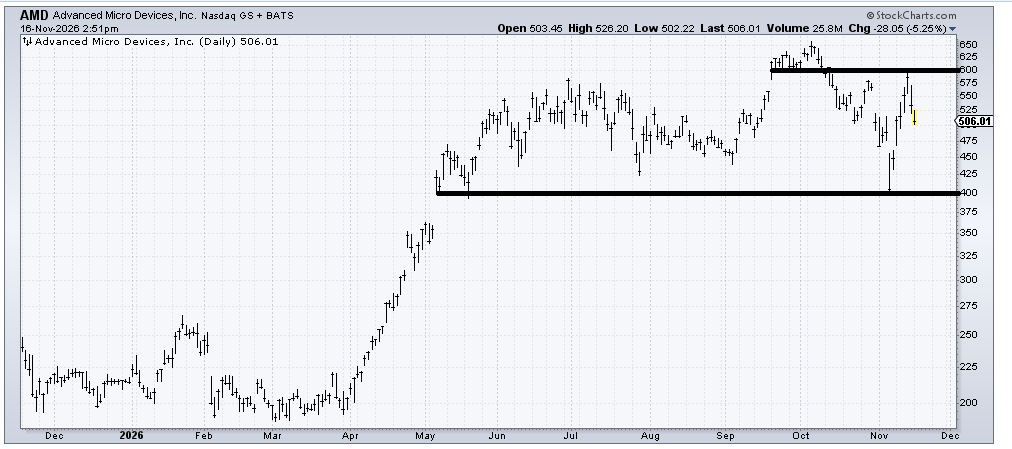
Advanced Micro Devices (AMD) is just trapped between support at 400 and resistance at 600. If we had some panic and 400 did not break, then I’d be happy to like AMD, but overall the best I can say is trading range. I would not fall in love.
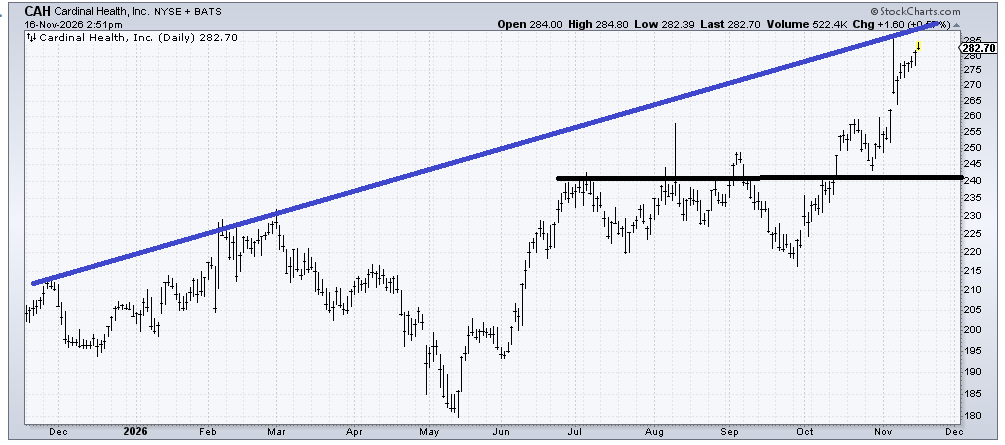
Cardinal Health (CAH) is overbought and nearing resistance from that blue line. That’s the worst I can say about it. I would like to see it correct and curl under because up here it’s been green for far too many days in a row that it is vulnerable to a short-term pullback.
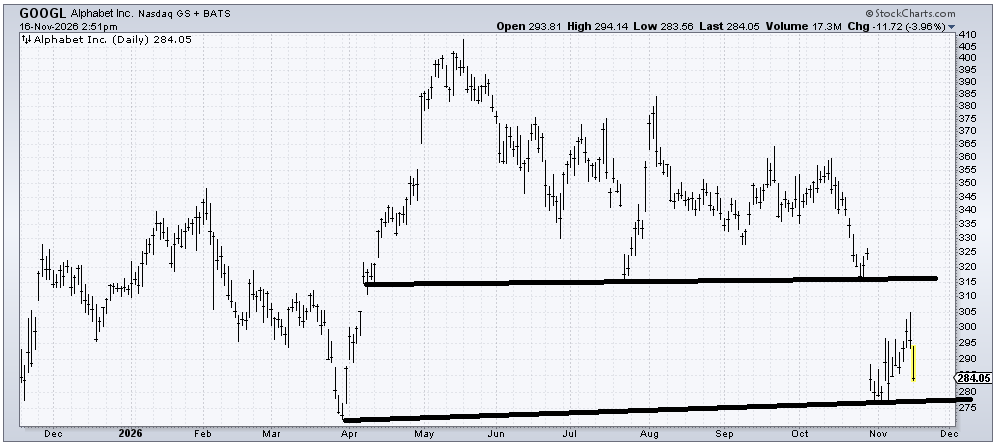
Alphabet (GOOGL) is trying to form a bottom (it’s a long way off from that) after having gapped down in October. I suspect on a short-term basis, it does not break 275 on this trip down. The first trip down to a spike low tends to hold in the near term.