I See an Oversold Condition in July. Here's Why.
Today, we look at some of my favorite charts to see why we could get to oversold in July. Plus, BBY, RH, GOOGL, and XME.
You've reached your free article limit
You've read 0 of 1 free Pro articles.
The Market
For the last few days, I have noted that if we can get the Russell to be choppy to down in the next two weeks, I think we set up for a rally in July in the others. I know today the Russell was green for the second straight day, but once NVDA started rallying, everything else basically stopped.
I want to show you a few charts as to why I see an oversold condition for July.
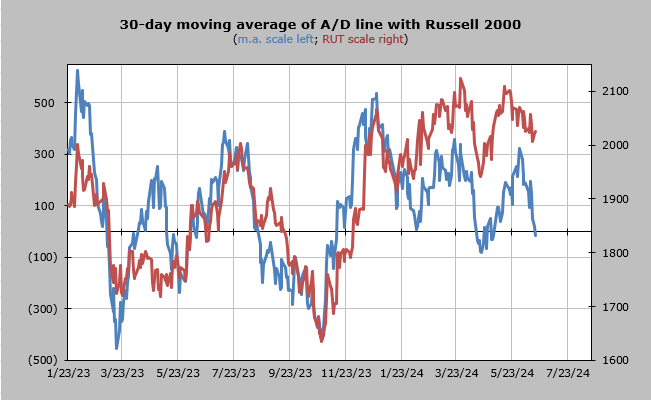
The 30-day moving average of the advance/decline line has been heading down for more than a month. I noted last night that it should get oversold in late June/early July. That is still the case. Only now you can see it is just under the zero line for the first time since April.
The Volume Indicator is at 48%. It gets oversold at 47% or under.
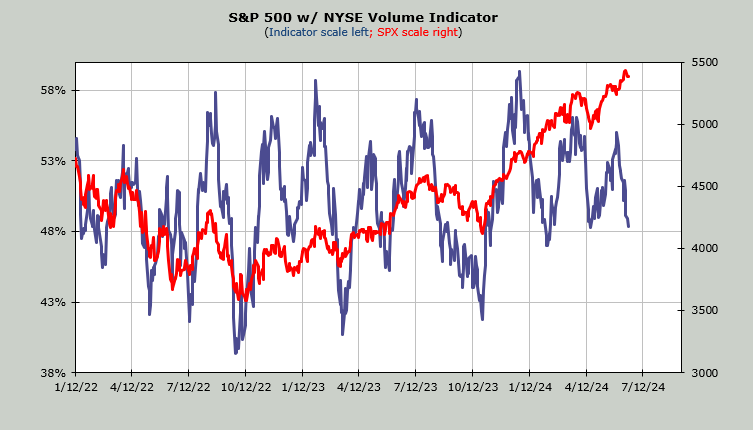
That is how much selling we have seen in this market over the last month. I would like the entire market to back off in the next few weeks because that should lead to a better set up.
The biggest challenge, as I see it, is sentiment. It remains elevated and complacent. That’s why a good scare would go a long way.
New Ideas
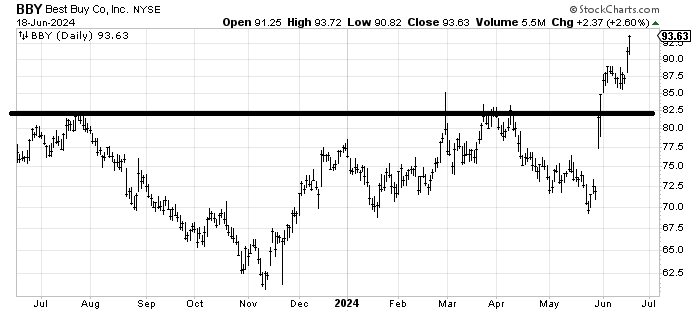
I was asked if the move up in Best Buy BBY a few days ago was a breakout. I would consider the move up in late May to be the breakout. The base measures to the 102 area. There is also the 90/100 rule that says 90% of the stocks that make it to 90 will make it to 100.
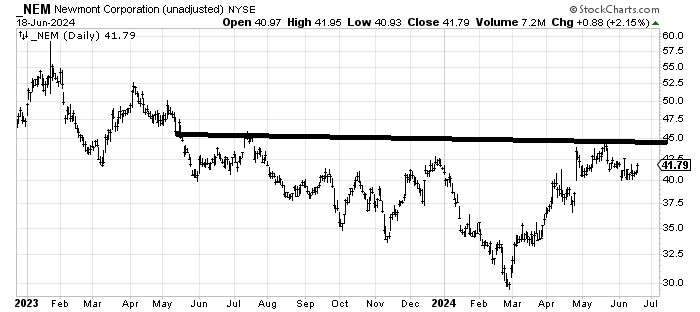
I also want to follow up with the person who asked about Newmont Mining NEM about a month ago. I was non-plussed with the stock as it approached 45 but it has since tagged 40 and held. I think it will take some fits and starts but it’s improved with the pullback.
Today's Indicator
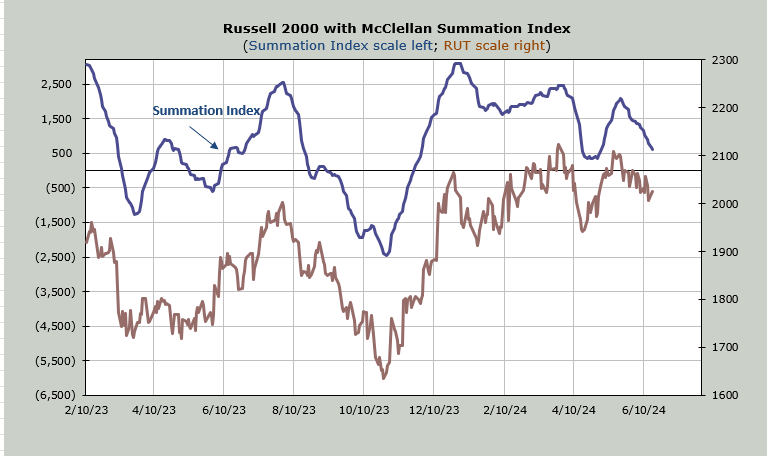
The McClellan Summation Index is still heading down.
Q&A/Reader’s Feedback
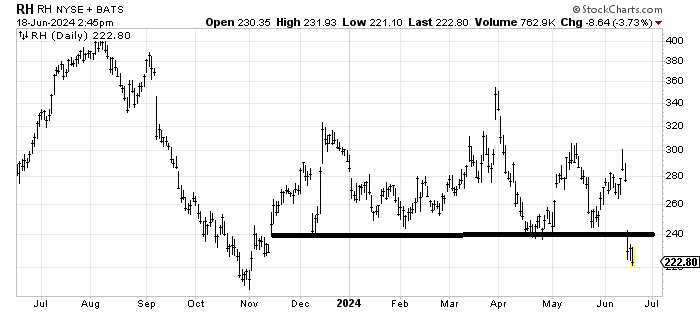
The problem with RH RH is not that it has a measured target much lower than this, the problem is that getting back over 240 is going to be a big problem. It broke on a gap but it still has support from the October low—and we know in this market stocks bend but they don’t break. So after several days of milling around on the downside the stock ought to rally but getting back over 240-250 is going to be incredibly difficult.
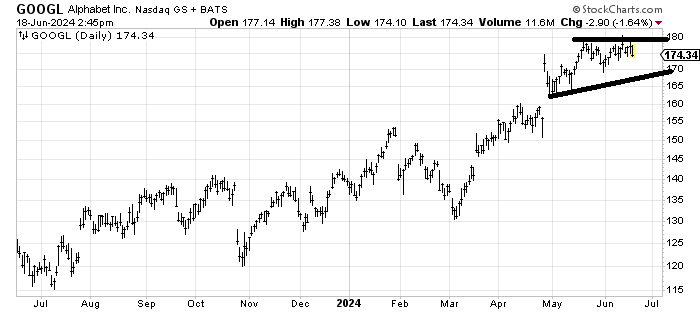
When we last checked in on Alphabet GOOGL, it had gapped up on earnings in late April. At the time I had been bullish on the stock but had a measured target in the 170 area. It has spent the last two months in this 170 area. I am just waiting for the chart to set up again, the same way it did in the spring. I am not bearish on it, just waiting for the set up that takes it up and over 180.
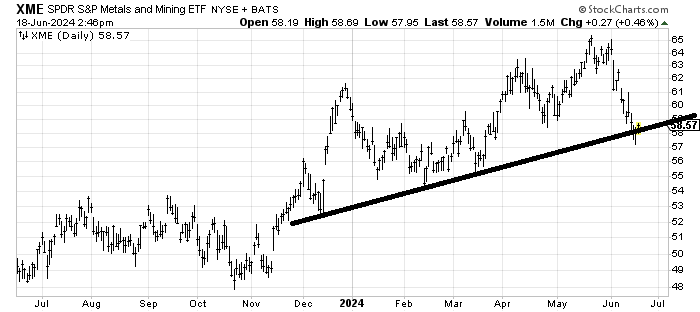
We looked at XME recently and I thought it was still in a correction. It has since come down to tag that line. It’s probably going to take some time to bounce around now. Recall I think if we can get the others to chop around and do some work down here through late June these stocks should set up for a July rally.