The Rising Tide Is Not Lifting All Boats
More money is chasing fewer names.
You've reached your free article limit
You've read 0 of 1 free Pro articles.
As we close out a busy week dominated by Nvidia NVDA, Friday's jobs report and yes... "Roaring Kitting," let's drill down on the markets charts and data to see where we're headed next.
The major equity indexes closed mostly lower Thursday and at various points within their intraday ranges that left the trends unchanged and mixed (see below). We would note the one questionable internal in Thursday’s action as market breadth was negative on the NYSE and Nasdaq, but up/down volume was positive. More money chasing fewer names.
Cumulative market breadth is less than thrilling. And while the bulk of the data dashboard is neutral, forward valuation for the S&P 500 still appears to be quite extended above ballpark fair value.
We continue to approach the equity markets with some caution.
Weak Session Leaves Chart Trends Unchanged
On the charts, the major equity indexes mostly posted losses Thursday with only the DJIA managing to end in the green zone.
Market internals were questionable as market breadth was bearish but up volumes were above down volumes as money chased fewer names.
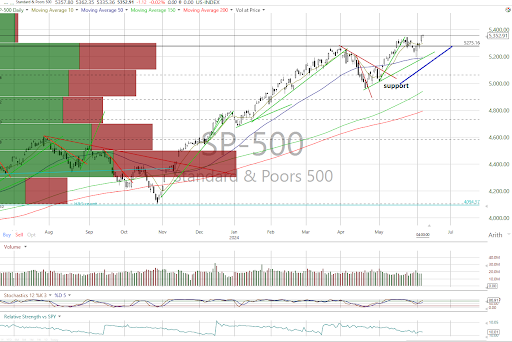
There were no changes in trend with the S&P 500 (see below), Nasdaq Composite and Nasdaq 100 bullish, the DJIA and Dow Jones Transports neutral, and the Midcap 400 and Russell 2000 bearish.
The NYSE is no longer offering the Value Line Arithmetic Index.
Cumulative market breadth is tepid with the NYSE and All Exchange advance/decline lines neutral with the Nasdaq’s bearish.
Some stochastic levels are now overbought but have not generated bearish crossover signals so far.
Data Largely Neutral
The 1-Day McClellan Overbought/Oversold Oscillator are still neutral (All Exchange: -15.48 NYSE: -15.04 Nasdaq: -16.9+7).
The percentage of S&P 500 issues trading above their 50-day moving averages (contrarian indicator) rose to 49% staying neutral.
The detrended Rydex Ratio (contrarian indicator) has shifted from its prior bearish signal to neutral at 9.0%.
This week’s AAII Bear/Bull Ratio (contrarian indicator) dropped to 0.6 and is also neutral as the number of bulls increased.
However, the Investors Intelligence Bear/Bull Ratio (contrary indicator) is bearish at 17.9/58.2 as bulls also increased and outweigh bears.
The Open Insider Buy/Sell Ratio is neutral and unchanged at 39.5.
Leveraged ETF sentiment is -8.8, remaining neutral.
S&P Valuation Remains Extended
The 12-month consensus earnings estimate for the S&P 500 from Bloomberg slipped to $252.96 per share. Its forward P/E multiple at 21.2x remains well above the “rule of 20” ballpark fair value of 15.7x. This continues to be an important concern for us as a 500-basis point premium is significant.
The S&P's earnings yield is 4.73%.
The 10-Year Treasury yield dropped to 4.28. Its intermediate term trend is negative with support at 4.24% and resistance at 4.42%.
The U.S. dollar, via the UUP ETF, closed lower at $28.53. It is neutral with support is $28.4 and $28.65 is resistance.
Bottom Line
Not all boats are rising as some of the indexes may imply. Breadth is questionable while risk is high on individual names that are trading at premiums to their projected one-year growth rates and seeing significant losses if they disappoint. It is a stock picker's market and should be approached as such.
We are still honoring sell signals on individual names while being very selective on the buy side.