Are the Semis Setting Up for an Oversold Rally?
After that, however, the market looks weak. Here’s why.
You've reached your free article limit
You've read 0 of 1 free Pro articles.

Two months ago, if you turned on financial television, all you heard was how great the semis and tech and AI were. All you heard was how it was AI that was powering the economy ahead (probably true!).
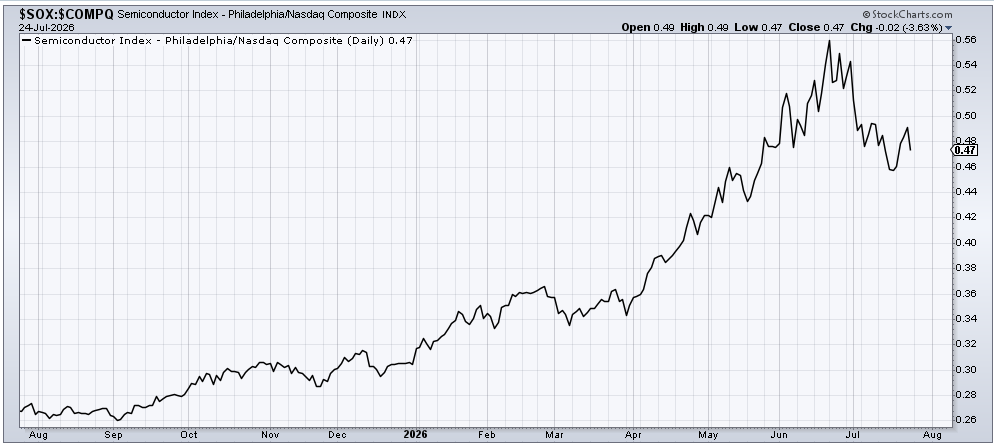
Two months ago, these same folks told us to be bullish as long as the SOX (or SMH) was outperforming the S&P. Long-time readers know that I lean toward the SOX relative to the Nasdaq Composite. That peaked the third week of June.
They don’t say that anymore, though. In fact, it seems they now ignore that this has been trending down for a month, and yet they remain bullish on the S&P. My conclusion is they are perma bulls or live in the Church of What’s Working Now. But they weren’t wrong: we should watch the SOX relative to the major indexes.
So, let’s keep our eyes on this ratio of the SOX to Nasdaq because at least last week it did not make a lower low.
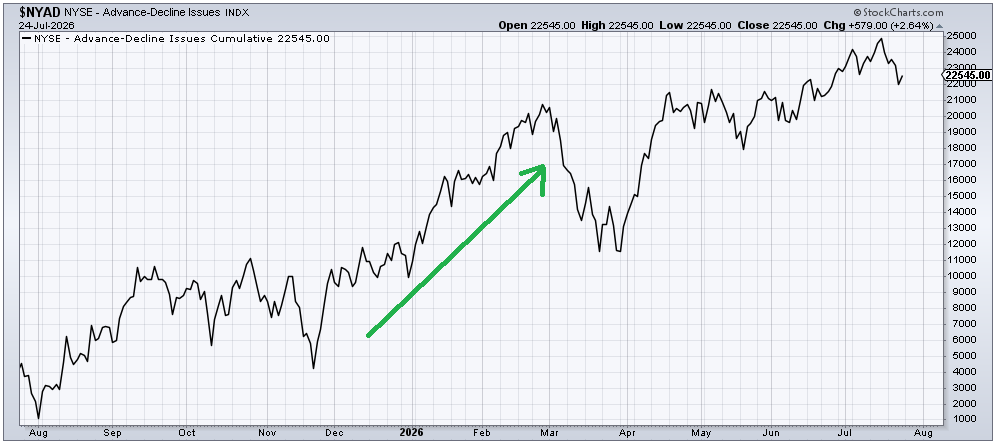
The best I can tell, the theme has switched from how great the semis/tech is to the catch-all ‘broadening out’. If there is so much broadening out, then why is the Cumulative advance/decline line not only below its high but barely higher than it was in May? If you ask me, broadening out looks more like that move in December through February.
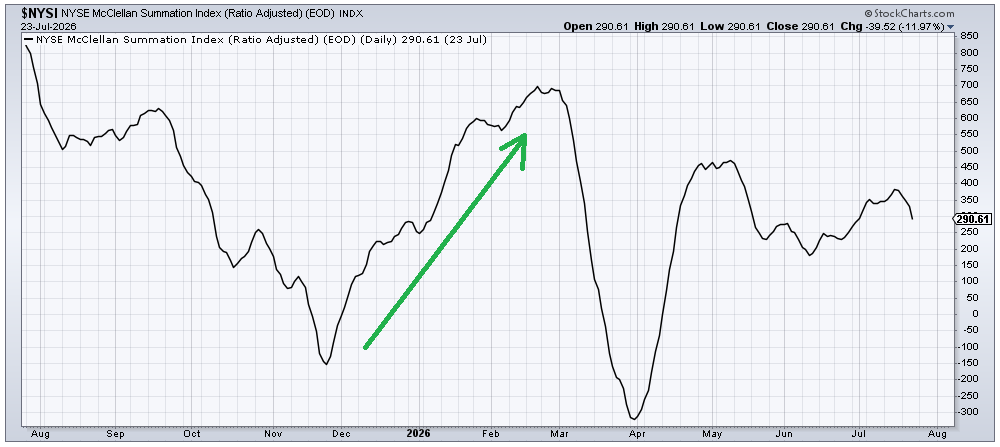
If we are broadening out, then why is the McClellan Summation Index trending down, and from lower highs? It is my view that this is the measure of what the majority of stocks are doing, and right now, that chart says they are heading down from lower highs. If the market was broadening out, shouldn’t it look as it did in that December through February time frame?
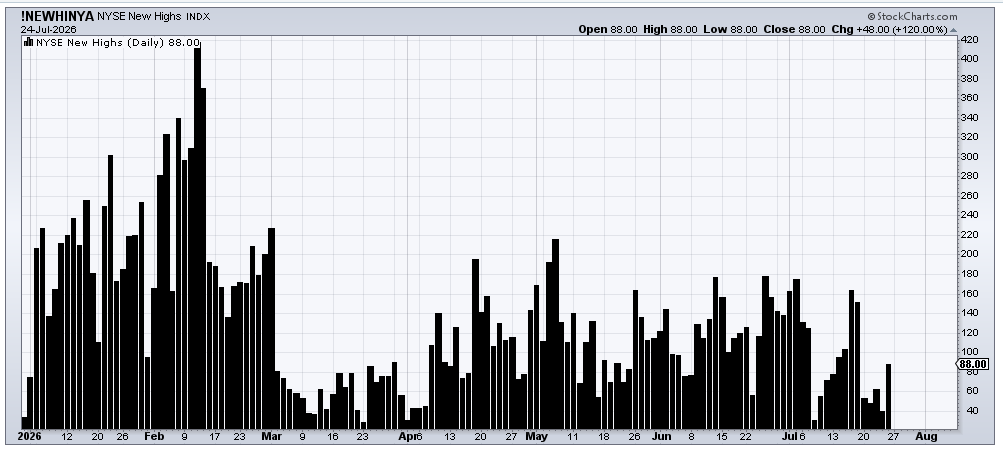
Take a look at the number of stocks making new highs. Shouldn’t broadening out look like the left side of the chart with new highs expanding, and not just expanding but chiming in at numbers well over 200? Now we see the number of new highs at 88 on Friday. That is lower than early July and lower than May. I’m not sure what your definition of broadening out is, but mine would surely be an increase, not a contraction, in stocks making new highs.
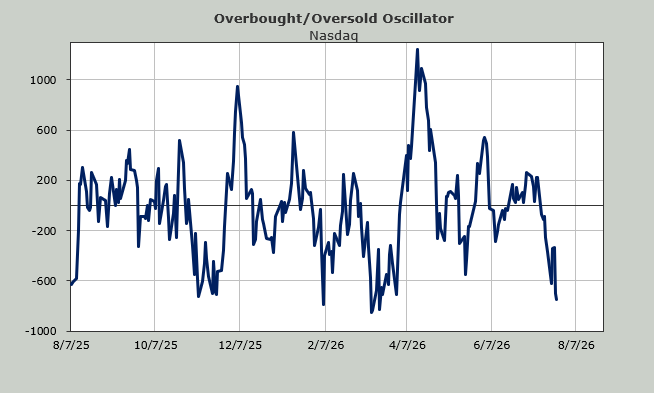
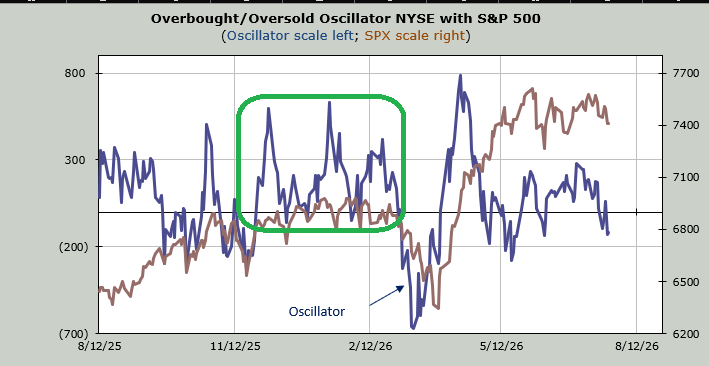
Notice too that the Overbought/Oversold Oscillator, whose input is breadth, spent those months from December to February mostly above the zero line (box on chart). Since mid-May it has been below the zero line twice.
I have been of the mind that semis/tech should enjoy a short-term oversold rally this coming week. I have also been of the mind that the ‘others’ will play catch down in August. I see no reason to change that view right now.