Existing Home Sales Fall to Slowest Pace Since June 2025
Existing home sales drop to lowest pace in over a year while inventories jump, sending ratio to highest since 2015.
You've reached your free article limit
You've read 0 of 1 free Pro articles.

US Existing-Home Sales August: 3.98 million (estimate 3.98 million; previous 4.06 million)
Existing-Home Sales (month-over-month): -2.0% (estimate -1.7%; previous -1.7%)
Median Home Price For Existing Homes: $429,100, up 1.6% from August 2025 (previous $434,100, up 2.0% from July 2025)
Executive Summary
- August existing-home sales fell 2.0% month-over-month — a third straight monthly decline and more than the 1.7% drop expected — to 3.98 million, the weakest pace since June 2025 and only the second time since the fall of 2024 that sales have dipped below 4 million. Sales also turned negative year-over-year at 1.2%, the biggest annual decline since January, though they remain up 1.6% year-to-date.
- Median sale prices eased as is seasonally normal to $429,100, up 1.6% year-over-year, marking the 38th consecutive month of year-over-year price increases.
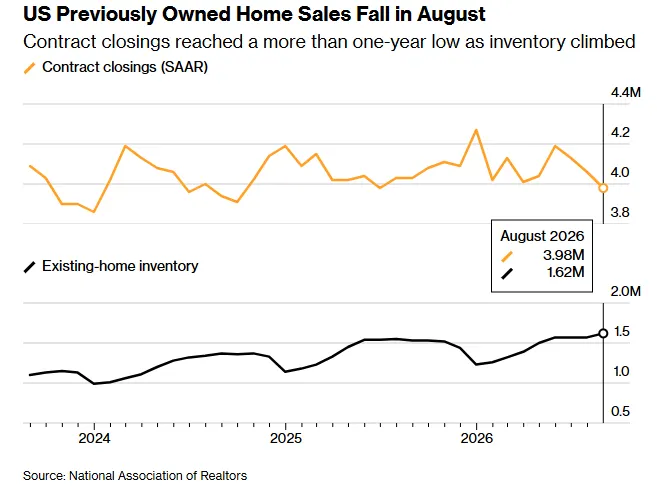
- Inventories jumped 3.2% month-over-month to 1.62 million homes, up 5.9% year-over-year — the first time inventory has exceeded 1.6 million since November 2019 — pushing months’ supply at the current sales pace to 4.9, its highest level in over 10 years.
- Positively, affordability as measured by the National Association of Realtors’ Housing Affordability Index rose to 104.7 from 103.3 in July, a second consecutive monthly improvement, and up 3.5% year-over-year.
Now let’s take a deeper look with lots more detail and charts.
Note: All figures are month-over-month unless otherwise noted. Existing-home sales normally account for about 90% of US housing but currently are around 70% due to limited inventories incentives from new home builders. Sales are calculated when a contract closes, so these are contracts that were executed one to three months ago. New-home sales, which make up the remainder of home sales, are based on contract signings, and will be released in a later report.
August existing-home sales (closings) fell for a third consecutive month, dropping 2.0% from July — more than the 1.7% decline expected — to 3.98 million, the weakest pace in more than a year and, per Bloomberg, only the second time since the fall of 2024 that sales have dipped below 4 million. The National Association of Realtors noted the last time sales activity fell below 4.0 million was June 2025.
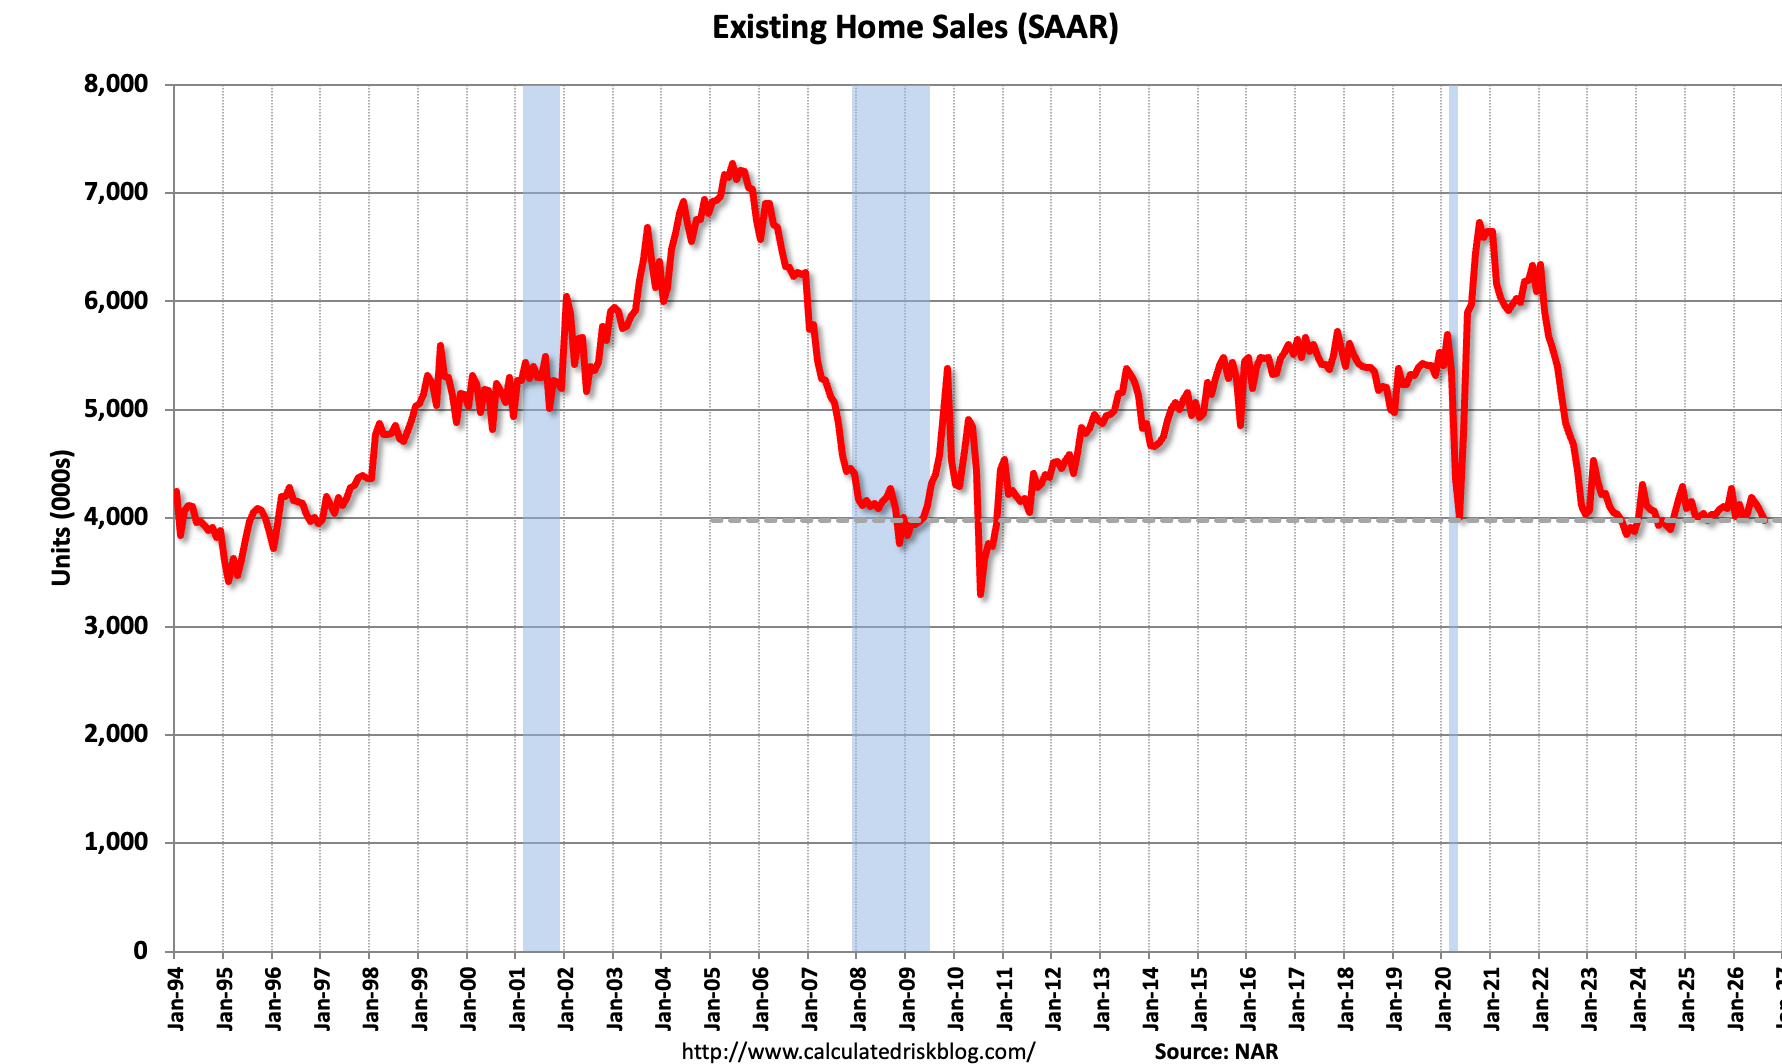
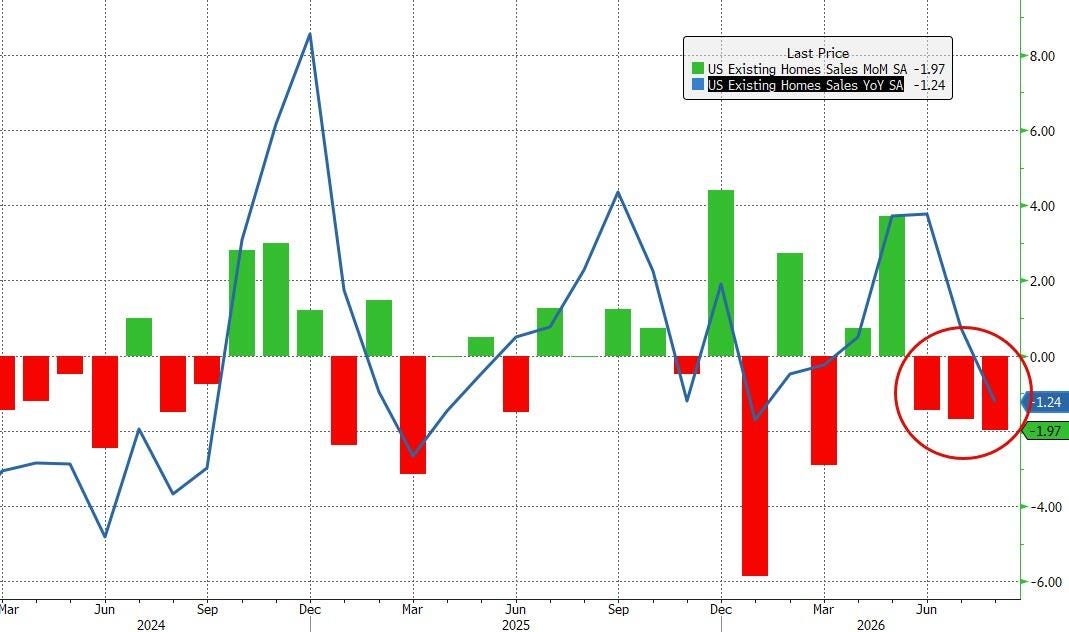
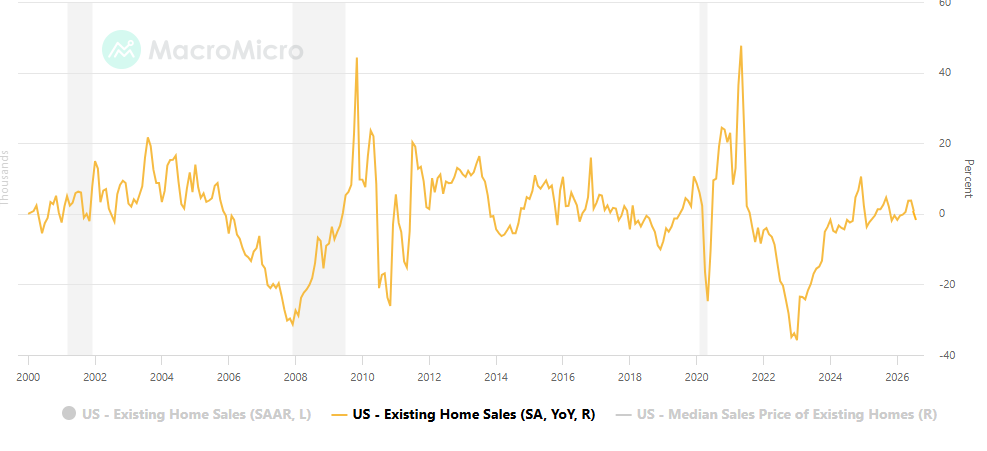
Sales also turned negative year-over-year at 1.2%, the biggest annual decline since January and snapping a four-month streak of year-over-year gains, though sales remain up 1.6% year-to-date. Note as these are closings, contracts were signed one to three months earlier.
“Mortgage rates and home sales move in opposite directions, so it’s not surprising to see a mild dip in home buying activity due to high mortgage rates,” said NAR Chief Economist Lawrence Yun. “Still, home prices are rising, and existing home sales are actually up 1.6% year-to-date through the first eight months of the year. Homebuying demand, despite higher interest rates, is no doubt being supported by rising wages, which grew 3.1% in August, along with 643,000 net new jobs added since the start of the year. Job creation and wage growth typically drive housing demand.”
Per Bloomberg, Yun added on a call with reporters that buyers are “not falling apart” amid rising mortgage rates, though he suggested mortgage rates could soon touch 7%.
Sales held steady in the West and declined in the Northeast, Midwest and South. The South, accounting for over half of sales, fell 1.6% month-over-month to 1.84 million, the weakest in a year, though flat year-over-year. The Northeast fell the most, down 4.0% month-over-month to 480,000 and down 2.0% year-over-year. The Midwest fell 3.1% month-over-month to 940,000, down 2.1% year-over-year. The West was unchanged month-over-month at 720,000 but down 2.7% year-over-year.
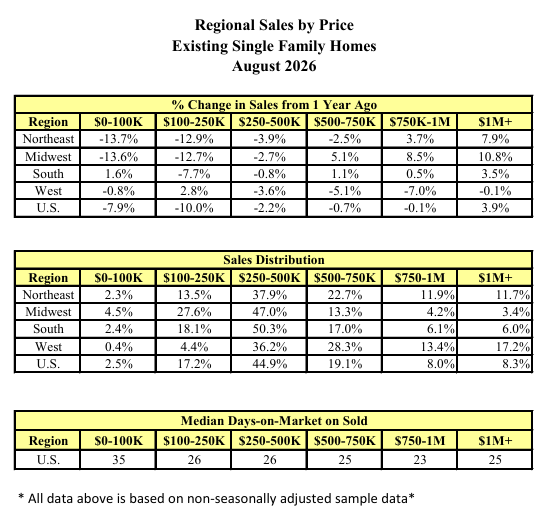
Breaking sales down by price tier (not seasonally adjusted, single-family), the weakness was concentrated at the low end: nationally, sales in the $100,000 to $250,000 band were down 10.0% year-over-year and the under-$100,000 band down 7.9% year-over-year, while the $1 million-plus segment was the only one to grow, up 3.9% year-over-year.
That pattern was most pronounced in the Northeast (under-$250,000 down double digits, $1 million-plus up 7.9%) and the Midwest (under-$250,000 down double digits, $1 million-plus up 10.8%).
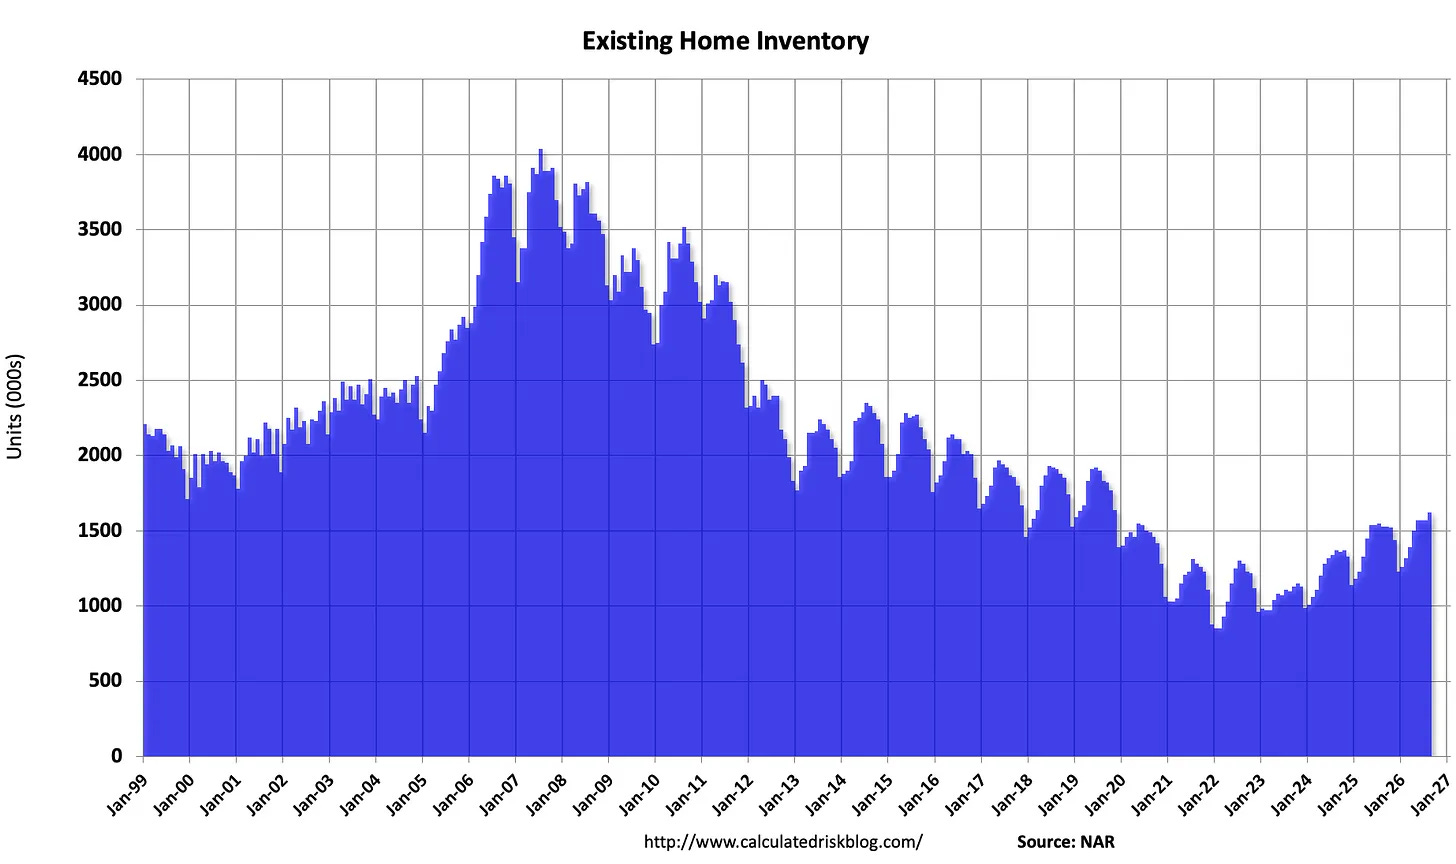
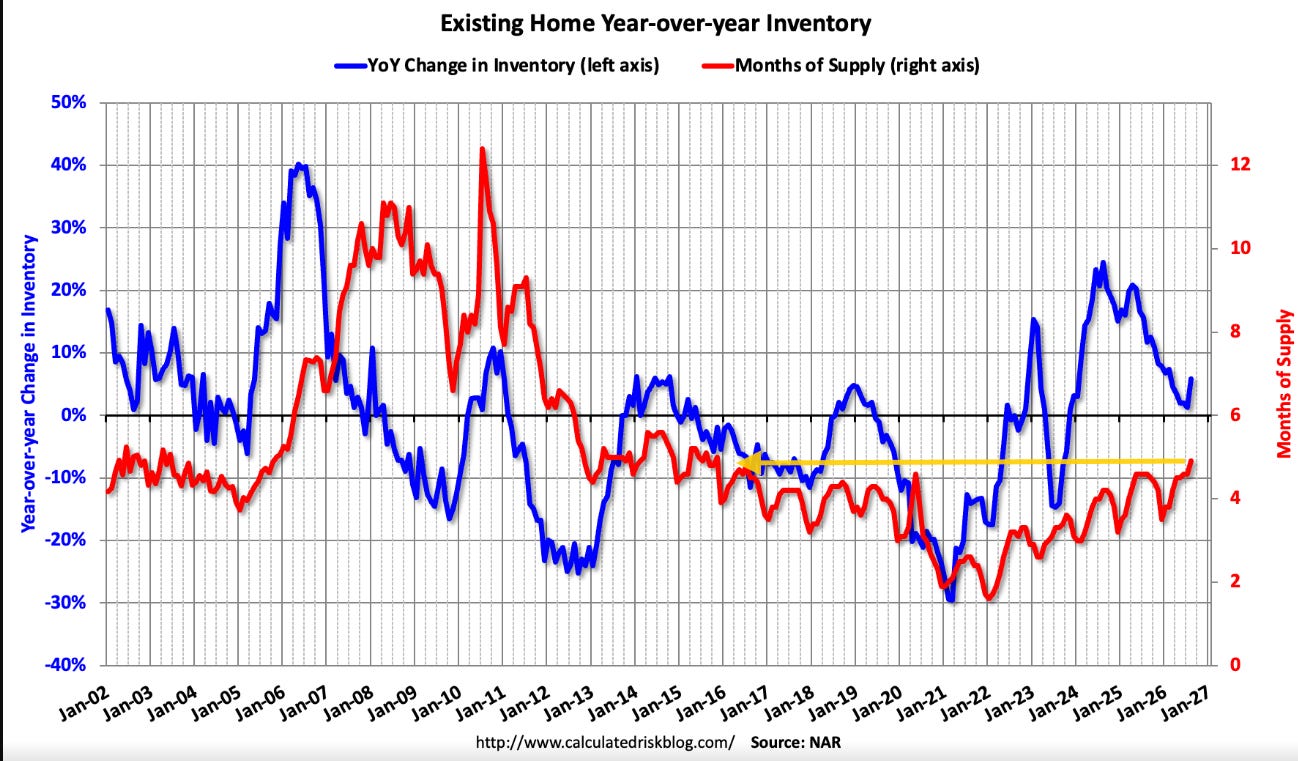
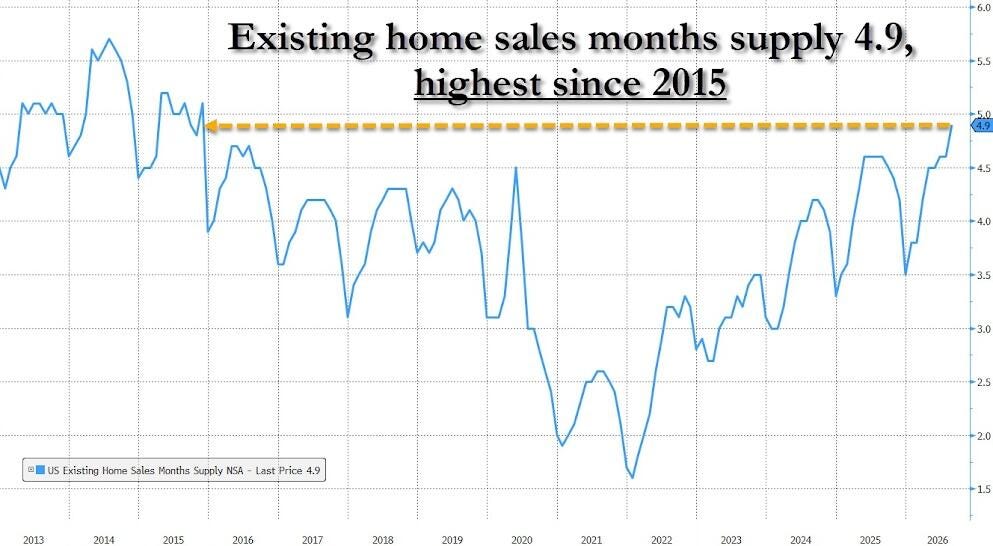
Inventories jumped 3.2% month-over-month to 1.62 million homes (July revised up to 1.57 million) and 5.9% year-over-year — the first time inventory has exceeded 1.6 million units since November 2019 — with months’ supply at the current sales pace rising to 4.9 from 4.6 in both July and a year earlier. That compares with 4.0 months in August 2019, meaning there is considerably more supply now on a months-of-supply basis than before the pandemic, even though the raw inventory count remains below 2019 levels — sales have simply fallen further.
“The number of months it would take to exhaust the total inventory at the current sales pace has grown to 4.9 months’ supply — its highest level in over ten years,” Yun said. “The ample supply of homes for sale on the market is giving homebuyers better opportunities to negotiate.”
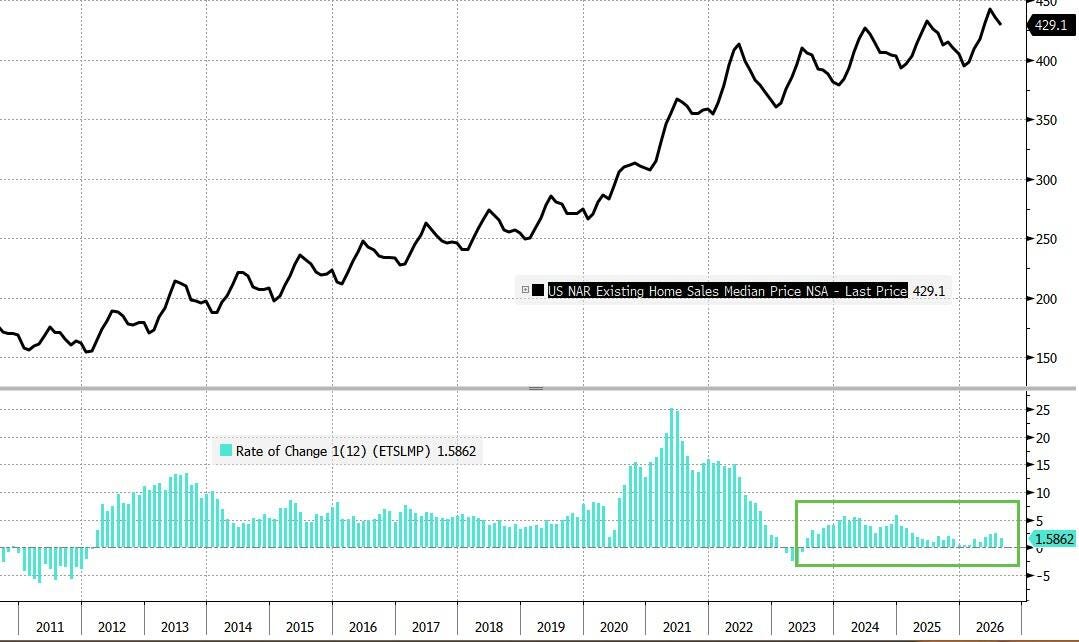
Median sale prices eased to $429,100 from $434,100 in July and are now down 3.1% from June’s all-time record high of $440,600 — a slightly larger than normal seasonal decline through August — up 1.6% year-over-year, marking the 38th consecutive month of year-over-year price increases and extending a streak of annual price increases dating back to mid-2023.
Regionally, median prices were firmer year-over-year outside of the West: Northeast up 4.3% to $556,900, Midwest up 3.3% to $340,400, South up 0.7% to $366,500, and West down 0.2% to $619,100.
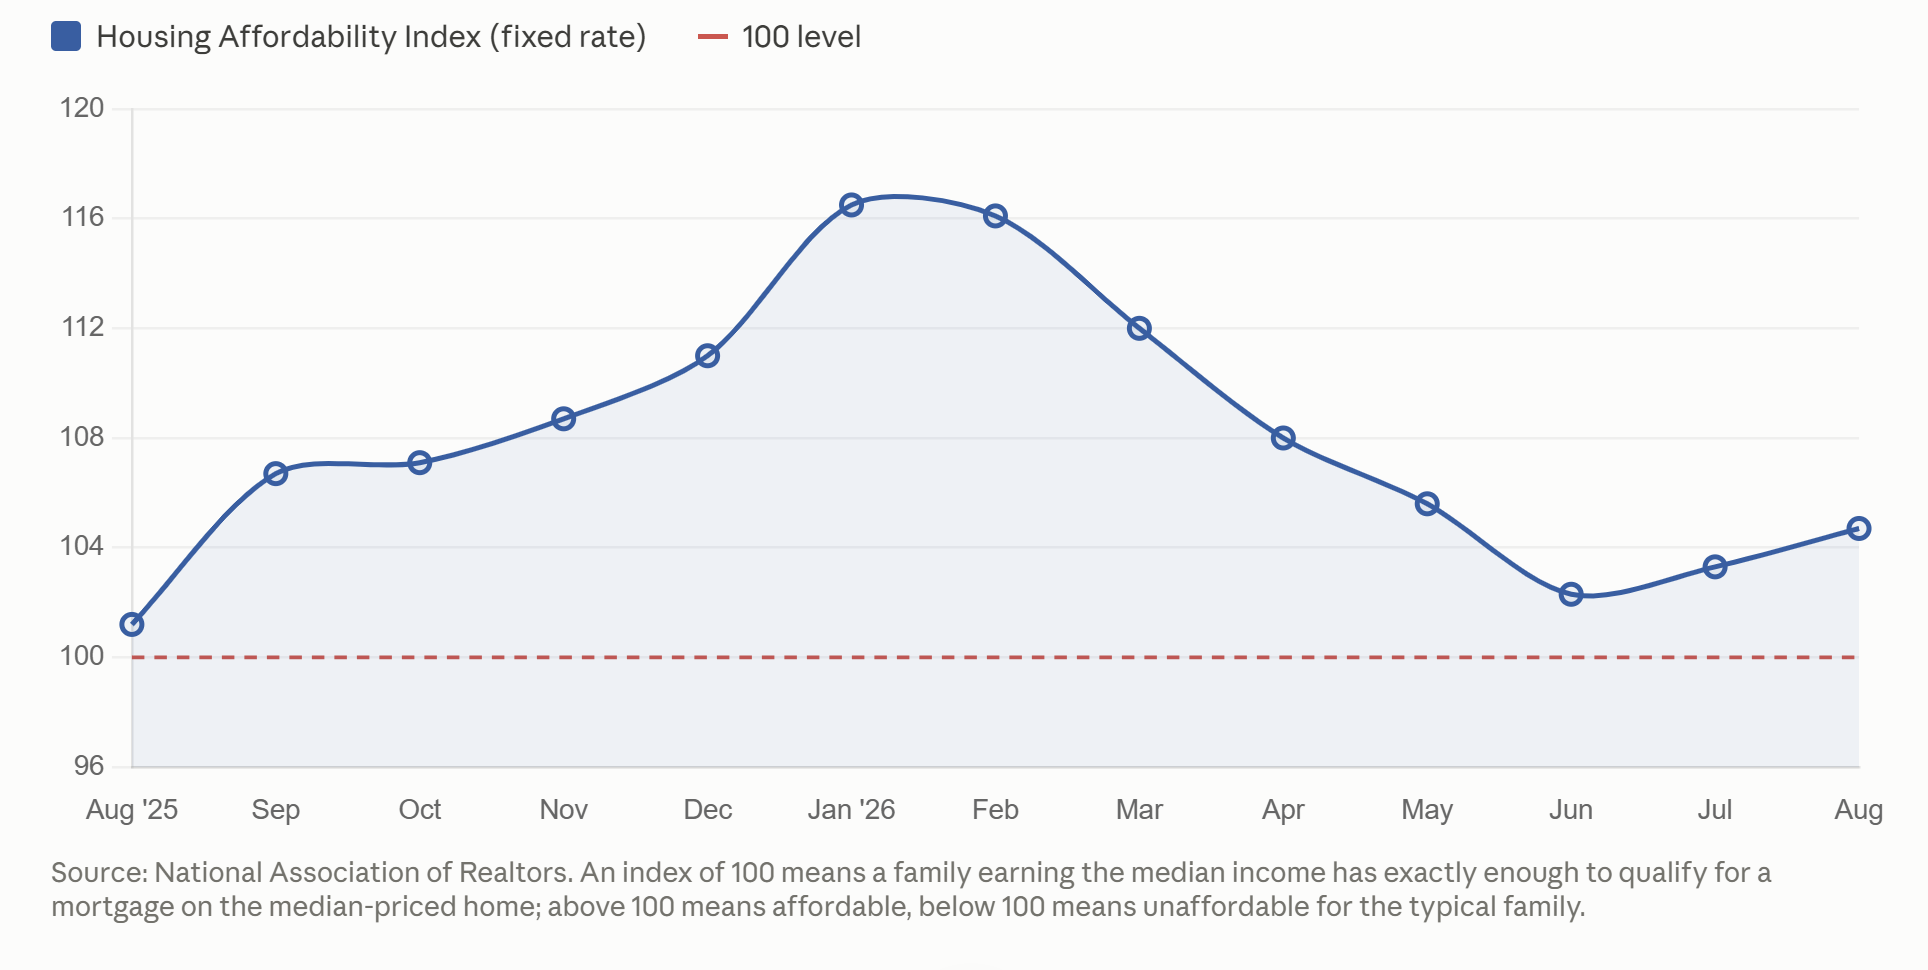
Affordability as measured by NAR’s Housing Affordability Index rose to 104.7 from 103.3 in July (higher is more affordable), a second consecutive monthly improvement, and remains above the 101.2 of a year ago, a 3.5% year-over-year gain, though it remains historically depressed.
Year-over-year affordability improved across all regions, but the pace of improvement continued to narrow sharply: Northeast up 0.5%, Midwest up 1.7%, South up 4.5% and West up 5.9%.
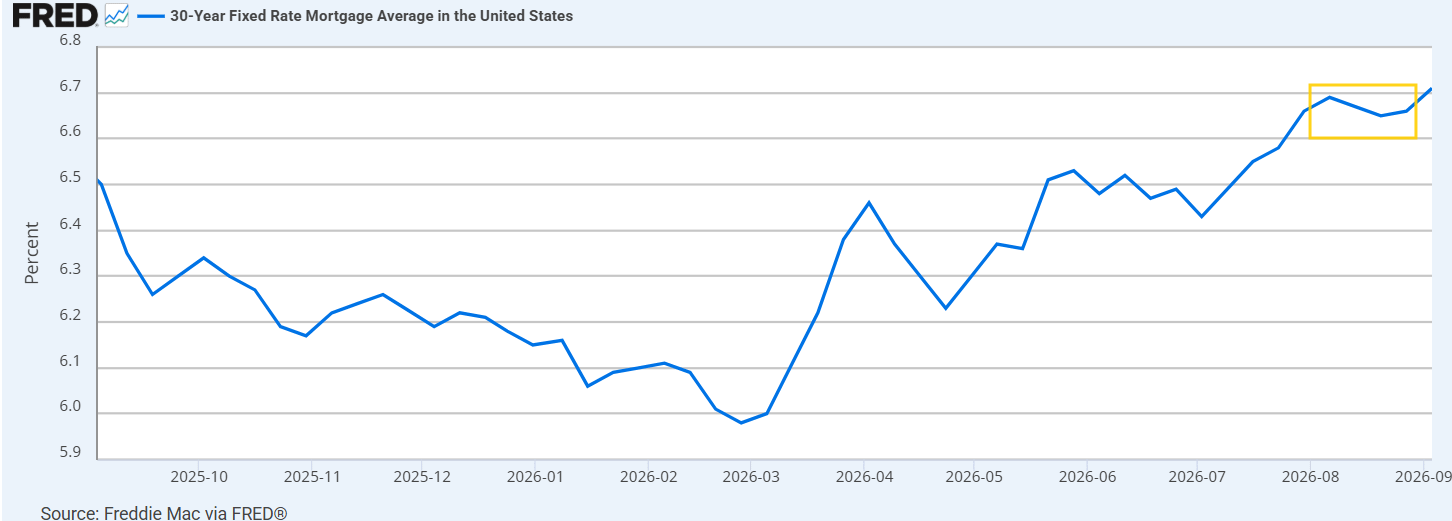
The average 30-year fixed-rate mortgage in August was 6.67%, up from 6.54% in July and — notably — now also up from 6.59% a year ago, the first year-over-year increase in some time. Rates have since climbed to 6.85%, the highest in more than a year. With less than a quarter of outstanding mortgages carrying rates above 6%, according to a recent housing report from Apollo Global Management, the lock-in disincentive to move remains substantial.
Some other stats from the report:
- 31 days: Median time on market for properties, up from 29 days last month and unchanged from 31 days in August 2025.
- 30% of sales were first-time homebuyers, up from 29% in July and 28% one year ago.
- 27% of transactions were cash sales, up from 26% last month but down from 28% in August 2025.
- 15% of transactions were individual investors or second-home buyers, up from 14% last month but down sharply from 21% one year ago.
- 2% of sales were distressed sales (foreclosures and short sales), unchanged from last month and one year ago.
- Single-family sales fell 1.9% month-over-month to 3.62 million, down 1.1% year-over-year (median price $434,800, up 1.7% year-over-year), while condos fell 2.7% month-over-month to 360,000, down 2.7% year-over-year (median price $371,600, up 1.5% year-over-year).
Bill McBride who writes the CalculatedRisk Substack and provides many of the great charts above notes closed sales in August largely reflected contracts signed in June and July, when mortgage rates averaged 6.49% and 6.54%. September closings will reflect July and August contracts at 6.54% and 6.67%, which he says “suggests more weakness ahead.” He characterized August as a “very weak report, with sales down and inventory up,” adding that “more inventory and less sales could impact house prices in the coming months.”
National Association of Realtors — Existing-Home Sales, August 2026
